


Want it delivered daily to your inbox?
-
The housing slowdown in China continues, see chart below.
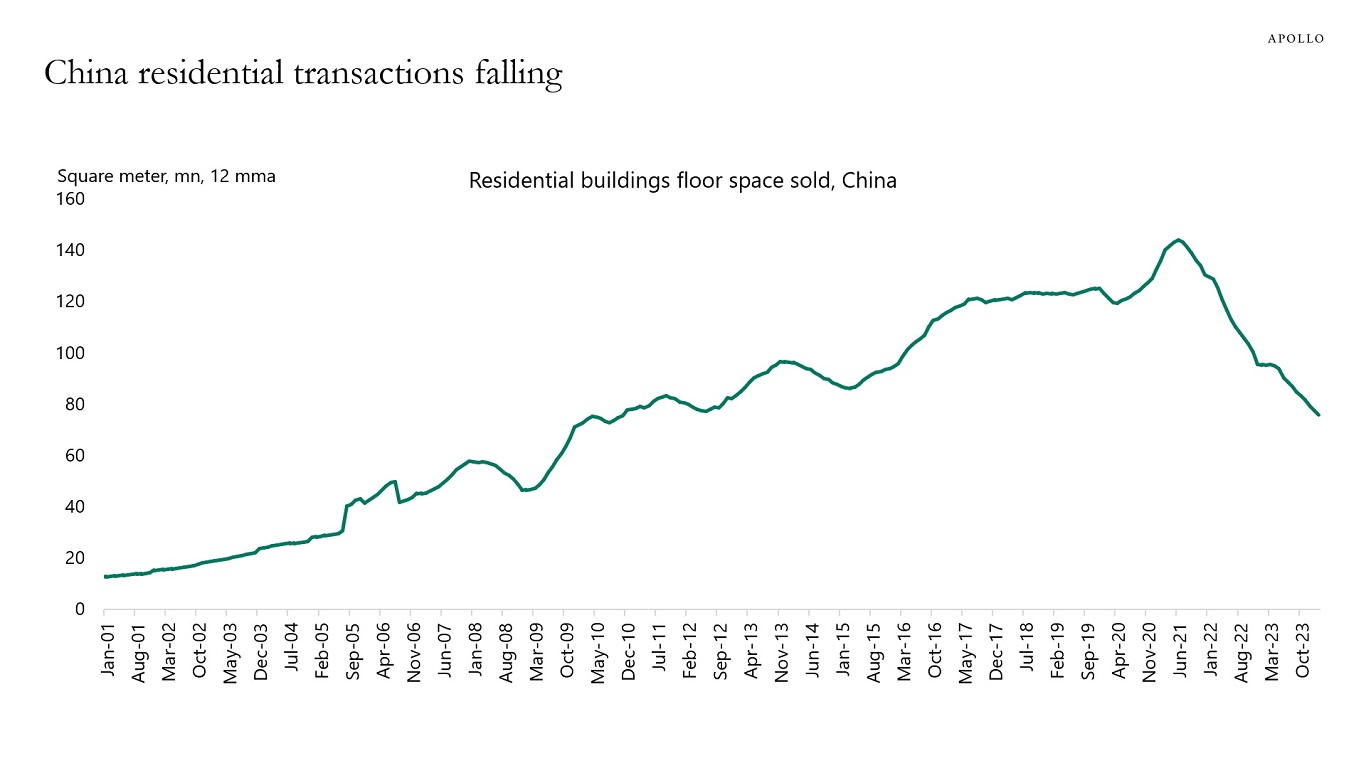
Source: NBS China, Haver Analytics, Apollo Chief Economist See important disclaimers at the bottom of the page.
-
The Marshall Plan was 5% of US GDP, and the US fiscal response to Covid was 20% of US GDP, see chart below.
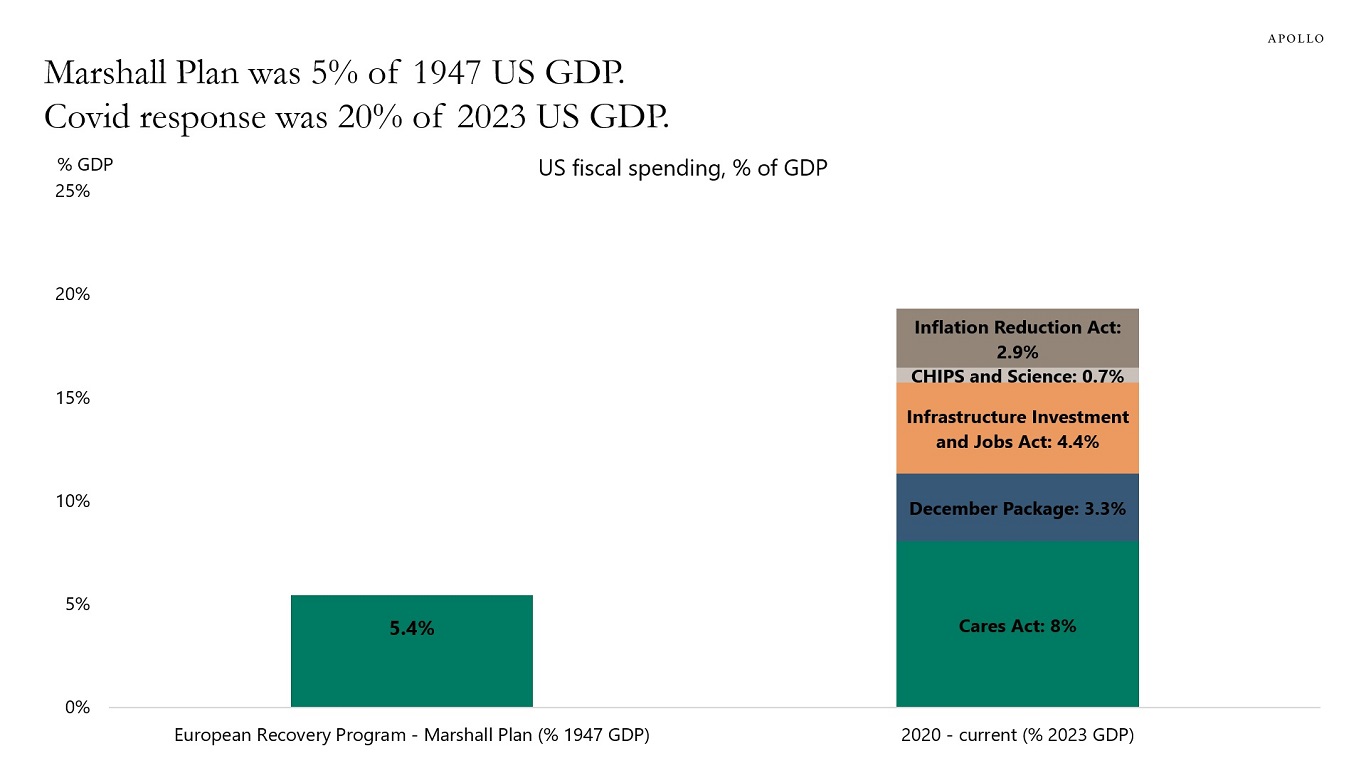
Source: BEA, Haver Analytics, Apollo Chief Economist See important disclaimers at the bottom of the page.
-
Equity analysts continue to increase their earnings expectations for the S&P 500, see chart below.
There are simply no signs of a slowdown in corporate earnings. The economy continues to power ahead fueled by easy financial conditions, and this is an upside risk to inflation over the coming months.
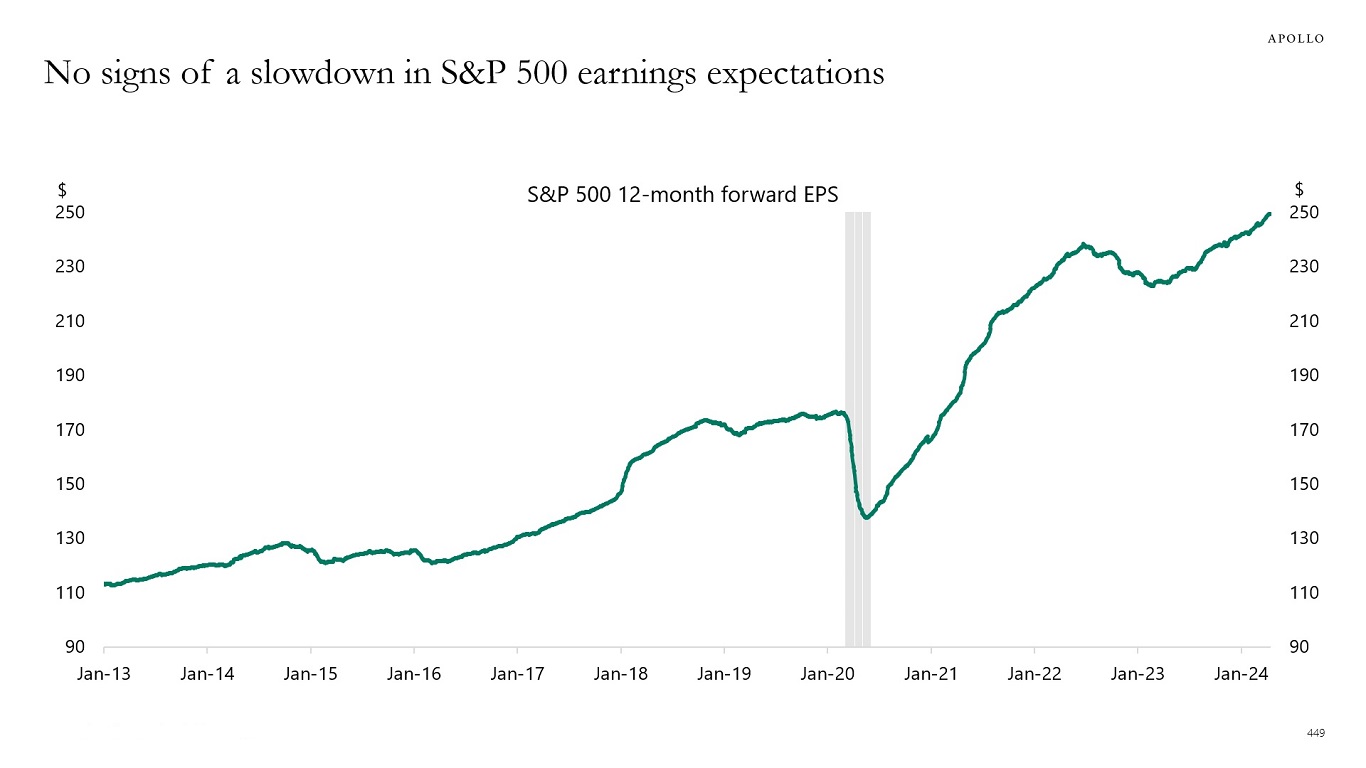
Source: Bloomberg, Apollo Chief Economist See important disclaimers at the bottom of the page.
-
Month-over-month inflation has been rising on average 0.4% for the past three months and 0.3% for the past six months.
If inflation continues to rise at this pace for the rest of the year, then year-over-year core CPI inflation will increase from currently 3.8% to 4% to 4.5%, see chart below.
Even if month-over-month increases in core CPI comes in at the historical average of 0.2% for the rest of the year, then year-over-year inflation will still end the year at 3%.
To get inflation back to the Fed’s 2% inflation target, core CPI for the rest of the year will have to come in at an unprecedented 0.1% month over month.
The bottom line is that base effects and strong recent readings complicate the Fed’s efforts to get inflation back to its 2% inflation target. Put differently, it will require a sharp, immediate slowdown in consumer spending and capex spending for the Fed to be able to cut rates by the end of this year.
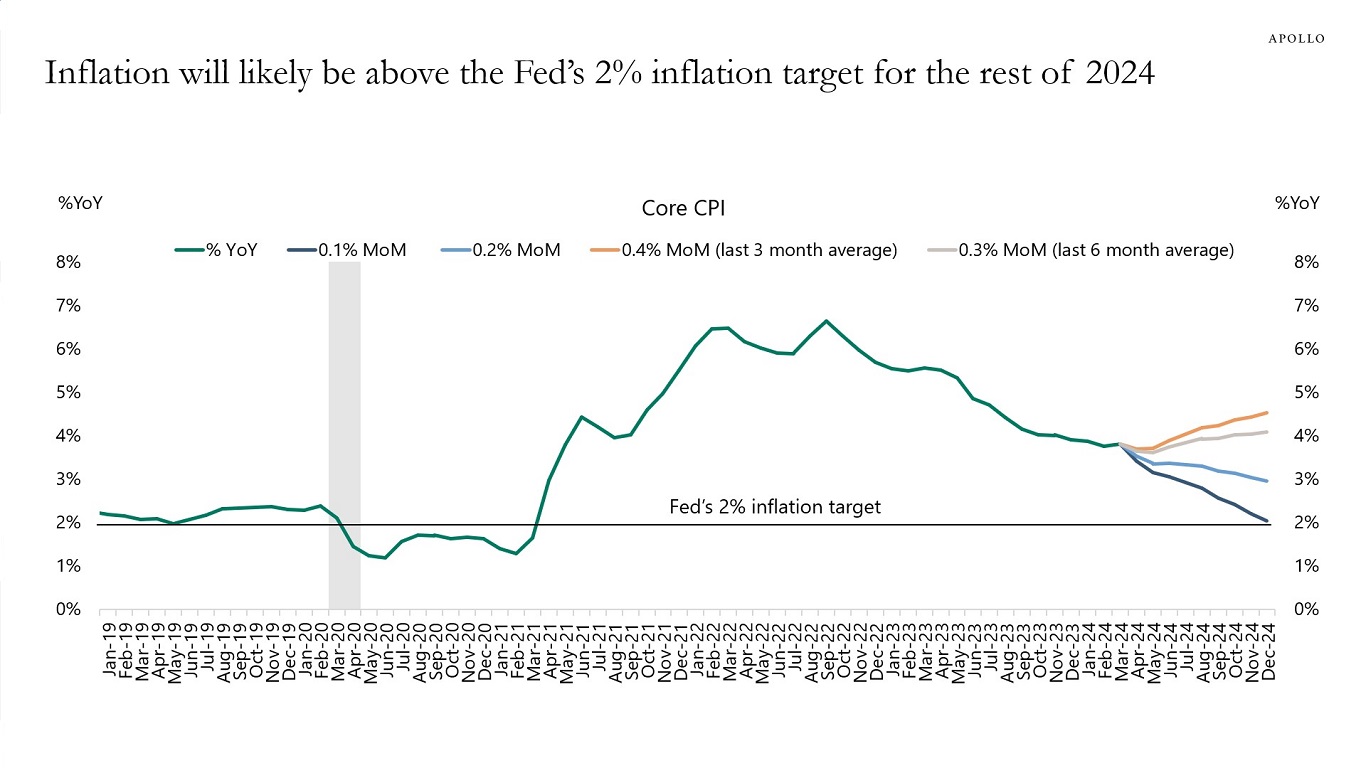
Source: BLS, Haver Analytics, Apollo Chief Economist See important disclaimers at the bottom of the page.
-
In financial markets, a lot of conversations are about public companies, but the reality is that in the US, 87% of firms with revenue greater than $100 million are private, see chart below.
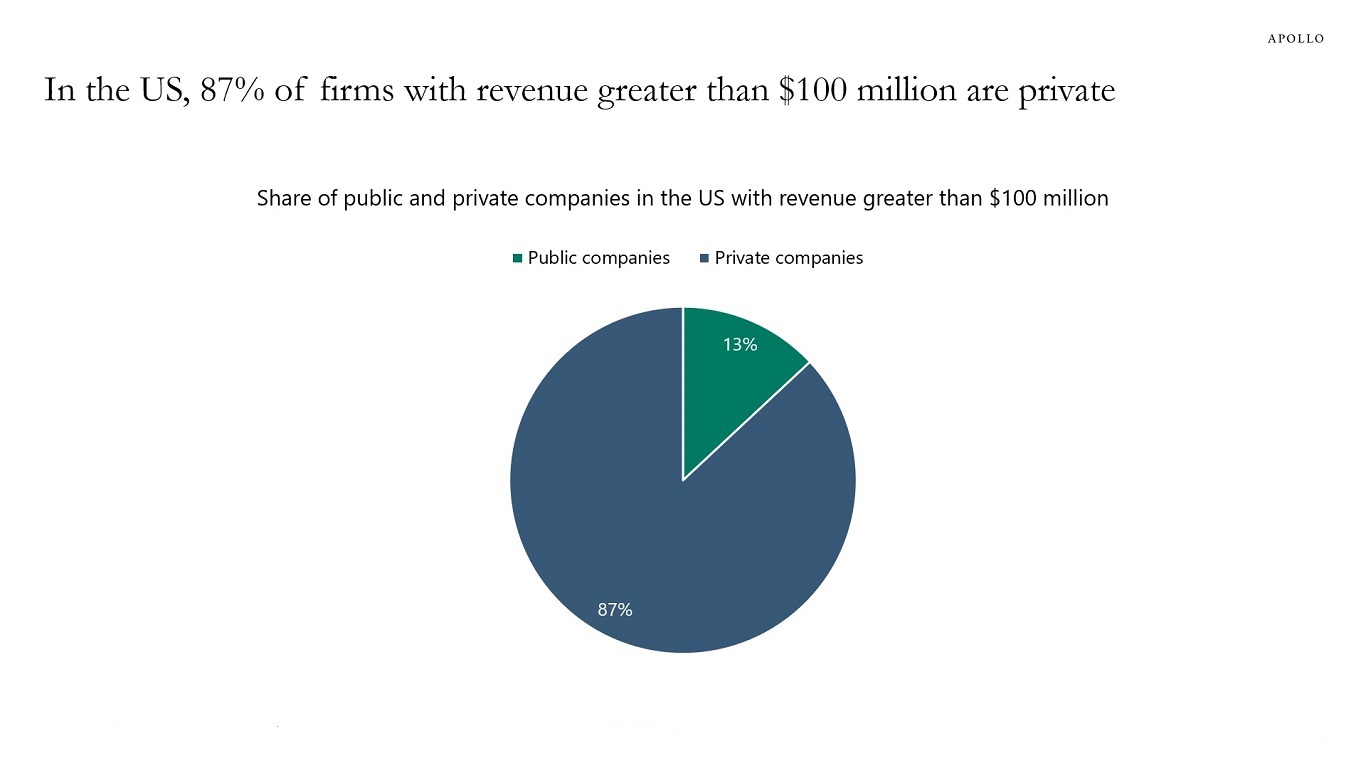
Source: S&P Capital IQ, Apollo Chief Economist. Note: For companies with last 12-month revenue greater then $100 million by count. See important disclaimers at the bottom of the page.
-
It normally takes eight months from the last Fed hike until the central bank starts cutting. But during this cycle, the Fed has kept interest rates constant for ten months since the last hike in July 2023, see chart below. With easy financial conditions still giving a significant boost to inflation and growth over the coming quarters, the risks are rising that we could see a Fed cycle that is very different, with the Fed keeping rates higher for much longer than we usually see.
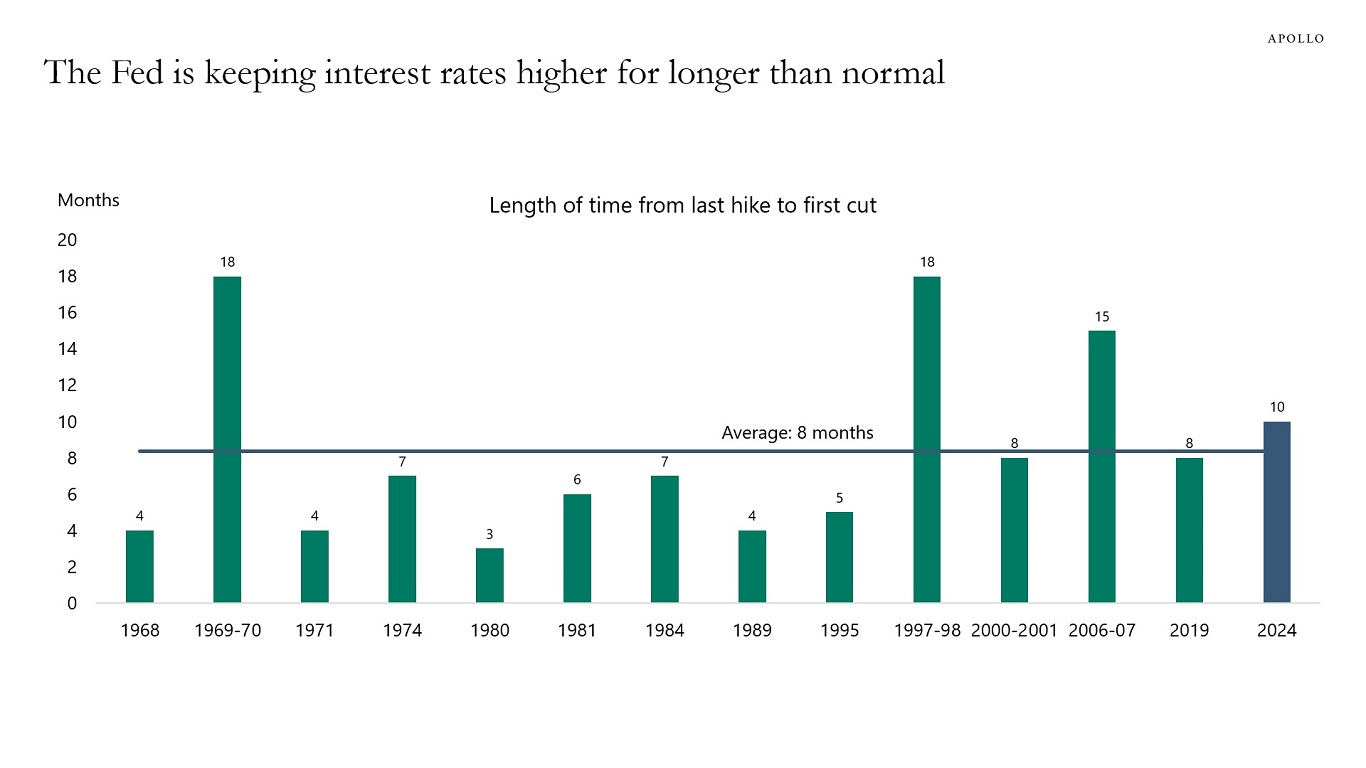
Source: FRB, Haver Analytics, Apollo Chief Economist See important disclaimers at the bottom of the page.
-
Younger households tend to have lower credit scores, and the consequence is that Fed hikes and associated tighter credit conditions tend to have a more negative impact on younger generations, see chart below.
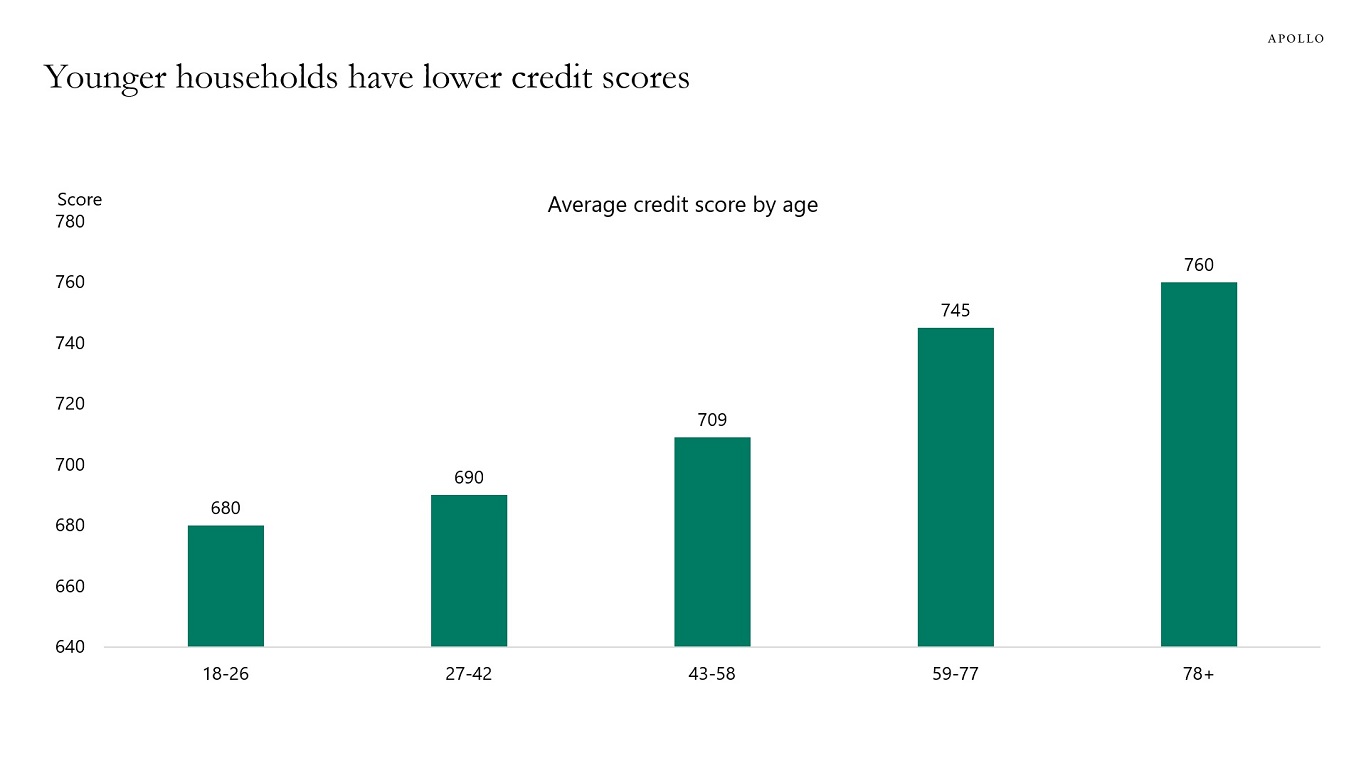
Source: Experian, Apollo Chief Economist. Note: Data for 2023. See important disclaimers at the bottom of the page.
-
The price of gold has been rising in recent months on the back of geopolitical tensions, central banks including China stepping up purchases of gold, and expectations of lower rates triggering a rise in inflation after the December Fed pivot.
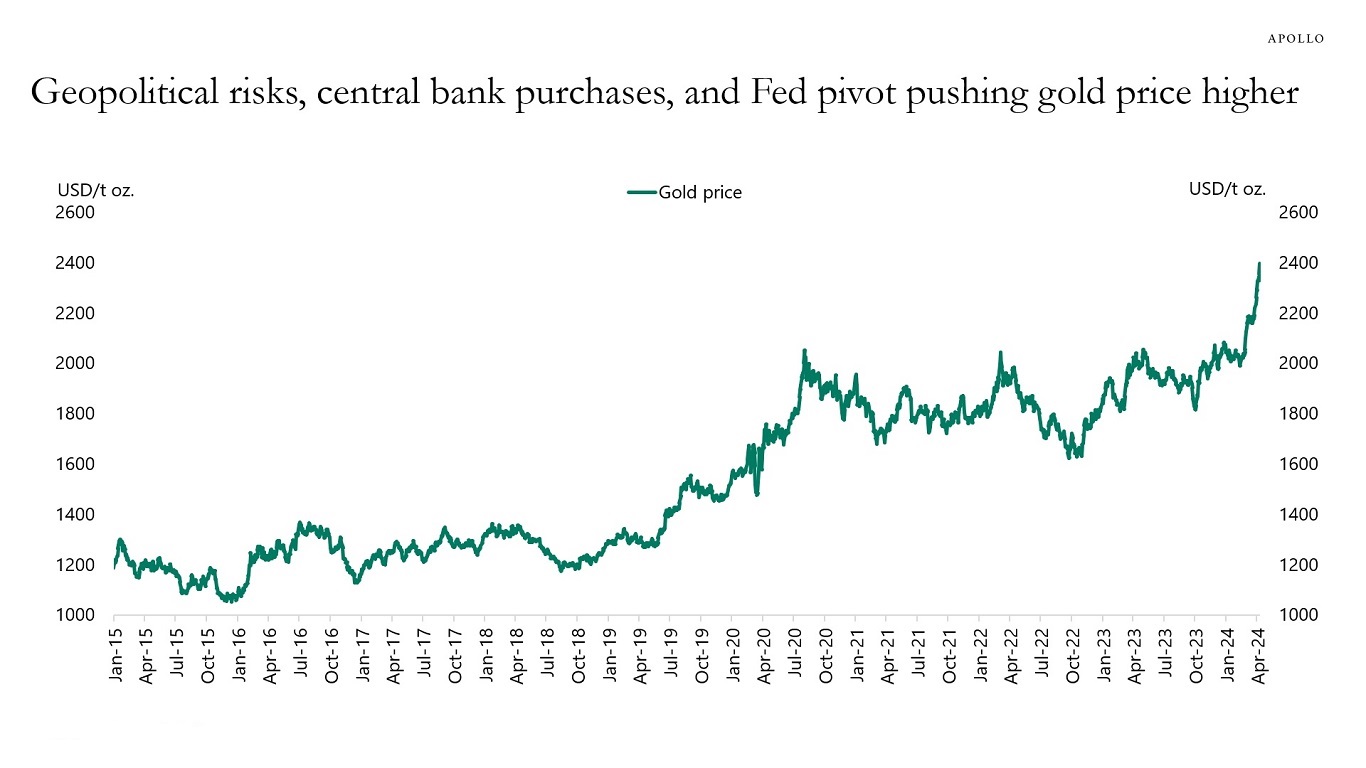
Source: Bloomberg, Apollo Chief Economist See important disclaimers at the bottom of the page.
-
For two years, the Fed was saying, “Interest rates are going higher.”
That message resulted in very little activity in capital markets, with low levels of IPO, M&A, sponsor-to-sponsor deals, or sponsor-to-strategic deals.
This changed at the December 2023 meeting when the Fed said, “Interest rates are now going lower.”
The impact of this signal change from the FOMC was profound. It triggered a significant rally in the S&P 500 and in IG, HY, and loans. As a result, capital markets reopened and LBO financings have rebounded significantly since December, see chart below.
With the Fed still saying that the next move in rates is lower, we should expect the rebound to continue.
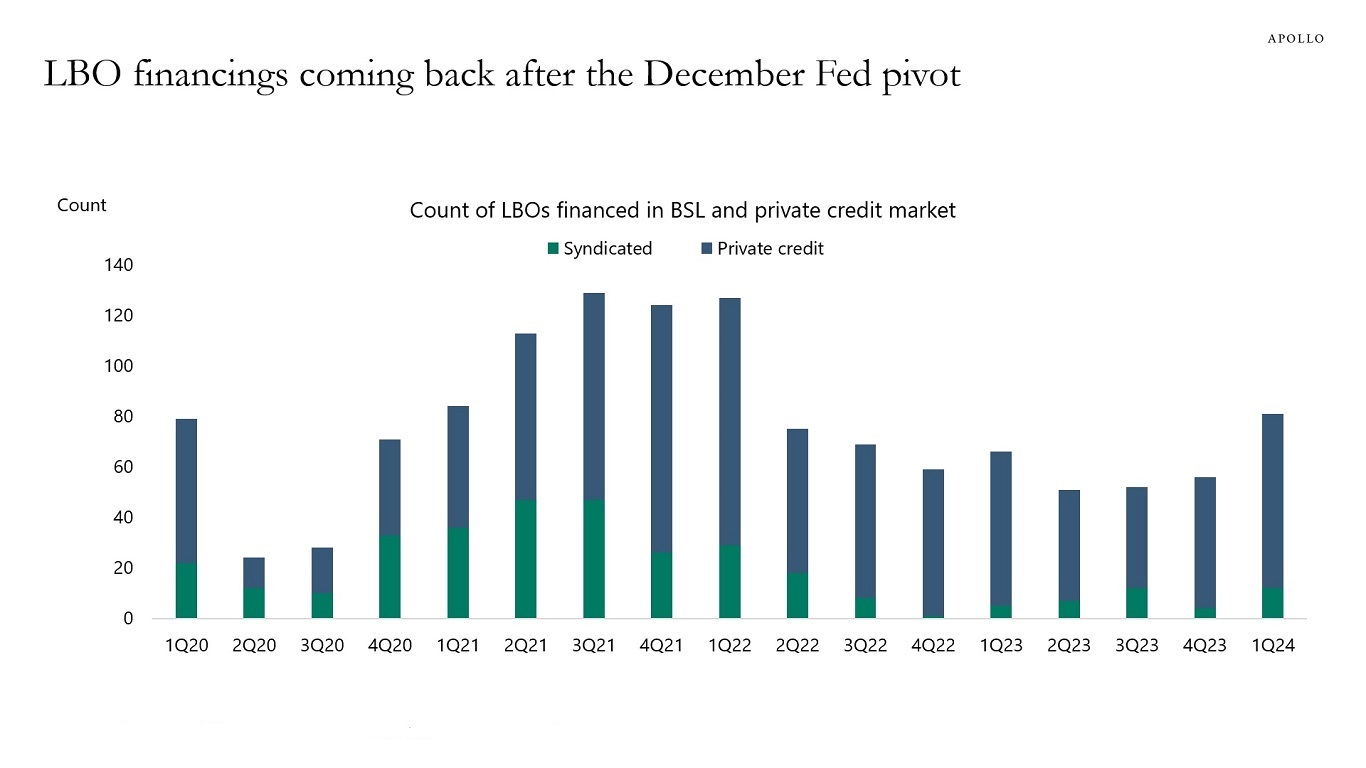
Source: PitchBook LCD, Apollo Chief Economist. Note: Private credit count is based on transactions covered by LCD News. See important disclaimers at the bottom of the page.
-
The US now produces more oil than Saudi Arabia and Russia, see chart below.
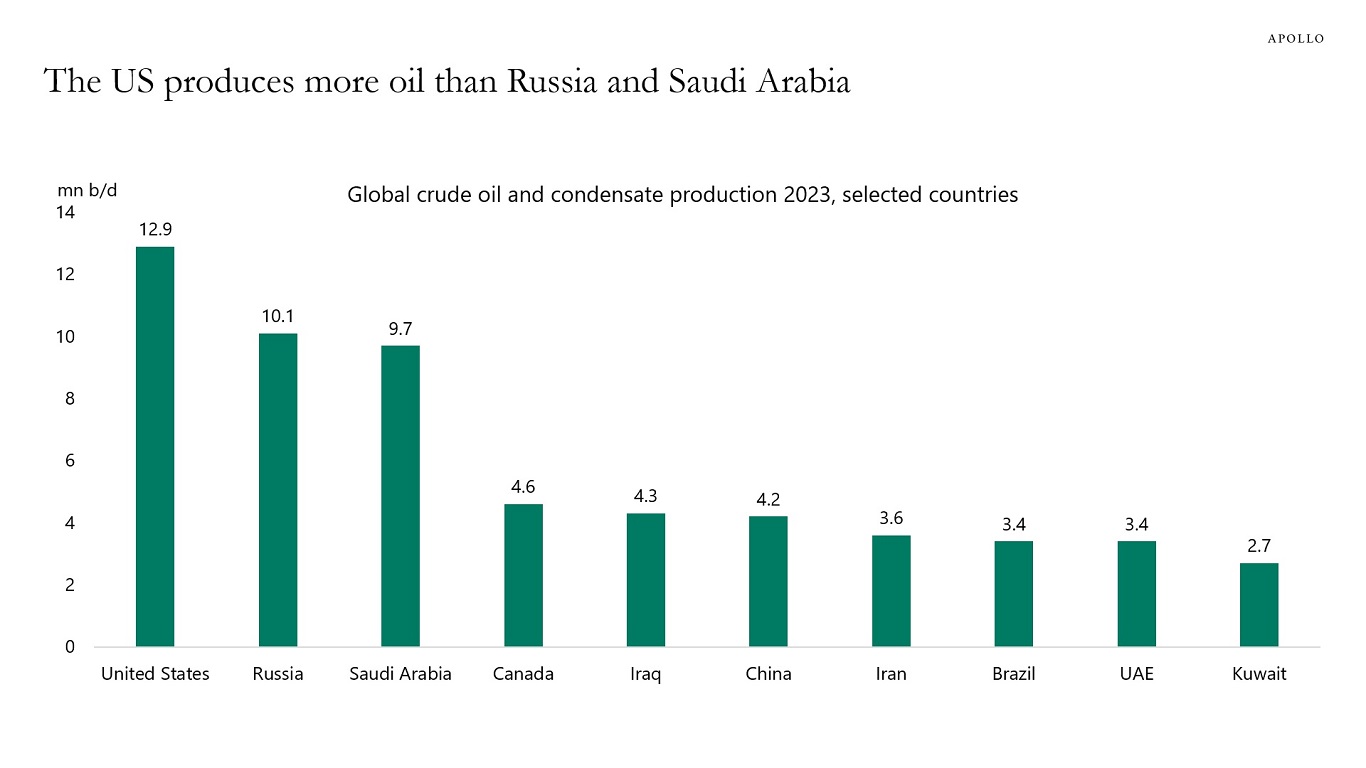
Source: EIA, International Energy Statistics, Apollo Chief Economist. Note: Rest of the world produces 22.8 million barrels per day. See important disclaimers at the bottom of the page.

This presentation may not be distributed, transmitted or otherwise communicated to others in whole or in part without the express consent of Apollo Global Management, Inc. (together with its subsidiaries, “Apollo”).
Apollo makes no representation or warranty, expressed or implied, with respect to the accuracy, reasonableness, or completeness of any of the statements made during this presentation, including, but not limited to, statements obtained from third parties. Opinions, estimates and projections constitute the current judgment of the speaker as of the date indicated. They do not necessarily reflect the views and opinions of Apollo and are subject to change at any time without notice. Apollo does not have any responsibility to update this presentation to account for such changes. There can be no assurance that any trends discussed during this presentation will continue.
Statements made throughout this presentation are not intended to provide, and should not be relied upon for, accounting, legal or tax advice and do not constitute an investment recommendation or investment advice. Investors should make an independent investigation of the information discussed during this presentation, including consulting their tax, legal, accounting or other advisors about such information. Apollo does not act for you and is not responsible for providing you with the protections afforded to its clients. This presentation does not constitute an offer to sell, or the solicitation of an offer to buy, any security, product or service, including interest in any investment product or fund or account managed or advised by Apollo.
Certain statements made throughout this presentation may be “forward-looking” in nature. Due to various risks and uncertainties, actual events or results may differ materially from those reflected or contemplated in such forward-looking information. As such, undue reliance should not be placed on such statements. Forward-looking statements may be identified by the use of terminology including, but not limited to, “may”, “will”, “should”, “expect”, “anticipate”, “target”, “project”, “estimate”, “intend”, “continue” or “believe” or the negatives thereof or other variations thereon or comparable terminology.