


It’s a new year, but much remains the same: Inflation has stayed high, money tight and credit
scarce; capital markets are still volatile; and economic activity is likely to cool down. While
“peak inflation” appears to be behind us amid aggressive Federal Reserve’s rate hiking, it is
still well above the central bank’s 2% annual target and may stay that way for another year or
two. So what does this backdrop mean for the US real estate market, and what opportunities
can investors expect to capitalize on in 2023 as they adjust their portfolios after the declines
endured by asset prices last year?
Although we don’t believe that price volatility is fully behind us yet, we see three specific pockets of opportunities in the real estate market in the new year and beyond: a) providing credit to borrowers at attractive rates and lower leverage ratios, b) focusing on regions and property types/asset classes driven by strong secular tailwinds, and c) finding bargains in the public real-estate market after a dramatic correction in 2022.
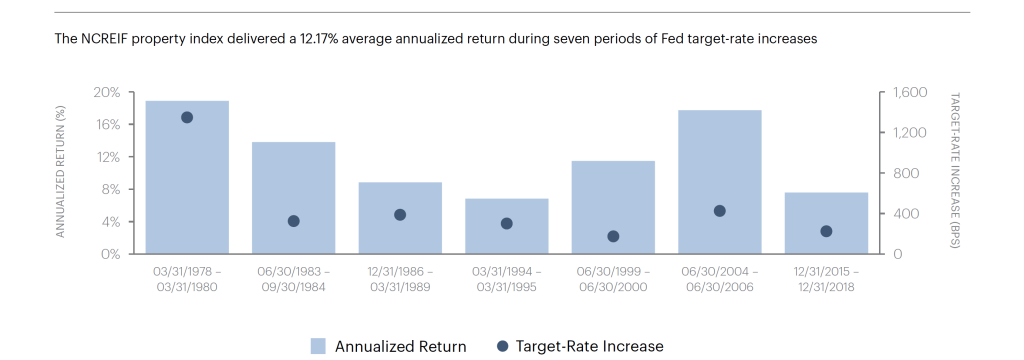
We see these opportunities as complementing each other, especially at a time when investors are increasingly seeking to mitigate the downside potential of their portfolios in times of still-high inflation and tighter credit. In fact, real estate, as an asset class, has historically performed well during periods in which the Federal Reserve is raising interest rates (Exhibit 1).
Exhibit 1: Real estate has historically performed well during periods of Fed funds target-rate increases
Providing capital to private market borrowers
As public markets staged a drastic reaction to an environment of scarcer money and dearer cost of capital (more on that later), many real estate borrowers are finding it hard to secure development finance and refinancing funding in the current restrictive environment.
Our analysis, for example, indicates that, as of late 2022, around 25% of total commercial mortgage-backed securities (CMBS) in the US—or about $165 billion—are currently on a watchlist or need special servicing, predominantly in the retail, lodging, and office sectors. Research analysts1 predict that conduit CMBS refi success rates—historically between 80% and 90% over the last cycle—could decline to 60% in 2023 on average.
In this context, we see an interesting investment window today on select credit opportunities, especially for longterm investors who can withstand some expected lingering real-estate equity price volatility in the short term. Those investors willing and able to provide capital in the current stressed market can now find opportunities to generate attractive, high-single-digit yield on an unleveraged basis, on deals with loan-to-value (LTV) ratios between 60% and 65%.
Real-estate opportunities with strong secular tailwinds
We believe 2023 will be a much more selective market for US real estate. Property sectors that investors are targeting should have secular trends and demand drivers that can act as long-term tailwinds. These include fundamental changes driven by demographics, socio-economic trends, shifting consumer behavior, or technological innovation. One particular area of focus is multifamily, a sector backed by demographic trends such as young adults delaying household formation and baby boomers downsizing. The sector also benefits from low housing supplies. But the major driver for multifamily is affordability, as home prices have surged in recent years.
Median sales price of homes sold in the US was $454,900 in the third quarter of 2022, up 35% from just two years ago and 83% higher from 10 years ago.2 Compared with a median household income of $70,784,3 this far exceeds the general guideline that a home should cost no more than two-and-half
times annual income. Additionally, mortgage rates have essentially doubled from a year ago to an average of 6.48% as of early January 2023,4 making housing—already the largest
monthly expense for consumers—an even greater burden. Against this backdrop, renting becomes not just a viable option but one of the most attractive for many families.
Investors can also look for sectors that have less obvious demand drivers or those less impacted by economic downturns such as manufactured housing. Demand for manufactured homes is counter-cyclical and tends to rise during economic hardships as they are effectively the most affordable form of housing. Manufactured homes cost about half of a site-built home, and their monthly lot rent could be as low as a few hundred dollars.
Industrial is another sector backed by secular trends. The growth of e-commerce, which has caused supply chains to evolve, is driving robust demand for warehouses and distribution centers. Companies are investing in modern, well-located logistics facilities to streamline their supply chains to save not only time but money. According to CBRE Supply Chain Advisory, transportation accounts for 40% to 70% of a company’s total logistics spending compared with just 3% to 6% for a fixed facility, including rent.
Investors can also look at adjacencies within property sectors for opportunities. A niche within the industrial space that is seeing strong interest is cold storage or refrigerated warehouses. Demand for this type of storage is sparked by non-cyclical drivers, including both food manufacturing and transportation as well as online grocery sales, which are a small but growing part of total grocery sales.
Additionally, in the hospitality sector, hotels have rebounded from the depths of Covid and have continued to do well, especially leisure and drive-to hotels. Metrics such as occupancy and average daily rates remain near recent highs. While hotels are not having a problem with demand, we believe they may have a capital structure issue and will need capital. We see potential opportunities in providing gap financing, structured equity, or structured credit to hotels with strong operations but poor capital structures.
Public REITs are on sale
As the Fed hiked interest rates from essentially zero to 4.5% in 2022, financing costs in commercial real estate have also increased sharply. Rates for 7- to 10-year loans rose to 5.9% in October 2022, up from about 3.7% a year ago according to MSCI Real Capital Analytics. The jump in borrowing costs affects the commercial real-estate market in a few ways. First, it slows down transaction activity. CBRE Research noted that US commercial real-estate investment volume dropped 24% in Q3 of 2022 from a year ago. Second, higher financing cost puts pressure on prices. Lastly, the steep increase in rates has caused a bifurcation of values in public and private markets. Private real estate rose 9.4% through the third quarter of 2022.5 But public market REITs slumped 24.4% in 2022 — their biggest annual loss since 2008.6
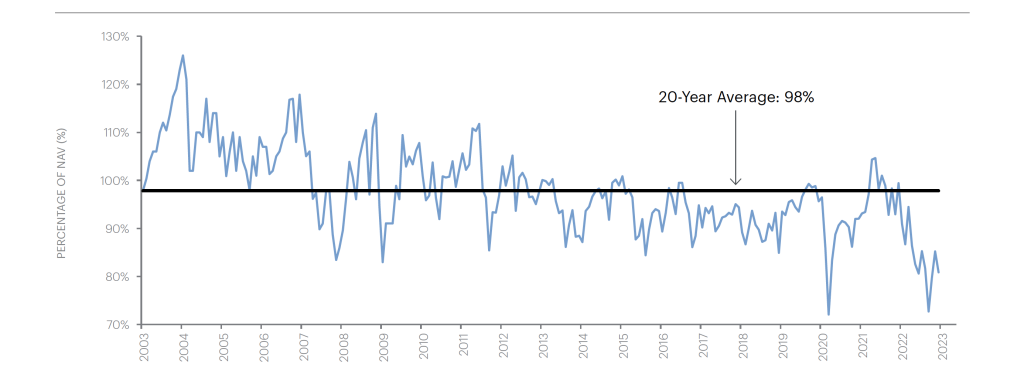
Unlike private real estate, which tends to be only periodically valued, public REITs are traded each market day, so their prices can react much more quickly to news and investor sentiment. But because of their trading, which reflects human emotions, public REIT prices can sometimes widely deviate from the value of their underlying real estate portfolio, as they recently have (Exhibit 2). Purchase price matters is one of our most important investment tenets. The acquiring price matters tremendously in determining an investment’s outcome. With public REITs still on sale from a year ago, we see an interesting opportunity for investors willing to deploy capital in the short term.
All in all, we believe that 2023 holds some attractive opportunities for investors seeking to invest in the real-estate market. Investors able to act as lenders in times of stress can find historically high yields on an unleveraged basis, while those seeking to deploy capital into equity will likely benefit from sectors with strong secular underpinnings as well as attractive valuations in the public space.
Exhibit 2: REITs have traded at a sharp discount to their net-asset values
1 Source: Based on research analysis from J.P. Morgan and Trepp.
2 Source: Federal Reserve Economic Data.
3 Source: US Census Bureau. Figure represents the median household income in 2021.
4 Source: Freddie Mac.
5 Source: Private real estate is represented by the NCREIF Property Index. Source: Apollo Analysts. Data as of September 30, 2022.
6 Source: Public market REITs are represented by the FTSE Nareit Equity REITs Index. Source: Nareit. Data as of December 31, 2022.
The information herein is provided for educational purposes only and should not be construed as financial or investment advice, nor should any information in this document be relied on when making an investment decision. Opinions and views expressed reflect the current opinions and views of the authors and Apollo Analysts as of the date hereof and are subject to change. Please see the end of this document for important disclosure information.
Important Disclosure Information
This presentation is for educational purposes only and should not be treated as research. This presentation may not be distributed, transmitted or otherwise communicated to others, in whole or in part, without the express written consent of Apollo Global Management, Inc. (together with its subsidiaries, “Apollo”).
The views and opinions expressed in this presentation are the views and opinions of the author(s) of the content. They do not necessarily reflect the views and opinions of Apollo and are subject to change at any time without notice. Further, Apollo and its affiliates may have positions (long or short) or engage in securities transactions that are not consistent with the information and views expressed in this presentation. There can be no assurance that an investment strategy will be successful. Historic market trends are not reliable indicators of actual future market behavior or future performance of any particular investment which may differ materially, and should not be relied upon as such. Target allocations contained herein are subject to change. There is no assurance that the target allocations will be achieved, and actual allocations may be significantly different than that shown here. This presentation does not constitute an offer of any service or product of Apollo. It is not an invitation by or on behalf of Apollo to any person to buy or sell any security or to adopt any investment strategy, and shall not form the basis of, nor may it accompany nor form part of, any right or contract to buy or sell any security or to adopt any investment strategy. Nothing herein should be taken as investment advice or a recommendation to enter into any transaction.
Hyperlinks to third-party websites in this presentation are provided for reader convenience only. There can be no assurance that any trends discussed herein will continue. Unless otherwise noted, information included herein is presented as of the dates indicated. This presentation is not complete and the information contained herein may change at any time without notice. Apollo does not have any responsibility to update the presentation to account for such changes. Apollo has not made any representation or warranty, expressed or implied, with respect to fairness, correctness, accuracy, reasonableness, or completeness of any of the information contained herein, and expressly disclaims any responsibility or liability therefore. The information contained herein is not intended to provide, and should not be relied upon for, accounting, legal or tax advice or investment recommendations. Investors should make an independent investigation of the information contained herein, including consulting their tax, legal, accounting or other advisors about such information. Apollo does not act for you and is not responsible for providing you with the protections afforded to its clients.
Certain information contained herein may be “forward-looking” in nature. Due to various risks and uncertainties, actual events or results may differ materially from those reflected or contemplated in such forward-looking information. As such, undue reliance should not be placed on such information. Forward-looking statements may be identified by the use of terminology including, but not limited to, “may”, “will”, “should”, “expect”, “anticipate”, “target”, “project”, “estimate”, “intend”, “continue” or “believe” or the negatives thereof or other variations thereon or comparable terminology.
The Standard & Poor’s 500 (“S&P 500”) Index is a market-capitalization-weighted index of the 500 largest U.S. publicly traded companies by market value.
Additional information may be available upon request.