• Apollo.com
  • Login
  • Register Now
light site-logo
  • The Academy
  • Upcoming Events
        • Upcoming Events

        • Hybrid Investments: Flexible Structures for Volatile TimesThursday, May 29, 2025 • 11:00AM ET
  • Learning Center
        • New & UpdatedAlternative Investing Course 2.0

        • Alternative Investing Essentials Part OnePrivate Equity, Venture Capital, Private Credit
        • Alternative Investing Essentials Part TwoReal Estate, Infrastructure, Digital Assets, Hedge Funds
        • Practical ConsiderationsAsset Allocation, Risk Considerations, Fund Structures, Fees
        • Introductory Videos

          View All Videos

        •  Recent Classes & Videos

        • • Private Credit Investing in Volatile Times
        • • Potential Implications of the Latest US Administration Policy Proposals
        • • Beyond 60/40: Private Assets in an Era of High Public Valuations
        • • Investment Grade Private Credit as a Core Fixed Income Allocation
        • • 2025 Economic Outlook: Firing on All Cylinders
        • • Building the Future: Understanding the Tailwinds Behind Infrastructure Investing
        • View All Classes

  • Alternative Perspectives
        • Investment Knowledge
        • The View from Apollo
          • Investment Knowledge White Papers

            Beyond 60/40: Private Assets in an Era of High Public Valuations

            March 21, 2025
          • The View From Apollo

            Private Credit Investing in Volatile Times

            May 9, 2025
          • Investment Knowledge

            Apollo Answers: What Is PIK?

            March 19, 2025
  • The Daily Spark
        • Read The Daily Spark Blog


        • Want it delivered daily to your inbox?
          • The Daily Spark

            More Than Half of Expenditures on Imports From China Stays in the US

            May 15, 2025
          • The Daily Spark

            A 10% Trade War Premium for the Dollar

            May 14, 2025
          • The Daily Spark

            It Takes Time to Rebuild Trust

            May 13, 2025
  • Register for Apollo Academy: Alternative Investing Course
  • Login
  • About Apollo Academy
  • Upcoming Events
  • Learning Center
  • Alternative Perspectives
  • The Daily Spark
  • Register for Apollo Academy: Alternative Investing Course
  • Login
  • Private Credit Investing in Volatile Times
    Tuesday, April 29, 2025 • 11:00am ET
  • Alternative Investing Course 2.0
  • Potential Implications of the Latest US Administration Policy Proposals
  • Beyond 60/40: Private Assets in an Era of Soaring Public Valuations
  • Investment Grade Private Credit as a Core Fixed Income Allocation
  • 2025 Economic Outlook: Where’s the Slowdown?
  • Building the Future: Understanding the Tailwinds Behind Infrastructure Investing
  • Clean Transition Investing: Going Where the Opportunities Are
  • View All Classes
  • Introductory Videos
  • Alternative Investing Essentials Part One • Now Available On Demand
  • Alternative Investing Essentials Part Two • Now Available On Demand
  • Practical Considerations • Now Available On Demand
  • Investment Knowledge
  • The View from Apollo
Home April 2022

US Housing Outlook: Soft Landing Most Likely

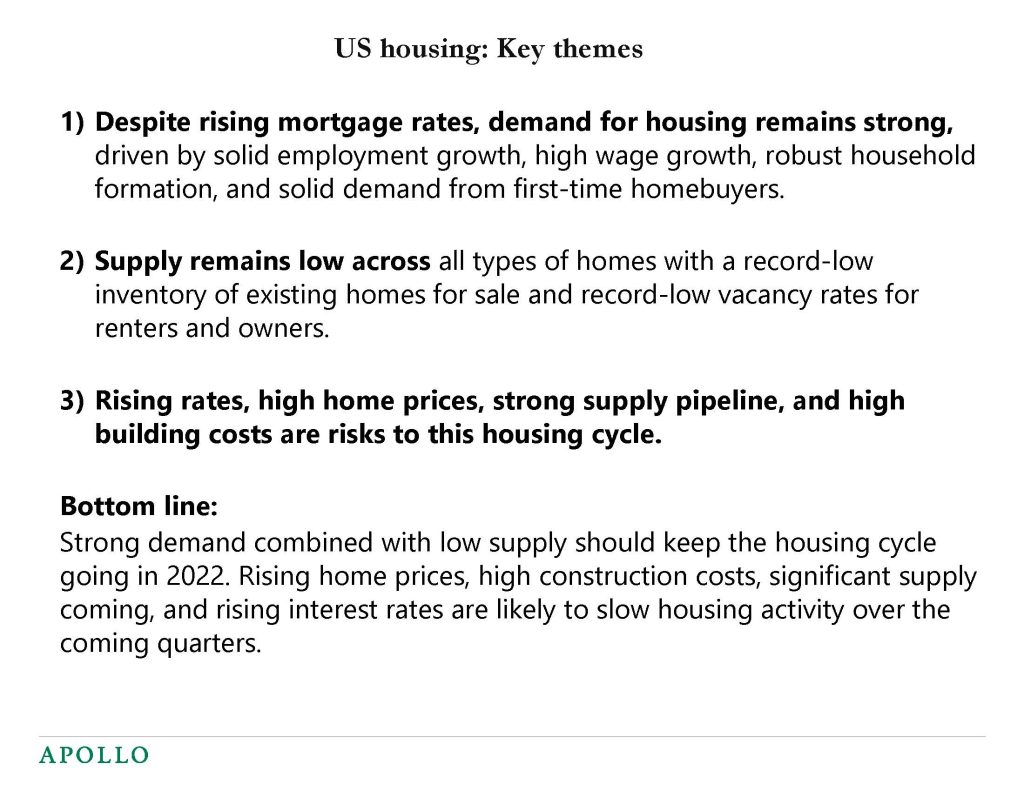
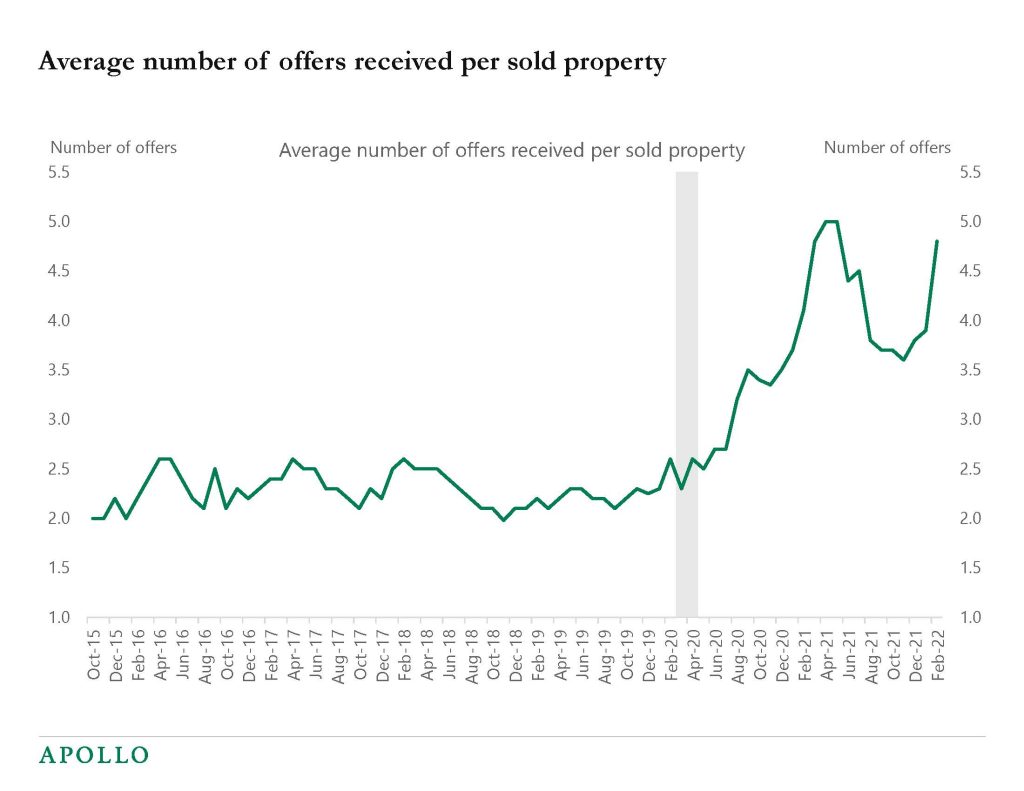
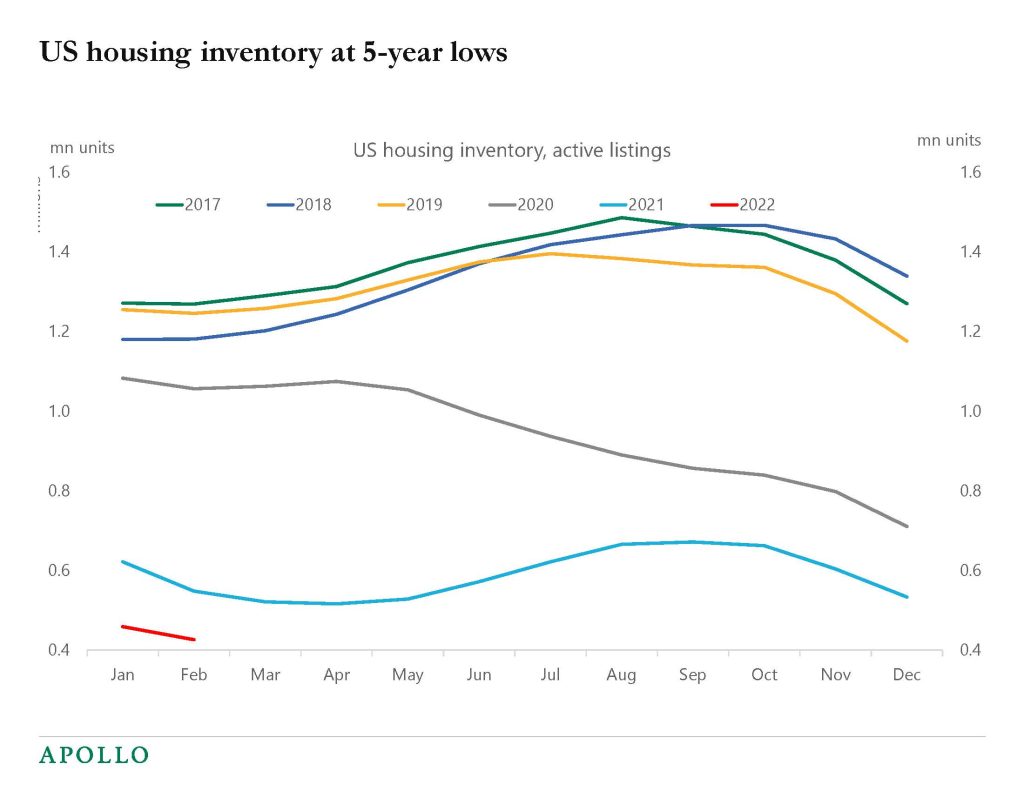
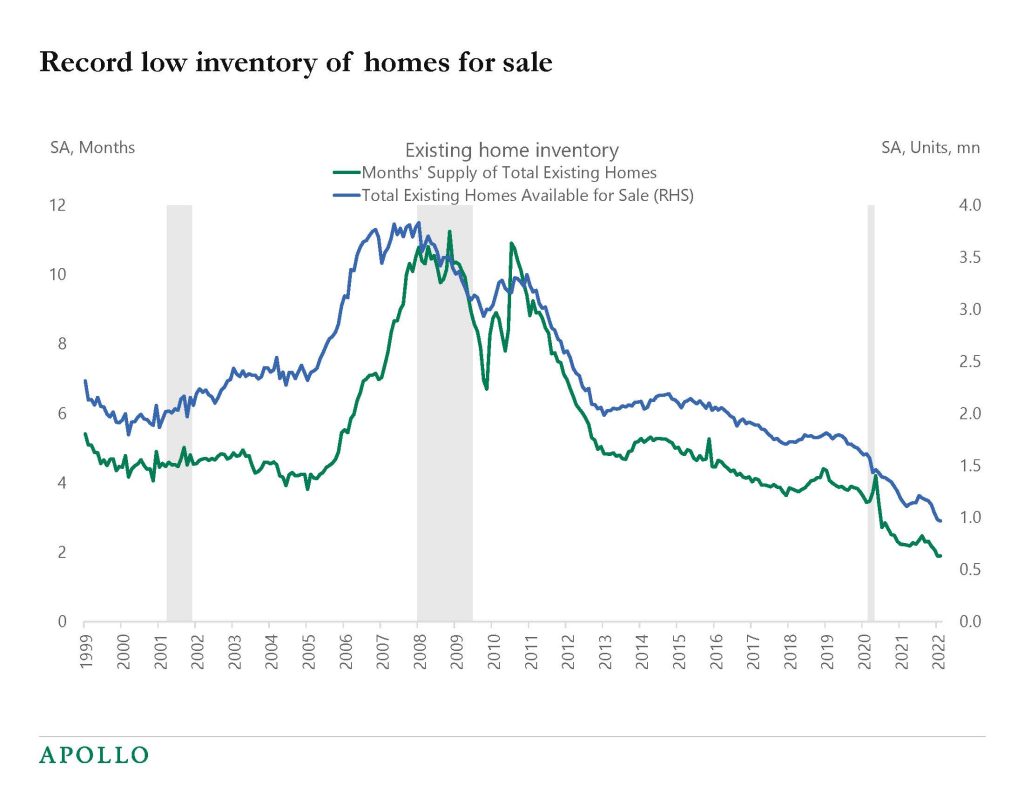
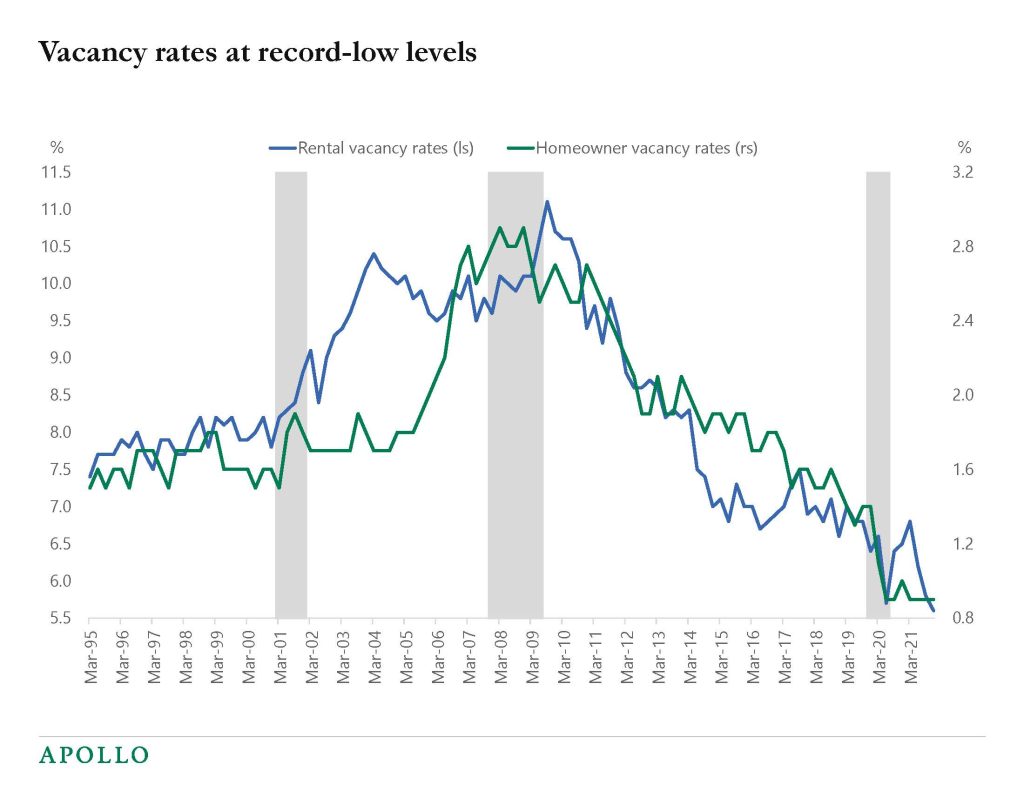
Our latest US housing outlook is available here, and the bottom line is that despite rising mortgage rates, demand for housing remains strong. Combined with record-low supply the housing market is expected to continue to do well over the coming quarters. A soft landing remains the most likely scenario.

Chart showing a rebound in the average number of offers received per proprty sold
Source: NAR, Apollo Chief Economist
Chart showing US housing inventories stand at a five-year low
Source: Realtor.com, Apollo Chief Economist
Chart showing a record low number of homes for sale
Source: NAR, Apollo Chief Economist
Chart showing all-time low vacancy rates in the housing market
Source: Bloomberg, Apollo Chief Economist

Recent Posts

  • More Than Half of Expenditures on Imports From China Stays in the US
  • A 10% Trade War Premium for the Dollar
  • It Takes Time to Rebuild Trust
  • Banks’ Unrealized Losses Increase Again
  • Lower Inventory-to-Sales Ratio for Retailers Today than in 2019

Recent Comments

No comments to show.

Archives

  • May 2025
  • April 2025
  • March 2025
  • February 2025
  • January 2025
  • December 2024
  • November 2024
  • October 2024
  • September 2024
  • August 2024
  • July 2024
  • June 2024
  • May 2024
  • April 2024
  • March 2024
  • February 2024
  • January 2024
  • December 2023
  • November 2023
  • October 2023
  • September 2023
  • August 2023
  • July 2023
  • June 2023
  • May 2023
  • April 2023
  • March 2023
  • February 2023
  • January 2023
  • December 2022
  • November 2022
  • October 2022
  • September 2022
  • August 2022
  • July 2022
  • June 2022
  • May 2022
  • April 2022
  • March 2022
  • February 2022
  • January 2022
  • December 2021
  • November 2021

Categories

  • Apollo Answers
  • Course Introductions
  • Economic Intelligence
  • Hide from Wordpress Search
  • Investment Knowledge
  • Perspectives
  • Redirecting
  • The Daily Spark
  • The View from Apollo
  • The Weekly Brief
  • Uncategorized
  • White Papers

No Sign Yet of the Economy Slowing Down

The Fed is raising rates to cool down inflation, but daily indicators for consumer spending, airline travel, hotel reservations, and restaurant bookings show no signs of the economy slowing down, see charts below.

Combined with the strong March employment report, the conclusion is that despite higher rates and heightened geopolitical uncertainty, the incoming data is still strong and the Fed will continue to be hawkish until the economy starts to show signs of slowing down.

Chart showing a spike in tax refunds compared to prior years, pointing to a strong consumer
Source: IRS, Apollo Chief Economist
Chart showing various hotel performance metrics all showing strength
Source: STR, Haver Analytics, Apollo Chief Economist
Chart showing restaurant books remains strong
Source: OpenTable, Bloomberg, Apollo Chief Economist
Chart showing air travel is back near 2019 levels
Source: TSA, Bloomberg, Apollo Chief Economist
Chart showing credit card spending on goods such as furniture, electronics, building materials, and restaurants remain strong
Source: BEA, Haver analytics, Apollo Chief Economist. Note: The weekly values represent the predicted percentage difference from the typical level of spending (prior to the pandemic declared by the World Health Organization on March 11, 2020) after adjusting for day-of-week, month, and year effects, based on daily data. The typical level corresponds to a value of zero.
Chart showing credit card spending on goods such as pet supplies, clothing, auto parts, and gas remain strong
Source: BEA, Haver analytics, Apollo Chief Economist. Note: The weekly values represent the predicted percentage difference from the typical level of spending (prior to the pandemic declared by the World Health Organization on March 11, 2020) after adjusting for day-of-week, month, and year effects, based on daily data. The typical level corresponds to a value of zero.
Chart showing spending on goods such as sporting equipment, books, general merchandise, and health care remain robust
Source: BEA, Haver analytics, Apollo Chief Economist. Note: The weekly values represent the predicted percentage difference from the typical level of spending (prior to the pandemic declared by the World Health Organization on March 11, 2020) after adjusting for day-of-week, month, and year effects, based on daily data. The typical level corresponds to a value of zero.

Recent Posts

  • More Than Half of Expenditures on Imports From China Stays in the US
  • A 10% Trade War Premium for the Dollar
  • It Takes Time to Rebuild Trust
  • Banks’ Unrealized Losses Increase Again
  • Lower Inventory-to-Sales Ratio for Retailers Today than in 2019

Recent Comments

No comments to show.

Archives

  • May 2025
  • April 2025
  • March 2025
  • February 2025
  • January 2025
  • December 2024
  • November 2024
  • October 2024
  • September 2024
  • August 2024
  • July 2024
  • June 2024
  • May 2024
  • April 2024
  • March 2024
  • February 2024
  • January 2024
  • December 2023
  • November 2023
  • October 2023
  • September 2023
  • August 2023
  • July 2023
  • June 2023
  • May 2023
  • April 2023
  • March 2023
  • February 2023
  • January 2023
  • December 2022
  • November 2022
  • October 2022
  • September 2022
  • August 2022
  • July 2022
  • June 2022
  • May 2022
  • April 2022
  • March 2022
  • February 2022
  • January 2022
  • December 2021
  • November 2021

Categories

  • Apollo Answers
  • Course Introductions
  • Economic Intelligence
  • Hide from Wordpress Search
  • Investment Knowledge
  • Perspectives
  • Redirecting
  • The Daily Spark
  • The View from Apollo
  • The Weekly Brief
  • Uncategorized
  • White Papers

Outlook for Credit

Our latest credit market outlook is available here. Turbulence is likely to continue driven by inflation uncertainty, rising rates, and emerging fears of a hard landing.

Chart showing a record pullback in investment grade bonds
Source: Bloomberg, Apollo Chief Economist. Note: Index used LEGATRUU Index.
Source: Apollo Chief Economist
Chart showing a low level of corporate bonds from dealers
Source: Bloomberg, Apollo Chief Economist
Chart showing the number of negative yield corporate bonds is falling
Source: Bloomberg, Apollo Chief Economist
Chart showing a sharp rebound in the duration of high yield bonds
Source: Bloomberg, Apollo Chief Economist. Note: The measure used is modified duration, which measures the expected change in a bond’s price to a 1% change in interest rates.
Chart showing that rising interest rates is weighing on new issuance of high yield bonds
Source: S&P LCD, Apollo Chief Economist. Note: Data as of 31st March 2022.
Chart showing record low leverage in corporate America
Source: FRB, Haver Analytics, Apollo Chief Economist
Chart showing various holders of corporate debt
Source: FRB, Haver Analytics, Apollo Chief Economist

Recent Posts

  • More Than Half of Expenditures on Imports From China Stays in the US
  • A 10% Trade War Premium for the Dollar
  • It Takes Time to Rebuild Trust
  • Banks’ Unrealized Losses Increase Again
  • Lower Inventory-to-Sales Ratio for Retailers Today than in 2019

Recent Comments

No comments to show.

Archives

  • May 2025
  • April 2025
  • March 2025
  • February 2025
  • January 2025
  • December 2024
  • November 2024
  • October 2024
  • September 2024
  • August 2024
  • July 2024
  • June 2024
  • May 2024
  • April 2024
  • March 2024
  • February 2024
  • January 2024
  • December 2023
  • November 2023
  • October 2023
  • September 2023
  • August 2023
  • July 2023
  • June 2023
  • May 2023
  • April 2023
  • March 2023
  • February 2023
  • January 2023
  • December 2022
  • November 2022
  • October 2022
  • September 2022
  • August 2022
  • July 2022
  • June 2022
  • May 2022
  • April 2022
  • March 2022
  • February 2022
  • January 2022
  • December 2021
  • November 2021

Categories

  • Apollo Answers
  • Course Introductions
  • Economic Intelligence
  • Hide from Wordpress Search
  • Investment Knowledge
  • Perspectives
  • Redirecting
  • The Daily Spark
  • The View from Apollo
  • The Weekly Brief
  • Uncategorized
  • White Papers

When Will Rates Peak?

The market is currently pricing that the Fed funds rate will peak at 3.25% in mid-2023. On average, the Fed began cutting rates six months after the Fed funds rate peaks. And 10s typically peak around the time of the last Fed hike see chart below.

Chart showing when the Fed funds rate and the 10-year Treasury typically peak
Source: FRB, Bloomberg, Apollo Chief Economist

Recent Posts

  • More Than Half of Expenditures on Imports From China Stays in the US
  • A 10% Trade War Premium for the Dollar
  • It Takes Time to Rebuild Trust
  • Banks’ Unrealized Losses Increase Again
  • Lower Inventory-to-Sales Ratio for Retailers Today than in 2019

Recent Comments

No comments to show.

Archives

  • May 2025
  • April 2025
  • March 2025
  • February 2025
  • January 2025
  • December 2024
  • November 2024
  • October 2024
  • September 2024
  • August 2024
  • July 2024
  • June 2024
  • May 2024
  • April 2024
  • March 2024
  • February 2024
  • January 2024
  • December 2023
  • November 2023
  • October 2023
  • September 2023
  • August 2023
  • July 2023
  • June 2023
  • May 2023
  • April 2023
  • March 2023
  • February 2023
  • January 2023
  • December 2022
  • November 2022
  • October 2022
  • September 2022
  • August 2022
  • July 2022
  • June 2022
  • May 2022
  • April 2022
  • March 2022
  • February 2022
  • January 2022
  • December 2021
  • November 2021

Categories

  • Apollo Answers
  • Course Introductions
  • Economic Intelligence
  • Hide from Wordpress Search
  • Investment Knowledge
  • Perspectives
  • Redirecting
  • The Daily Spark
  • The View from Apollo
  • The Weekly Brief
  • Uncategorized
  • White Papers

Inflation Will Soon Peak

The consensus forecast is that inflation will soon peak.

With inflation soon peaking, the question in rates markets is when the Fed will turn more dovish because there is less need for the Fed to be as hawkish once inflation begins to trend lower.

If the Fed starts to sound more dovish because of inflation trending lower, then long rates will likely peak and begin to move down in anticipation of fewer Fed hikes and slower growth coming.

With this asymmetric setup, the pain trade in markets this week is if we get an inflation print lower than the expected 8.4%. In that case, rates are likely to move lower across the curve quickly.

Chart showing that the market is pricing a peak in the Fed funds rate at 3% in mid-2023
Source: Bloomberg, Apollo Chief Economist

Recent Posts

  • More Than Half of Expenditures on Imports From China Stays in the US
  • A 10% Trade War Premium for the Dollar
  • It Takes Time to Rebuild Trust
  • Banks’ Unrealized Losses Increase Again
  • Lower Inventory-to-Sales Ratio for Retailers Today than in 2019

Recent Comments

No comments to show.

Archives

  • May 2025
  • April 2025
  • March 2025
  • February 2025
  • January 2025
  • December 2024
  • November 2024
  • October 2024
  • September 2024
  • August 2024
  • July 2024
  • June 2024
  • May 2024
  • April 2024
  • March 2024
  • February 2024
  • January 2024
  • December 2023
  • November 2023
  • October 2023
  • September 2023
  • August 2023
  • July 2023
  • June 2023
  • May 2023
  • April 2023
  • March 2023
  • February 2023
  • January 2023
  • December 2022
  • November 2022
  • October 2022
  • September 2022
  • August 2022
  • July 2022
  • June 2022
  • May 2022
  • April 2022
  • March 2022
  • February 2022
  • January 2022
  • December 2021
  • November 2021

Categories

  • Apollo Answers
  • Course Introductions
  • Economic Intelligence
  • Hide from Wordpress Search
  • Investment Knowledge
  • Perspectives
  • Redirecting
  • The Daily Spark
  • The View from Apollo
  • The Weekly Brief
  • Uncategorized
  • White Papers

Labor Market Overheating. The Fed Will React to This.

The latest wage data from the Atlanta Fed is out, and it shows the highest growth in wages on record. Job switchers are seeing particularly strong increases in compensation, see charts below.

The Fed will look at these trends and conclude that the labor market is overheating and financial conditions have to be tightened immediately. Either via higher rates, wider credit spreads, lower equities, or some combination. The goal now is demand destruction to get inflation under control, and the market should not underestimate the Fed’s commitment to make this happen.

Chart showing wage growth at record levels
Source: FRB Atlanta, Haver Analytics, Apollo Chief Economist
Chart showing strong wage growth among the major of earners
Source: FRB Atlanta, Apollo Chief Economist

Chart showing wage growth is particularly strong among 16-24 year olds
Source: FRB Atlanta, Apollo Chief Economist
Chart showing solid wage growth for people switching jobs
Source: FRB Atlanta, Apollo Chief Economist

Recent Posts

  • More Than Half of Expenditures on Imports From China Stays in the US
  • A 10% Trade War Premium for the Dollar
  • It Takes Time to Rebuild Trust
  • Banks’ Unrealized Losses Increase Again
  • Lower Inventory-to-Sales Ratio for Retailers Today than in 2019

Recent Comments

No comments to show.

Archives

  • May 2025
  • April 2025
  • March 2025
  • February 2025
  • January 2025
  • December 2024
  • November 2024
  • October 2024
  • September 2024
  • August 2024
  • July 2024
  • June 2024
  • May 2024
  • April 2024
  • March 2024
  • February 2024
  • January 2024
  • December 2023
  • November 2023
  • October 2023
  • September 2023
  • August 2023
  • July 2023
  • June 2023
  • May 2023
  • April 2023
  • March 2023
  • February 2023
  • January 2023
  • December 2022
  • November 2022
  • October 2022
  • September 2022
  • August 2022
  • July 2022
  • June 2022
  • May 2022
  • April 2022
  • March 2022
  • February 2022
  • January 2022
  • December 2021
  • November 2021

Categories

  • Apollo Answers
  • Course Introductions
  • Economic Intelligence
  • Hide from Wordpress Search
  • Investment Knowledge
  • Perspectives
  • Redirecting
  • The Daily Spark
  • The View from Apollo
  • The Weekly Brief
  • Uncategorized
  • White Papers

Rising Funding Ratio for Pension Funds

Rising stock prices and rising discount rates have increased the funding ratio of private and public pension funds, see charts below.

For the first time in 15 years, private pension funds have assets and expected cash flows matching future liabilities.

With the funding ratio reaching 100%, pension funds are de-risking and locking in gains in stock prices and buying rates and also high-grade credit to lock in yields.

The bottom line is that rising funding rates are creating significant demand for fixed income as yields move higher.

A different way to look at it is that as the Fed stops doing QE, another buyer, namely pensions, is stepping in to buy fixed income.

And such significant structural buying makes it harder for the Fed to achieve the desired tightening in financial conditions.

Chart showing private pensions reached fully funded status
Source: Apollo Chief Economist, Federal Reserve Financial Accounts

Chart showing that the rising discount rate has improved the funding status of corporate pensions
Source: Milliman, Bloomberg, Apollo Chief Economist

Recent Posts

  • More Than Half of Expenditures on Imports From China Stays in the US
  • A 10% Trade War Premium for the Dollar
  • It Takes Time to Rebuild Trust
  • Banks’ Unrealized Losses Increase Again
  • Lower Inventory-to-Sales Ratio for Retailers Today than in 2019

Recent Comments

No comments to show.

Archives

  • May 2025
  • April 2025
  • March 2025
  • February 2025
  • January 2025
  • December 2024
  • November 2024
  • October 2024
  • September 2024
  • August 2024
  • July 2024
  • June 2024
  • May 2024
  • April 2024
  • March 2024
  • February 2024
  • January 2024
  • December 2023
  • November 2023
  • October 2023
  • September 2023
  • August 2023
  • July 2023
  • June 2023
  • May 2023
  • April 2023
  • March 2023
  • February 2023
  • January 2023
  • December 2022
  • November 2022
  • October 2022
  • September 2022
  • August 2022
  • July 2022
  • June 2022
  • May 2022
  • April 2022
  • March 2022
  • February 2022
  • January 2022
  • December 2021
  • November 2021

Categories

  • Apollo Answers
  • Course Introductions
  • Economic Intelligence
  • Hide from Wordpress Search
  • Investment Knowledge
  • Perspectives
  • Redirecting
  • The Daily Spark
  • The View from Apollo
  • The Weekly Brief
  • Uncategorized
  • White Papers

QT Impact on 10s

The Fed is going to shrink its holdings of Treasuries by $60bn a month and using the estimates in this Fed working paper, quantifying the stock effect shows that this decline in the Fed’s balance sheet is expected to increase the level of 10-year rates by 50bps by the end of this year. The rule of thumb from the Fed’s work is that for every $100bn in QT 10-year rates will rise by 10bps. The bottom line is that QE pushed rates down and markets should expect QT to push rates higher.

Chart showing the end of asset purchases from major central banks
Source: Bloomberg, Apollo Chief Economist. Pace of purchases for 2021: BOE: £3.4bn per week till mid December 2021, FED: USD120bn per month with wind down from December with purchases ending in March 2022, ECB: Euro 90bn per month (20 bn APP + 60 bn PEPP), PEPP till March 2022, Euro 40bn in April, Euro 30bn in May and Euro 20bn in June, and euro 20bn per month onwards. BOJ:: USD 70bn per month. For 2022: All programs are expected to wind down linearly from January 2022 to December 2022. Fed QT $ 95 per month from May 2022.

Recent Posts

  • More Than Half of Expenditures on Imports From China Stays in the US
  • A 10% Trade War Premium for the Dollar
  • It Takes Time to Rebuild Trust
  • Banks’ Unrealized Losses Increase Again
  • Lower Inventory-to-Sales Ratio for Retailers Today than in 2019

Recent Comments

No comments to show.

Archives

  • May 2025
  • April 2025
  • March 2025
  • February 2025
  • January 2025
  • December 2024
  • November 2024
  • October 2024
  • September 2024
  • August 2024
  • July 2024
  • June 2024
  • May 2024
  • April 2024
  • March 2024
  • February 2024
  • January 2024
  • December 2023
  • November 2023
  • October 2023
  • September 2023
  • August 2023
  • July 2023
  • June 2023
  • May 2023
  • April 2023
  • March 2023
  • February 2023
  • January 2023
  • December 2022
  • November 2022
  • October 2022
  • September 2022
  • August 2022
  • July 2022
  • June 2022
  • May 2022
  • April 2022
  • March 2022
  • February 2022
  • January 2022
  • December 2021
  • November 2021

Categories

  • Apollo Answers
  • Course Introductions
  • Economic Intelligence
  • Hide from Wordpress Search
  • Investment Knowledge
  • Perspectives
  • Redirecting
  • The Daily Spark
  • The View from Apollo
  • The Weekly Brief
  • Uncategorized
  • White Papers

A Labor Market View on the Risks of a U.S. Hard Landing

A labor market view on the risks of a U.S. hard landing by Larry Summers and Alex Domash
https://www.nber.org/papers/w29910

This paper uses historical labor market data to assess the plausibility that the Federal Reserve can engineer a soft landing for the economy. We first show that the labor market today is significantly tighter than implied by the unemployment rate: the vacancy and quit rates currently experienced in the United States correspond to a degree of labor market tightness previously associated with sub-2 percent unemployment rates. We highlight that the super-tight labor market coincides with current wage inflation of 6.5 percent –the highest level experienced in the past 40 years –and that firm-side slack measures predict further increases in wage inflation over the coming year. Finally, we show that high levels of wage inflation have historically been associated with a substantial risk of a recession over the next one to two years. We argue that periods that historically have been hailed as successful soft landings have little in common with the present moment. Our results suggest a very low likelihood that the Federal Reserve can reduce inflation without causing a significant slowdown in economic activity.

Recent Posts

  • More Than Half of Expenditures on Imports From China Stays in the US
  • A 10% Trade War Premium for the Dollar
  • It Takes Time to Rebuild Trust
  • Banks’ Unrealized Losses Increase Again
  • Lower Inventory-to-Sales Ratio for Retailers Today than in 2019

Recent Comments

No comments to show.

Archives

  • May 2025
  • April 2025
  • March 2025
  • February 2025
  • January 2025
  • December 2024
  • November 2024
  • October 2024
  • September 2024
  • August 2024
  • July 2024
  • June 2024
  • May 2024
  • April 2024
  • March 2024
  • February 2024
  • January 2024
  • December 2023
  • November 2023
  • October 2023
  • September 2023
  • August 2023
  • July 2023
  • June 2023
  • May 2023
  • April 2023
  • March 2023
  • February 2023
  • January 2023
  • December 2022
  • November 2022
  • October 2022
  • September 2022
  • August 2022
  • July 2022
  • June 2022
  • May 2022
  • April 2022
  • March 2022
  • February 2022
  • January 2022
  • December 2021
  • November 2021

Categories

  • Apollo Answers
  • Course Introductions
  • Economic Intelligence
  • Hide from Wordpress Search
  • Investment Knowledge
  • Perspectives
  • Redirecting
  • The Daily Spark
  • The View from Apollo
  • The Weekly Brief
  • Uncategorized
  • White Papers

NYC Still Not Back to Pre-Pandemic Levels

In New York City, subway use is at 60% of pre-pandemic levels office use is only 37% of pre-pandemic levels and restaurant bookings are more than 30% below pre-pandemic levels; see charts below.

Chart showing transit activity by various modes are still not back to pre-pandemic levels.
Source: Bloomberg, Apollo Chief Economist
Chart showing office use has not returned to pre-pandemic levels in major cities across the US
Source: Bloomberg, Apollo Chief Economist
Chart showing restaurant bookings have not returned to normal levels
Source: OpenTable, Apollo Chief Economist

Recent Posts

  • More Than Half of Expenditures on Imports From China Stays in the US
  • A 10% Trade War Premium for the Dollar
  • It Takes Time to Rebuild Trust
  • Banks’ Unrealized Losses Increase Again
  • Lower Inventory-to-Sales Ratio for Retailers Today than in 2019

Recent Comments

No comments to show.

Archives

  • May 2025
  • April 2025
  • March 2025
  • February 2025
  • January 2025
  • December 2024
  • November 2024
  • October 2024
  • September 2024
  • August 2024
  • July 2024
  • June 2024
  • May 2024
  • April 2024
  • March 2024
  • February 2024
  • January 2024
  • December 2023
  • November 2023
  • October 2023
  • September 2023
  • August 2023
  • July 2023
  • June 2023
  • May 2023
  • April 2023
  • March 2023
  • February 2023
  • January 2023
  • December 2022
  • November 2022
  • October 2022
  • September 2022
  • August 2022
  • July 2022
  • June 2022
  • May 2022
  • April 2022
  • March 2022
  • February 2022
  • January 2022
  • December 2021
  • November 2021

Categories

  • Apollo Answers
  • Course Introductions
  • Economic Intelligence
  • Hide from Wordpress Search
  • Investment Knowledge
  • Perspectives
  • Redirecting
  • The Daily Spark
  • The View from Apollo
  • The Weekly Brief
  • Uncategorized
  • White Papers

Posts navigation

←Previous page Page 1 Page 2 Page 3 Next page→
  • Privacy Notice
  • Terms of Use
  • Forward-Looking Statements
Apollo
© Apollo Global Management, Inc. 2025 All Rights Reserved.

The Apollo Academy is for informational and educational purposes only and nothing contained herein should be taken as investment advice or a recommendation to enter into any transaction. They are not an invitation by or on behalf of Apollo to any person to buy or sell any security or to adopt any investment strategy, and shall not form the basis of, nor may it accompany nor form part of, any right or contract to buy or sell any security or to adopt any investment strategy. There is no guarantee that the views and opinions expressed in this website will come to pass. For additional information, please see the disclaimers included in each piece of content or the legal page of our website here.