• Apollo.com
  • Login
  • Register Now
light site-logo
  • The Academy
  • Upcoming Events
        • Upcoming Events

        • Hybrid Investments: Flexible Structures for Volatile TimesThursday, May 29, 2025 • 11:00AM ET
  • Learning Center
        • New & UpdatedAlternative Investing Course 2.0

        • Alternative Investing Essentials Part OnePrivate Equity, Venture Capital, Private Credit
        • Alternative Investing Essentials Part TwoReal Estate, Infrastructure, Digital Assets, Hedge Funds
        • Practical ConsiderationsAsset Allocation, Risk Considerations, Fund Structures, Fees
        • Introductory Videos

          View All Videos

        •  Recent Classes & Videos

        • • Private Credit Investing in Volatile Times
        • • Potential Implications of the Latest US Administration Policy Proposals
        • • Beyond 60/40: Private Assets in an Era of High Public Valuations
        • • Investment Grade Private Credit as a Core Fixed Income Allocation
        • • 2025 Economic Outlook: Firing on All Cylinders
        • • Building the Future: Understanding the Tailwinds Behind Infrastructure Investing
        • View All Classes

  • Alternative Perspectives
        • Investment Knowledge
        • The View from Apollo
          • Investment Knowledge White Papers

            Beyond 60/40: Private Assets in an Era of High Public Valuations

            March 21, 2025
          • The View From Apollo

            Private Credit Investing in Volatile Times

            May 9, 2025
          • Investment Knowledge

            Apollo Answers: What Is PIK?

            March 19, 2025
  • The Daily Spark
        • Read The Daily Spark Blog


        • Want it delivered daily to your inbox?
          • The Daily Spark

            More Than Half of Expenditures on Imports From China Stays in the US

            May 15, 2025
          • The Daily Spark

            A 10% Trade War Premium for the Dollar

            May 14, 2025
          • The Daily Spark

            It Takes Time to Rebuild Trust

            May 13, 2025
  • Register for Apollo Academy: Alternative Investing Course
  • Login
  • About Apollo Academy
  • Upcoming Events
  • Learning Center
  • Alternative Perspectives
  • The Daily Spark
  • Register for Apollo Academy: Alternative Investing Course
  • Login
  • Private Credit Investing in Volatile Times
    Tuesday, April 29, 2025 • 11:00am ET
  • Alternative Investing Course 2.0
  • Potential Implications of the Latest US Administration Policy Proposals
  • Beyond 60/40: Private Assets in an Era of Soaring Public Valuations
  • Investment Grade Private Credit as a Core Fixed Income Allocation
  • 2025 Economic Outlook: Where’s the Slowdown?
  • Building the Future: Understanding the Tailwinds Behind Infrastructure Investing
  • Clean Transition Investing: Going Where the Opportunities Are
  • View All Classes
  • Introductory Videos
  • Alternative Investing Essentials Part One • Now Available On Demand
  • Alternative Investing Essentials Part Two • Now Available On Demand
  • Practical Considerations • Now Available On Demand
  • Investment Knowledge
  • The View from Apollo
Home May 2022

Stagflation Risks Rising

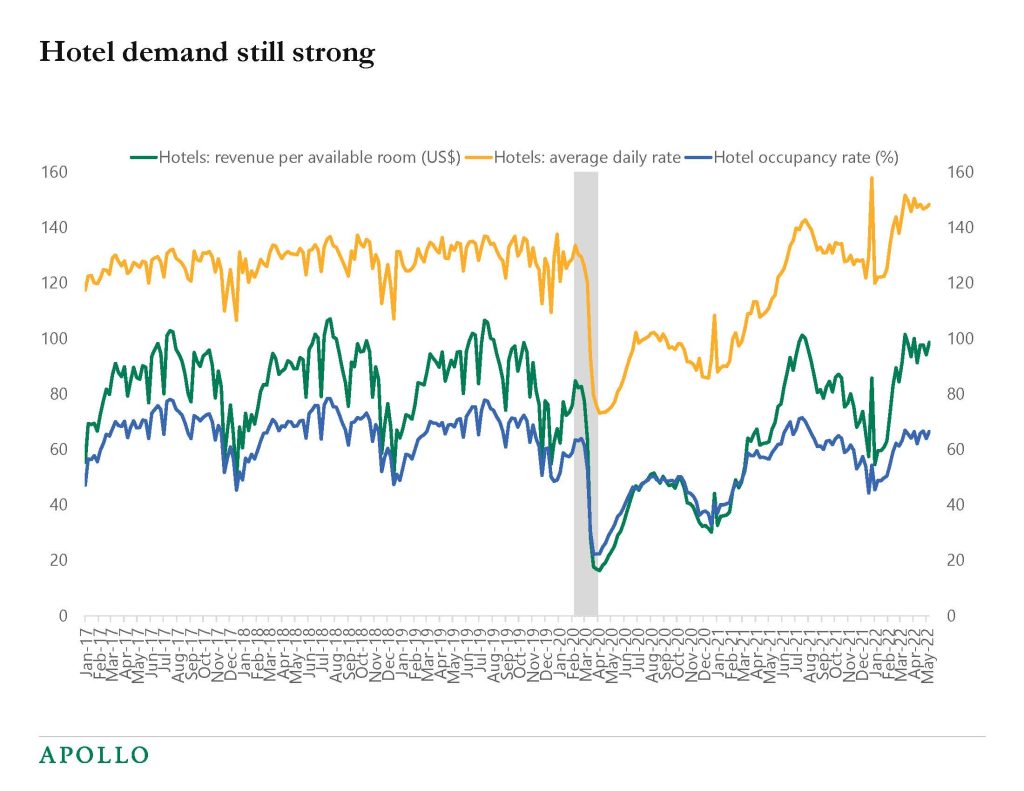
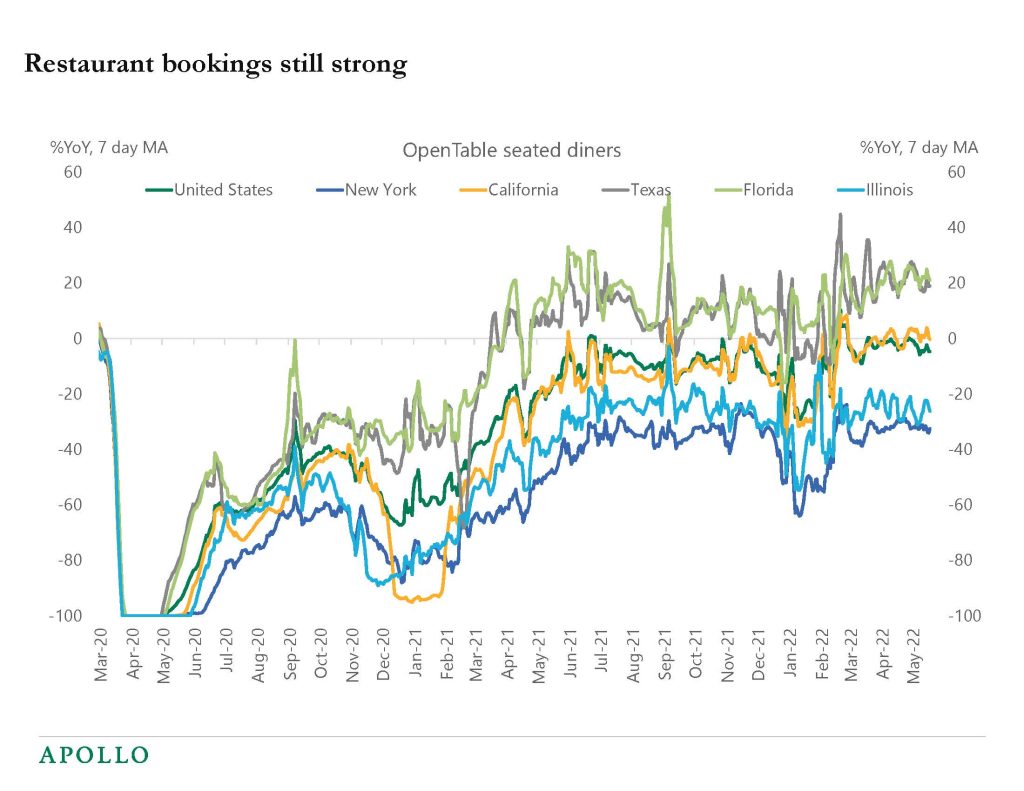
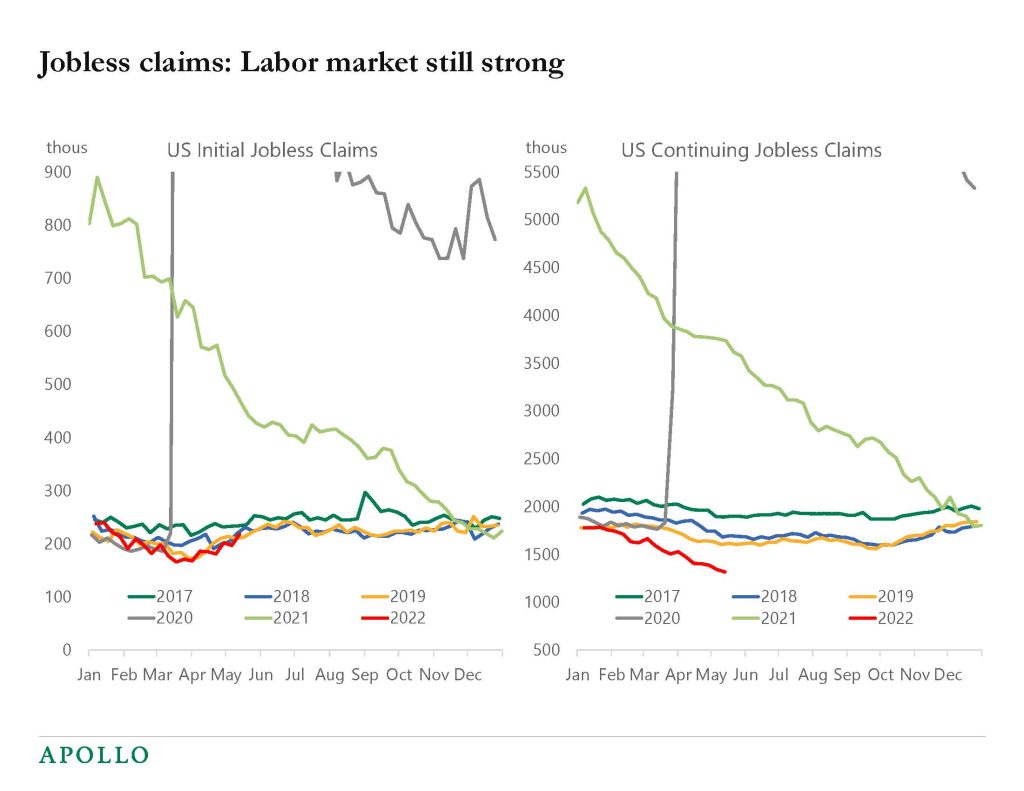
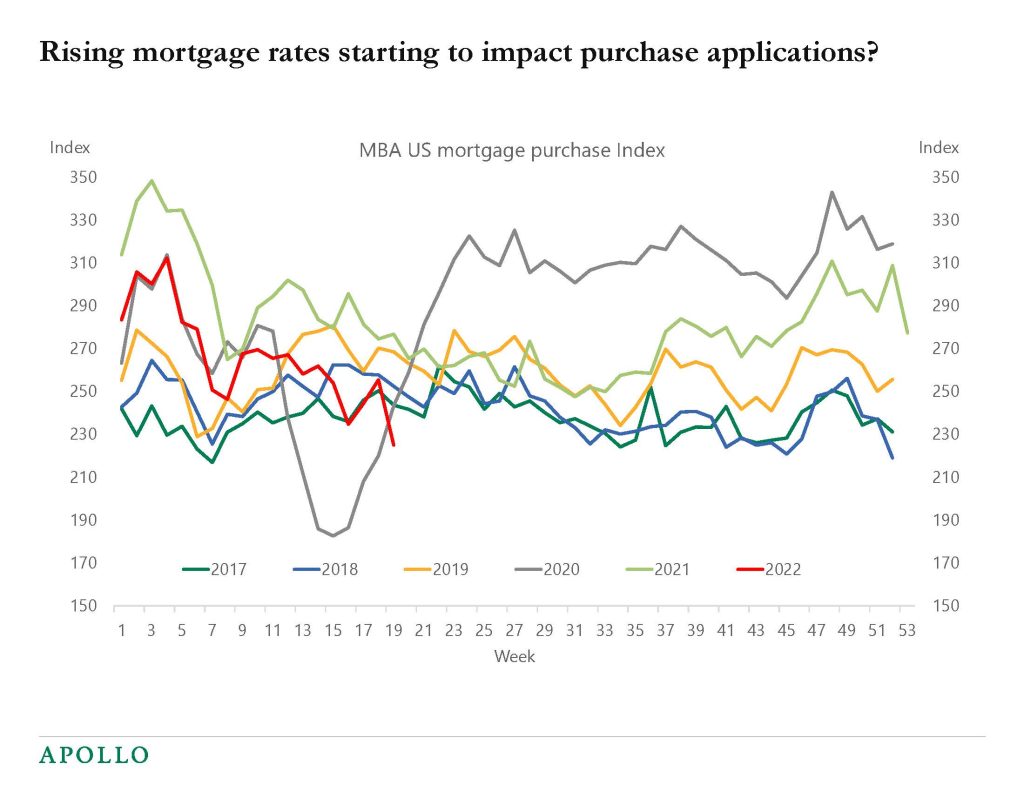
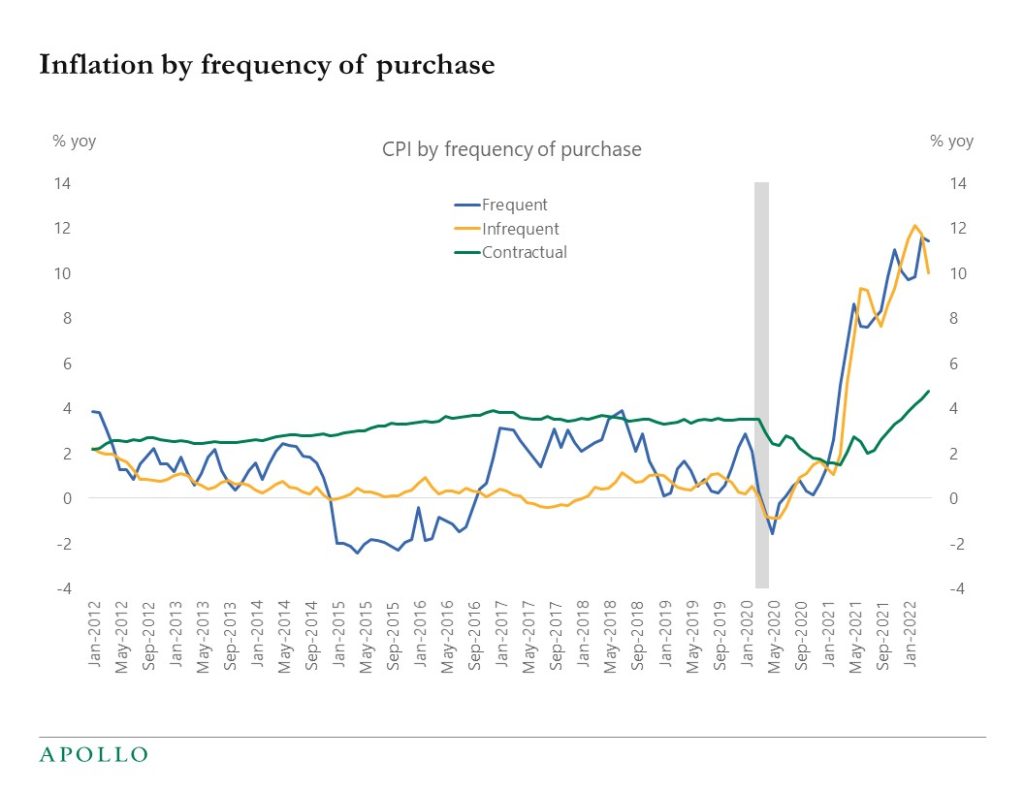
Last week we received retail sales data from which we learned that the consumer continues to do relatively well on the back of strong job and wage growth. A number of retailers reported last week as well, which generated talk in the markets about whether a slowdown was coming. But they too reported strong consumer demand. Their challenges mainly came from the cost side—on supply chain, on labor and wages, and on energy and other input costs. In the week ahead we will receive the FOMC minutes, which will shed more light on how the Fed is thinking about inflation and growth. The minutes are likely to reinforce the same messages we’ve been hearing: that the economy remains strong, that inflation remains a problem, and that interest rates will therefore need to go higher. Meanwhile, we’re beginning to see increased risks of stagflation as the consensus expects inflation to rise and growth to fall. Against this backdrop, we anticipate continued market volatility fueled by ongoing uncertainty about rates and inflation, as well as downward pressure on equities.


This presentation may not be distributed, transmitted or otherwise communicated to others in whole or in part without the express consent of Apollo Global Management, Inc. (together with its subsidiaries, “Apollo”).  

Apollo makes no representation or warranty, expressed or implied, with respect to the accuracy, reasonableness, or completeness of any of the statements made during this presentation, including, but not limited to, statements obtained from third parties. Opinions, estimates and projections constitute the current judgment of the speaker as of the date indicated. They do not necessarily reflect the views and opinions of Apollo and are subject to change at any time without notice. Apollo does not have any responsibility to update this presentation to account for such changes. There can be no assurance that any trends discussed during this presentation will continue.   

Statements made throughout this presentation are not intended to provide, and should not be relied upon for, accounting, legal or tax advice and do not constitute an investment recommendation or investment advice. Investors should make an independent investigation of the information discussed during this presentation, including consulting their tax, legal, accounting or other advisors about such information. Apollo does not act for you and is not responsible for providing you with the protections afforded to its clients. This presentation does not constitute an offer to sell, or the solicitation of an offer to buy, any security, product or service, including interest in any investment product or fund or account managed or advised by Apollo. 

Certain statements made throughout this presentation may be “forward-looking” in nature. Due to various risks and uncertainties, actual events or results may differ materially from those reflected or contemplated in such forward-looking information. As such, undue reliance should not be placed on such statements. Forward-looking statements may be identified by the use of terminology including, but not limited to, “may”, “will”, “should”, “expect”, “anticipate”, “target”, “project”, “estimate”, “intend”, “continue” or “believe” or the negatives thereof or other variations thereon or comparable terminology.

Recent Posts

  • More Than Half of Expenditures on Imports From China Stays in the US
  • A 10% Trade War Premium for the Dollar
  • It Takes Time to Rebuild Trust
  • Banks’ Unrealized Losses Increase Again
  • Lower Inventory-to-Sales Ratio for Retailers Today than in 2019

Recent Comments

No comments to show.

Archives

  • May 2025
  • April 2025
  • March 2025
  • February 2025
  • January 2025
  • December 2024
  • November 2024
  • October 2024
  • September 2024
  • August 2024
  • July 2024
  • June 2024
  • May 2024
  • April 2024
  • March 2024
  • February 2024
  • January 2024
  • December 2023
  • November 2023
  • October 2023
  • September 2023
  • August 2023
  • July 2023
  • June 2023
  • May 2023
  • April 2023
  • March 2023
  • February 2023
  • January 2023
  • December 2022
  • November 2022
  • October 2022
  • September 2022
  • August 2022
  • July 2022
  • June 2022
  • May 2022
  • April 2022
  • March 2022
  • February 2022
  • January 2022
  • December 2021
  • November 2021

Categories

  • Apollo Answers
  • Course Introductions
  • Economic Intelligence
  • Hide from Wordpress Search
  • Investment Knowledge
  • Perspectives
  • Redirecting
  • The Daily Spark
  • The View from Apollo
  • The Weekly Brief
  • Uncategorized
  • White Papers

US Housing Outlook: Slowdown has Started

The charts below show that traffic of prospective buyers of new homes is declining, homebuilder confidence is declining, weekly data for mortgage purchase applications has started to move down, consumer plans to buy a new home have softened, home sales are coming down from their recent peak, leading indicators for home prices are rolling over, and mortgage originations have started to come down, in particular for 30- to 49-year olds. These are all signs that the housing market has started to cool down. This is what the Fed would like to see. The question is if we will get a soft or a hard landing. View the full report.

Chart shows declining home buyer traffic
Source: Bloomberg, Apollo Chief Economist

Chart showing homebuilder confidence is waning again
Source: NAHB, Apollo Chief Economist
Chart showing slumping mortgage applications as interest rates have rebounded
Source: Mortgage Bankers Association, Bloomberg, Apollo Chief Economist

Recent Posts

  • More Than Half of Expenditures on Imports From China Stays in the US
  • A 10% Trade War Premium for the Dollar
  • It Takes Time to Rebuild Trust
  • Banks’ Unrealized Losses Increase Again
  • Lower Inventory-to-Sales Ratio for Retailers Today than in 2019

Recent Comments

No comments to show.

Archives

  • May 2025
  • April 2025
  • March 2025
  • February 2025
  • January 2025
  • December 2024
  • November 2024
  • October 2024
  • September 2024
  • August 2024
  • July 2024
  • June 2024
  • May 2024
  • April 2024
  • March 2024
  • February 2024
  • January 2024
  • December 2023
  • November 2023
  • October 2023
  • September 2023
  • August 2023
  • July 2023
  • June 2023
  • May 2023
  • April 2023
  • March 2023
  • February 2023
  • January 2023
  • December 2022
  • November 2022
  • October 2022
  • September 2022
  • August 2022
  • July 2022
  • June 2022
  • May 2022
  • April 2022
  • March 2022
  • February 2022
  • January 2022
  • December 2021
  • November 2021

Categories

  • Apollo Answers
  • Course Introductions
  • Economic Intelligence
  • Hide from Wordpress Search
  • Investment Knowledge
  • Perspectives
  • Redirecting
  • The Daily Spark
  • The View from Apollo
  • The Weekly Brief
  • Uncategorized
  • White Papers

Weekend Reading

Fed: The anatomy of single-digit inflation in the 1960s
https://www.federalreserve.gov/econres/feds/files/2022029pap.pdf

Fed: Has the current lockdown in China affected the global supply chain?
https://www.kansascityfed.org/Economic%20Bulletin/documents/8821/EconomicBulletin22Nie0520.pdf

ECB: The rise of bond financing in Europe
https://www.ecb.europa.eu/pub/pdf/scpwps/ecb.wp2663~06c26039e0.en.pdf

Recent Posts

  • More Than Half of Expenditures on Imports From China Stays in the US
  • A 10% Trade War Premium for the Dollar
  • It Takes Time to Rebuild Trust
  • Banks’ Unrealized Losses Increase Again
  • Lower Inventory-to-Sales Ratio for Retailers Today than in 2019

Recent Comments

No comments to show.

Archives

  • May 2025
  • April 2025
  • March 2025
  • February 2025
  • January 2025
  • December 2024
  • November 2024
  • October 2024
  • September 2024
  • August 2024
  • July 2024
  • June 2024
  • May 2024
  • April 2024
  • March 2024
  • February 2024
  • January 2024
  • December 2023
  • November 2023
  • October 2023
  • September 2023
  • August 2023
  • July 2023
  • June 2023
  • May 2023
  • April 2023
  • March 2023
  • February 2023
  • January 2023
  • December 2022
  • November 2022
  • October 2022
  • September 2022
  • August 2022
  • July 2022
  • June 2022
  • May 2022
  • April 2022
  • March 2022
  • February 2022
  • January 2022
  • December 2021
  • November 2021

Categories

  • Apollo Answers
  • Course Introductions
  • Economic Intelligence
  • Hide from Wordpress Search
  • Investment Knowledge
  • Perspectives
  • Redirecting
  • The Daily Spark
  • The View from Apollo
  • The Weekly Brief
  • Uncategorized
  • White Papers

Slowdown Watch

I think there is a 75% chance we will have a recession. It is just not happening yet. Our high-frequency indicators show that air travel is still strong, hotel occupancy rates are high, restaurant bookings are strong, credit card spending is still strong, and the weekly data for bank lending is also trending higher.

Weekly jobless claims have started to move slightly higher in recent weeks, but this is consistent with the seasonal pattern. The weekly mortgage purchase applications data is modestly weaker, and we are watching the housing market very carefully.

The Fed’s goal is to cool down all these indicators, and they will ultimately succeed, so investors should continue to prepare for the coming slowdown.

View the slowdown report for May 21.

Chart showing strong traffic at TSA checkpoints
Source: TSA, Bloomberg, Apollo Chief Economist
Chart showing strong hotel occupancy
Source: STR, Haver Analytics, Apollo Chief Economist
Chart showing robust restaurant bookings across major US cities and the overall nation
Source: OpenTable, Apollo Chief Economist

Charts showing continued declines in first-time and continuing jobless claims
Source: Department of Labor, Bloomberg, Apollo Chief Economist

Chart showing that mortgage applications have come down as rates moved higher
Source: Mortgage Bankers Association, Bloomberg, Apollo Chief Economist
Chart showing housing inventories may have bottom but are still at a low level
Source: Redfin, Haver, Apollo Chief Economist
Chart showing a pickup in the loan growth of commercial banks
Source: FRB, Haver, Apollo Chief Economist

Recent Posts

  • More Than Half of Expenditures on Imports From China Stays in the US
  • A 10% Trade War Premium for the Dollar
  • It Takes Time to Rebuild Trust
  • Banks’ Unrealized Losses Increase Again
  • Lower Inventory-to-Sales Ratio for Retailers Today than in 2019

Recent Comments

No comments to show.

Archives

  • May 2025
  • April 2025
  • March 2025
  • February 2025
  • January 2025
  • December 2024
  • November 2024
  • October 2024
  • September 2024
  • August 2024
  • July 2024
  • June 2024
  • May 2024
  • April 2024
  • March 2024
  • February 2024
  • January 2024
  • December 2023
  • November 2023
  • October 2023
  • September 2023
  • August 2023
  • July 2023
  • June 2023
  • May 2023
  • April 2023
  • March 2023
  • February 2023
  • January 2023
  • December 2022
  • November 2022
  • October 2022
  • September 2022
  • August 2022
  • July 2022
  • June 2022
  • May 2022
  • April 2022
  • March 2022
  • February 2022
  • January 2022
  • December 2021
  • November 2021

Categories

  • Apollo Answers
  • Course Introductions
  • Economic Intelligence
  • Hide from Wordpress Search
  • Investment Knowledge
  • Perspectives
  • Redirecting
  • The Daily Spark
  • The View from Apollo
  • The Weekly Brief
  • Uncategorized
  • White Papers

We Could Have a U-Shaped Recession

Apartment rents in Manhattan are up 40% over the past 12 months, and the median rent is now $3,900, see charts below. The ongoing increase in housing costs across the country is beginning to have a negative impact on other types of consumer spending. The more money households have to spend on paying for their rent or mortgage, the less money is available for consumer discretionary purchases such as buying a new phone, replacing a washer or dryer, and eating at restaurants. The Fed is trying to cool down the economy, including the housing market, and they will succeed, and the risks are rising that we will get a U-shaped recession as the Fed keeps rates high to make sure inflation comes down from the current level of 8% to their 2% target.

Chart showing rents in Manhattan have spiked well above pre-pandemic levels
Source: Elliman, Apollo Chief Economist
Chart showing Manhattan rents have surged 40% year over year
Source: Elliman, Apollo Chief Economist
Chart showing rents in Manhattan are now 15% above pre-pandemic levels
Source: Elliman, Apollo Chief Economist

Recent Posts

  • More Than Half of Expenditures on Imports From China Stays in the US
  • A 10% Trade War Premium for the Dollar
  • It Takes Time to Rebuild Trust
  • Banks’ Unrealized Losses Increase Again
  • Lower Inventory-to-Sales Ratio for Retailers Today than in 2019

Recent Comments

No comments to show.

Archives

  • May 2025
  • April 2025
  • March 2025
  • February 2025
  • January 2025
  • December 2024
  • November 2024
  • October 2024
  • September 2024
  • August 2024
  • July 2024
  • June 2024
  • May 2024
  • April 2024
  • March 2024
  • February 2024
  • January 2024
  • December 2023
  • November 2023
  • October 2023
  • September 2023
  • August 2023
  • July 2023
  • June 2023
  • May 2023
  • April 2023
  • March 2023
  • February 2023
  • January 2023
  • December 2022
  • November 2022
  • October 2022
  • September 2022
  • August 2022
  • July 2022
  • June 2022
  • May 2022
  • April 2022
  • March 2022
  • February 2022
  • January 2022
  • December 2021
  • November 2021

Categories

  • Apollo Answers
  • Course Introductions
  • Economic Intelligence
  • Hide from Wordpress Search
  • Investment Knowledge
  • Perspectives
  • Redirecting
  • The Daily Spark
  • The View from Apollo
  • The Weekly Brief
  • Uncategorized
  • White Papers

NYC Subway Use

The number of people using the subway in New York City is still far below normal, see chart below.


Chart showing subway use in the NYC area is still well below levels in 2019
Source: toddwschnieder.com, MTA, Apollo Chief Economist

Recent Posts

  • More Than Half of Expenditures on Imports From China Stays in the US
  • A 10% Trade War Premium for the Dollar
  • It Takes Time to Rebuild Trust
  • Banks’ Unrealized Losses Increase Again
  • Lower Inventory-to-Sales Ratio for Retailers Today than in 2019

Recent Comments

No comments to show.

Archives

  • May 2025
  • April 2025
  • March 2025
  • February 2025
  • January 2025
  • December 2024
  • November 2024
  • October 2024
  • September 2024
  • August 2024
  • July 2024
  • June 2024
  • May 2024
  • April 2024
  • March 2024
  • February 2024
  • January 2024
  • December 2023
  • November 2023
  • October 2023
  • September 2023
  • August 2023
  • July 2023
  • June 2023
  • May 2023
  • April 2023
  • March 2023
  • February 2023
  • January 2023
  • December 2022
  • November 2022
  • October 2022
  • September 2022
  • August 2022
  • July 2022
  • June 2022
  • May 2022
  • April 2022
  • March 2022
  • February 2022
  • January 2022
  • December 2021
  • November 2021

Categories

  • Apollo Answers
  • Course Introductions
  • Economic Intelligence
  • Hide from Wordpress Search
  • Investment Knowledge
  • Perspectives
  • Redirecting
  • The Daily Spark
  • The View from Apollo
  • The Weekly Brief
  • Uncategorized
  • White Papers

Bursting Tech Bubble Will Spread to the Broader Economy

The first chart below shows that many tech stocks are down 70%-80% from their peaks, the second chart shows how SG&A spending for many of these companies has increased dramatically in recent years, and the third chart shows that total employment in these companies has increased from around 300,000 in 2019 to about 450,000 today. The bottom line is that the bursting tech bubble will have significant negative consequences for the broader economy through layoffs, less spending on rents, and less spending on advertising. 

Table showing significant percentage declines in the stock prices of 81 tech/tech-related companies
Table showing large increases in SG&A expense in recent years
Source: Bloomberg, Apollo Chief Economist (Note: SG&A is defined as the sum of all direct and indirect expenses (such as advertising expenses), general and administrative expenses (including rental expenses).
Chart showing large increases in hiring in recent years for the 81 firms with significant drops in stock prices
Source: Bloomberg, Apollo Chief Economist

Recent Posts

  • More Than Half of Expenditures on Imports From China Stays in the US
  • A 10% Trade War Premium for the Dollar
  • It Takes Time to Rebuild Trust
  • Banks’ Unrealized Losses Increase Again
  • Lower Inventory-to-Sales Ratio for Retailers Today than in 2019

Recent Comments

No comments to show.

Archives

  • May 2025
  • April 2025
  • March 2025
  • February 2025
  • January 2025
  • December 2024
  • November 2024
  • October 2024
  • September 2024
  • August 2024
  • July 2024
  • June 2024
  • May 2024
  • April 2024
  • March 2024
  • February 2024
  • January 2024
  • December 2023
  • November 2023
  • October 2023
  • September 2023
  • August 2023
  • July 2023
  • June 2023
  • May 2023
  • April 2023
  • March 2023
  • February 2023
  • January 2023
  • December 2022
  • November 2022
  • October 2022
  • September 2022
  • August 2022
  • July 2022
  • June 2022
  • May 2022
  • April 2022
  • March 2022
  • February 2022
  • January 2022
  • December 2021
  • November 2021

Categories

  • Apollo Answers
  • Course Introductions
  • Economic Intelligence
  • Hide from Wordpress Search
  • Investment Knowledge
  • Perspectives
  • Redirecting
  • The Daily Spark
  • The View from Apollo
  • The Weekly Brief
  • Uncategorized
  • White Papers

Travel Not Slowing Down

The price of airline tickets increased 19% from March to April, the daily TSA data for traveler throughput continues to grow, and Las Vegas visitor volumes continue to recover, see charts below.

With the economy reopening, significant household savings, and more people flying, eating at restaurants, and staying at hotels, the Fed has to increase interest rates further to slow down the consumer services sector.


Chart showing strong traveler traffic at TSA checkpoints
Source: TSA, Bloomberg, Apollo Chief Economist
Chart showing a strong recovery in Las Vegas victors
Source: LCVCA, Bloomberg, Apollo Chief Economist
Chart showing winnings at Nevada casinos are at record highs
Source: Bloomberg, Apollo Chief Economist. Note: Winnings includes total revenue from table, counter and card games and slot machines.

Recent Posts

  • More Than Half of Expenditures on Imports From China Stays in the US
  • A 10% Trade War Premium for the Dollar
  • It Takes Time to Rebuild Trust
  • Banks’ Unrealized Losses Increase Again
  • Lower Inventory-to-Sales Ratio for Retailers Today than in 2019

Recent Comments

No comments to show.

Archives

  • May 2025
  • April 2025
  • March 2025
  • February 2025
  • January 2025
  • December 2024
  • November 2024
  • October 2024
  • September 2024
  • August 2024
  • July 2024
  • June 2024
  • May 2024
  • April 2024
  • March 2024
  • February 2024
  • January 2024
  • December 2023
  • November 2023
  • October 2023
  • September 2023
  • August 2023
  • July 2023
  • June 2023
  • May 2023
  • April 2023
  • March 2023
  • February 2023
  • January 2023
  • December 2022
  • November 2022
  • October 2022
  • September 2022
  • August 2022
  • July 2022
  • June 2022
  • May 2022
  • April 2022
  • March 2022
  • February 2022
  • January 2022
  • December 2021
  • November 2021

Categories

  • Apollo Answers
  • Course Introductions
  • Economic Intelligence
  • Hide from Wordpress Search
  • Investment Knowledge
  • Perspectives
  • Redirecting
  • The Daily Spark
  • The View from Apollo
  • The Weekly Brief
  • Uncategorized
  • White Papers

Credit Card Debt Rising

Last week, the market expected CPI inflation to come in at 8.1%, but it came in higher at 8.3%. This raised concerns that perhaps elevated inflation will last longer, adding more uncertainty to market outlooks. In the week ahead, we will receive retail sales data, which will provide insight into the strength of the economy and the U.S. consumer. With record levels of savings, it seems that consumers are doing quite well. Additionally, we’re beginning to see credit card debt rise. This is happening not because households don’t have funds to spend, but because the virus is subsiding and people are engaging with the economy again. Taken together, the combined forces of excess cash on hand and increased credit card activity indicates that the economy remains strong. In conclusion, high inflation remains an issue and we continue to see signs of an overheating economy. As a result, we can expect the Fed to remain hawkish as it works to cool things down.


This presentation may not be distributed, transmitted or otherwise communicated to others in whole or in part without the express consent of Apollo Global Management, Inc. (together with its subsidiaries, “Apollo”).  

Apollo makes no representation or warranty, expressed or implied, with respect to the accuracy, reasonableness, or completeness of any of the statements made during this presentation, including, but not limited to, statements obtained from third parties. Opinions, estimates and projections constitute the current judgment of the speaker as of the date indicated. They do not necessarily reflect the views and opinions of Apollo and are subject to change at any time without notice. Apollo does not have any responsibility to update this presentation to account for such changes. There can be no assurance that any trends discussed during this presentation will continue.   

Statements made throughout this presentation are not intended to provide, and should not be relied upon for, accounting, legal or tax advice and do not constitute an investment recommendation or investment advice. Investors should make an independent investigation of the information discussed during this presentation, including consulting their tax, legal, accounting or other advisors about such information. Apollo does not act for you and is not responsible for providing you with the protections afforded to its clients. This presentation does not constitute an offer to sell, or the solicitation of an offer to buy, any security, product or service, including interest in any investment product or fund or account managed or advised by Apollo. 

Certain statements made throughout this presentation may be “forward-looking” in nature. Due to various risks and uncertainties, actual events or results may differ materially from those reflected or contemplated in such forward-looking information. As such, undue reliance should not be placed on such statements. Forward-looking statements may be identified by the use of terminology including, but not limited to, “may”, “will”, “should”, “expect”, “anticipate”, “target”, “project”, “estimate”, “intend”, “continue” or “believe” or the negatives thereof or other variations thereon or comparable terminology.

Recent Posts

  • More Than Half of Expenditures on Imports From China Stays in the US
  • A 10% Trade War Premium for the Dollar
  • It Takes Time to Rebuild Trust
  • Banks’ Unrealized Losses Increase Again
  • Lower Inventory-to-Sales Ratio for Retailers Today than in 2019

Recent Comments

No comments to show.

Archives

  • May 2025
  • April 2025
  • March 2025
  • February 2025
  • January 2025
  • December 2024
  • November 2024
  • October 2024
  • September 2024
  • August 2024
  • July 2024
  • June 2024
  • May 2024
  • April 2024
  • March 2024
  • February 2024
  • January 2024
  • December 2023
  • November 2023
  • October 2023
  • September 2023
  • August 2023
  • July 2023
  • June 2023
  • May 2023
  • April 2023
  • March 2023
  • February 2023
  • January 2023
  • December 2022
  • November 2022
  • October 2022
  • September 2022
  • August 2022
  • July 2022
  • June 2022
  • May 2022
  • April 2022
  • March 2022
  • February 2022
  • January 2022
  • December 2021
  • November 2021

Categories

  • Apollo Answers
  • Course Introductions
  • Economic Intelligence
  • Hide from Wordpress Search
  • Investment Knowledge
  • Perspectives
  • Redirecting
  • The Daily Spark
  • The View from Apollo
  • The Weekly Brief
  • Uncategorized
  • White Papers

Inflation by Frequency of Purchase

The chart below shows inflation by frequency of purchase. Inflation for products we frequently buy, such as food, beverages, and gas, is currently running at close to 12%. Inflation for goods we buy infrequently, such as furniture, clothes, and cars, is running at 10%. Contractual inflation, such as housing and rent, is currently around 5%. Across all frequencies, the trend is higher and that is the reason the Fed is so hawkish.

Chart showing that inflation for frequently purchased goods are running in double digits
Source: BLS, Apollo Chief Economics

Recent Posts

  • More Than Half of Expenditures on Imports From China Stays in the US
  • A 10% Trade War Premium for the Dollar
  • It Takes Time to Rebuild Trust
  • Banks’ Unrealized Losses Increase Again
  • Lower Inventory-to-Sales Ratio for Retailers Today than in 2019

Recent Comments

No comments to show.

Archives

  • May 2025
  • April 2025
  • March 2025
  • February 2025
  • January 2025
  • December 2024
  • November 2024
  • October 2024
  • September 2024
  • August 2024
  • July 2024
  • June 2024
  • May 2024
  • April 2024
  • March 2024
  • February 2024
  • January 2024
  • December 2023
  • November 2023
  • October 2023
  • September 2023
  • August 2023
  • July 2023
  • June 2023
  • May 2023
  • April 2023
  • March 2023
  • February 2023
  • January 2023
  • December 2022
  • November 2022
  • October 2022
  • September 2022
  • August 2022
  • July 2022
  • June 2022
  • May 2022
  • April 2022
  • March 2022
  • February 2022
  • January 2022
  • December 2021
  • November 2021

Categories

  • Apollo Answers
  • Course Introductions
  • Economic Intelligence
  • Hide from Wordpress Search
  • Investment Knowledge
  • Perspectives
  • Redirecting
  • The Daily Spark
  • The View from Apollo
  • The Weekly Brief
  • Uncategorized
  • White Papers

Posts navigation

←Previous page Page 1 Page 2 Page 3 Page 4 Next page→
  • Privacy Notice
  • Terms of Use
  • Forward-Looking Statements
Apollo
© Apollo Global Management, Inc. 2025 All Rights Reserved.

The Apollo Academy is for informational and educational purposes only and nothing contained herein should be taken as investment advice or a recommendation to enter into any transaction. They are not an invitation by or on behalf of Apollo to any person to buy or sell any security or to adopt any investment strategy, and shall not form the basis of, nor may it accompany nor form part of, any right or contract to buy or sell any security or to adopt any investment strategy. There is no guarantee that the views and opinions expressed in this website will come to pass. For additional information, please see the disclaimers included in each piece of content or the legal page of our website here.