• Apollo.com
  • Login
  • Register Now
light site-logo
  • The Academy
  • Upcoming Events
        • Upcoming Events

        • Hybrid Investments: Flexible Structures for Volatile TimesThursday, May 29, 2025 • 11:00AM ET
  • Learning Center
        • New & UpdatedAlternative Investing Course 2.0

        • Alternative Investing Essentials Part OnePrivate Equity, Venture Capital, Private Credit
        • Alternative Investing Essentials Part TwoReal Estate, Infrastructure, Digital Assets, Hedge Funds
        • Practical ConsiderationsAsset Allocation, Risk Considerations, Fund Structures, Fees
        • Introductory Videos

          View All Videos

        •  Recent Classes & Videos

        • • Private Credit Investing in Volatile Times
        • • Potential Implications of the Latest US Administration Policy Proposals
        • • Beyond 60/40: Private Assets in an Era of High Public Valuations
        • • Investment Grade Private Credit as a Core Fixed Income Allocation
        • • 2025 Economic Outlook: Firing on All Cylinders
        • • Building the Future: Understanding the Tailwinds Behind Infrastructure Investing
        • View All Classes

  • Alternative Perspectives
        • Investment Knowledge
        • The View from Apollo
          • Investment Knowledge White Papers

            Beyond 60/40: Private Assets in an Era of High Public Valuations

            March 21, 2025
          • The View From Apollo

            Private Credit Investing in Volatile Times

            May 9, 2025
          • Investment Knowledge

            Apollo Answers: What Is PIK?

            March 19, 2025
  • The Daily Spark
        • Read The Daily Spark Blog


        • Want it delivered daily to your inbox?
          • The Daily Spark

            More Than Half of Expenditures on Imports From China Stays in the US

            May 15, 2025
          • The Daily Spark

            A 10% Trade War Premium for the Dollar

            May 14, 2025
          • The Daily Spark

            It Takes Time to Rebuild Trust

            May 13, 2025
  • Register for Apollo Academy: Alternative Investing Course
  • Login
  • About Apollo Academy
  • Upcoming Events
  • Learning Center
  • Alternative Perspectives
  • The Daily Spark
  • Register for Apollo Academy: Alternative Investing Course
  • Login
  • Private Credit Investing in Volatile Times
    Tuesday, April 29, 2025 • 11:00am ET
  • Alternative Investing Course 2.0
  • Potential Implications of the Latest US Administration Policy Proposals
  • Beyond 60/40: Private Assets in an Era of Soaring Public Valuations
  • Investment Grade Private Credit as a Core Fixed Income Allocation
  • 2025 Economic Outlook: Where’s the Slowdown?
  • Building the Future: Understanding the Tailwinds Behind Infrastructure Investing
  • Clean Transition Investing: Going Where the Opportunities Are
  • View All Classes
  • Introductory Videos
  • Alternative Investing Essentials Part One • Now Available On Demand
  • Alternative Investing Essentials Part Two • Now Available On Demand
  • Practical Considerations • Now Available On Demand
  • Investment Knowledge
  • The View from Apollo
Home July 2023

$100 Billion Drag on Consumer Spending Coming

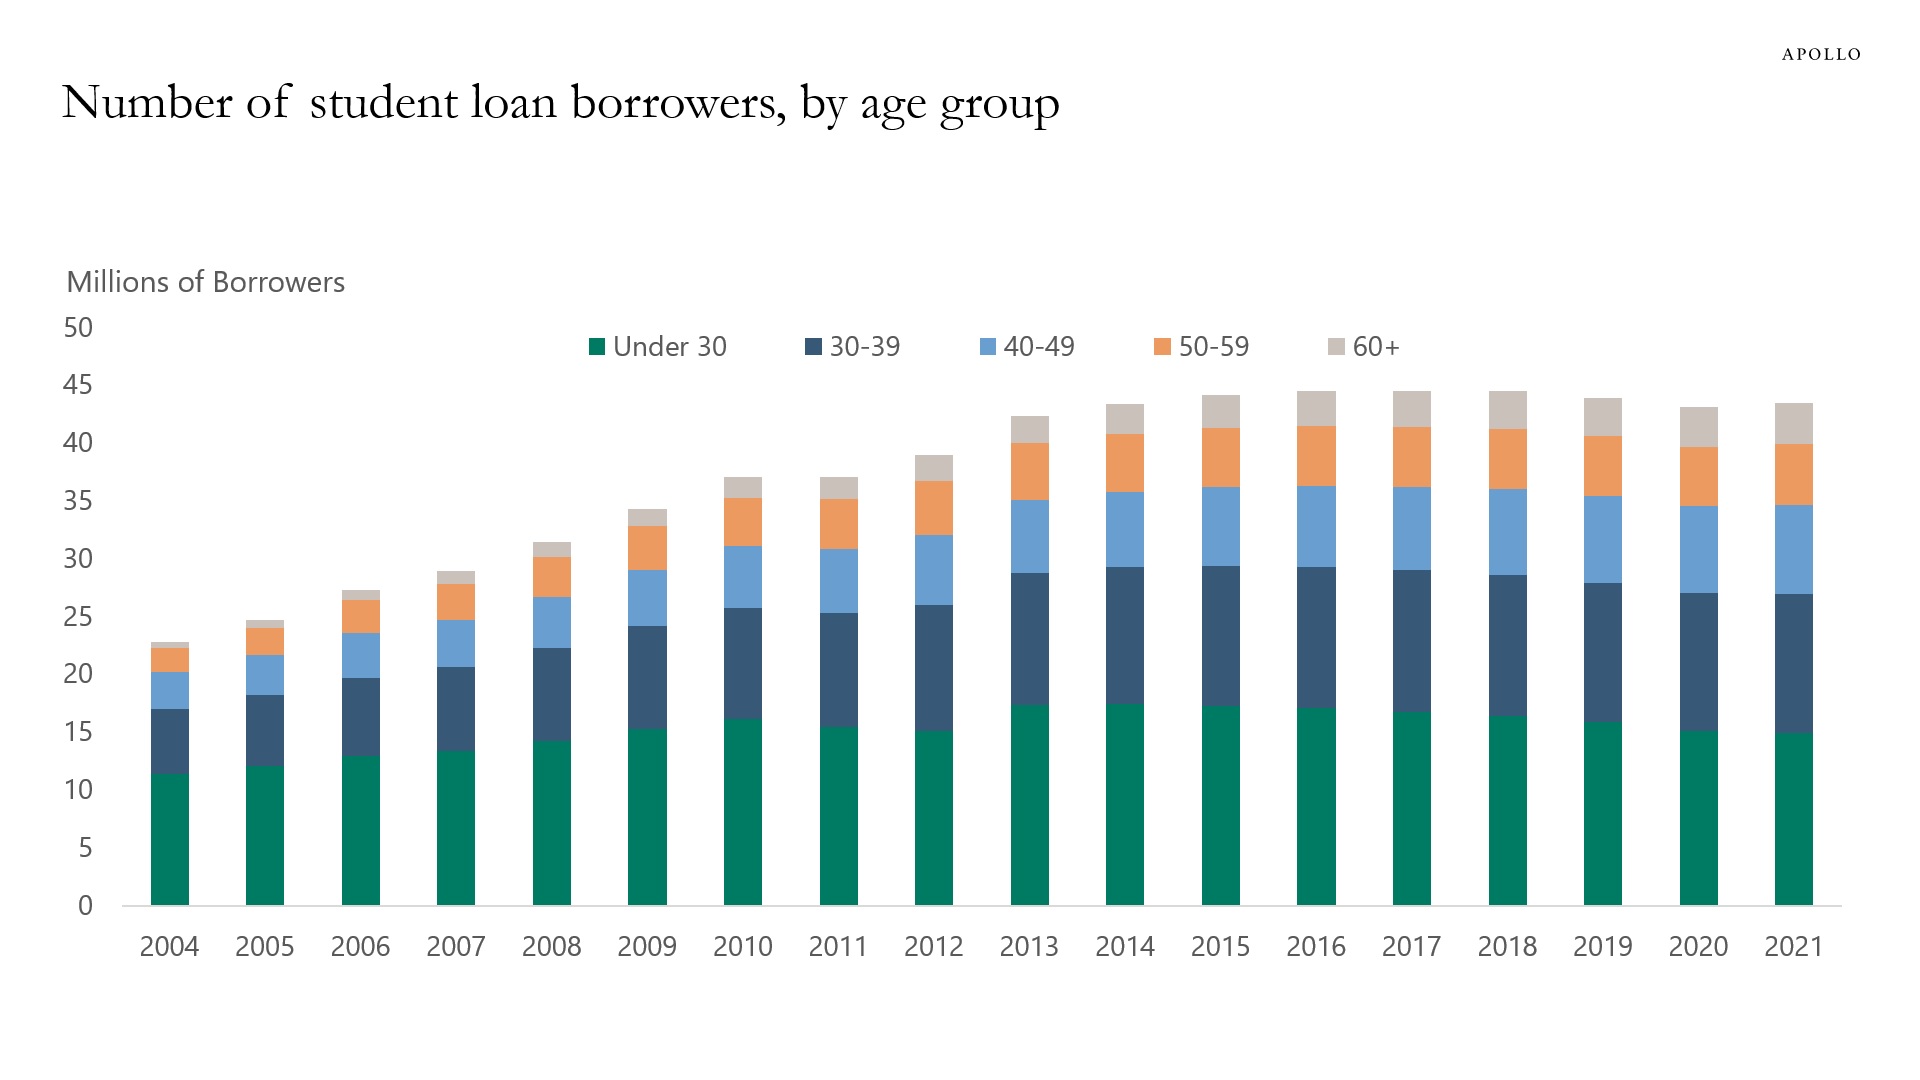
There are a total of 45 million people with student loans, and the average monthly student loan payment is around $200. So resuming student loan payments in October will subtract roughly $9 billion from consumer spending every month, or roughly $100 billion a year, and this will mainly have an impact on younger households, see chart below.

Source: FRBNY, Apollo Chief Economist

Recent Posts

  • More Than Half of Expenditures on Imports From China Stays in the US
  • A 10% Trade War Premium for the Dollar
  • It Takes Time to Rebuild Trust
  • Banks’ Unrealized Losses Increase Again
  • Lower Inventory-to-Sales Ratio for Retailers Today than in 2019

Recent Comments

No comments to show.

Archives

  • May 2025
  • April 2025
  • March 2025
  • February 2025
  • January 2025
  • December 2024
  • November 2024
  • October 2024
  • September 2024
  • August 2024
  • July 2024
  • June 2024
  • May 2024
  • April 2024
  • March 2024
  • February 2024
  • January 2024
  • December 2023
  • November 2023
  • October 2023
  • September 2023
  • August 2023
  • July 2023
  • June 2023
  • May 2023
  • April 2023
  • March 2023
  • February 2023
  • January 2023
  • December 2022
  • November 2022
  • October 2022
  • September 2022
  • August 2022
  • July 2022
  • June 2022
  • May 2022
  • April 2022
  • March 2022
  • February 2022
  • January 2022
  • December 2021
  • November 2021

Categories

  • Apollo Answers
  • Course Introductions
  • Economic Intelligence
  • Hide from Wordpress Search
  • Investment Knowledge
  • Perspectives
  • Redirecting
  • The Daily Spark
  • The View from Apollo
  • The Weekly Brief
  • Uncategorized
  • White Papers

Japan Policy Shift

Last week, as expected, the Federal Reserve raised interest rates by 25 basis points. Fed Chairman Jerome Powell didn’t give any specific forward guidance, except to say they don’t expect to cut rates in 2023. Another important event last week came from Japan. The Bank of Japan signaled that it will exit yield curve control after many years to help address high inflation levels. The implication is that we will ultimately begin to see the level of government bond rates go up in that country. This could prompt Japanese investors—who currently own more than a trillion dollars of US Treasuries—to shift their focus to their own country if they begin to see higher yields in their own backyards.


This presentation may not be distributed, transmitted or otherwise communicated to others in whole or in part without the express consent of Apollo Global Management, Inc. (together with its subsidiaries, “Apollo”).  

Apollo makes no representation or warranty, expressed or implied, with respect to the accuracy, reasonableness, or completeness of any of the statements made during this presentation, including, but not limited to, statements obtained from third parties. Opinions, estimates and projections constitute the current judgment of the speaker as of the date indicated. They do not necessarily reflect the views and opinions of Apollo and are subject to change at any time without notice. Apollo does not have any responsibility to update this presentation to account for such changes. There can be no assurance that any trends discussed during this presentation will continue.   

Statements made throughout this presentation are not intended to provide, and should not be relied upon for, accounting, legal or tax advice and do not constitute an investment recommendation or investment advice. Investors should make an independent investigation of the information discussed during this presentation, including consulting their tax, legal, accounting or other advisors about such information. Apollo does not act for you and is not responsible for providing you with the protections afforded to its clients. This presentation does not constitute an offer to sell, or the solicitation of an offer to buy, any security, product or service, including interest in any investment product or fund or account managed or advised by Apollo. 

Certain statements made throughout this presentation may be “forward-looking” in nature. Due to various risks and uncertainties, actual events or results may differ materially from those reflected or contemplated in such forward-looking information. As such, undue reliance should not be placed on such statements. Forward-looking statements may be identified by the use of terminology including, but not limited to, “may”, “will”, “should”, “expect”, “anticipate”, “target”, “project”, “estimate”, “intend”, “continue” or “believe” or the negatives thereof or other variations thereon or comparable terminology.

Recent Posts

  • More Than Half of Expenditures on Imports From China Stays in the US
  • A 10% Trade War Premium for the Dollar
  • It Takes Time to Rebuild Trust
  • Banks’ Unrealized Losses Increase Again
  • Lower Inventory-to-Sales Ratio for Retailers Today than in 2019

Recent Comments

No comments to show.

Archives

  • May 2025
  • April 2025
  • March 2025
  • February 2025
  • January 2025
  • December 2024
  • November 2024
  • October 2024
  • September 2024
  • August 2024
  • July 2024
  • June 2024
  • May 2024
  • April 2024
  • March 2024
  • February 2024
  • January 2024
  • December 2023
  • November 2023
  • October 2023
  • September 2023
  • August 2023
  • July 2023
  • June 2023
  • May 2023
  • April 2023
  • March 2023
  • February 2023
  • January 2023
  • December 2022
  • November 2022
  • October 2022
  • September 2022
  • August 2022
  • July 2022
  • June 2022
  • May 2022
  • April 2022
  • March 2022
  • February 2022
  • January 2022
  • December 2021
  • November 2021

Categories

  • Apollo Answers
  • Course Introductions
  • Economic Intelligence
  • Hide from Wordpress Search
  • Investment Knowledge
  • Perspectives
  • Redirecting
  • The Daily Spark
  • The View from Apollo
  • The Weekly Brief
  • Uncategorized
  • White Papers

Total Employment of Firms in the HY Index Is 11 Million People

Total employment in the US economy is currently around 156 million, and we estimate that total employment of companies in the high yield index is 11 million, and total employment of companies in the leveraged loans index is 8 million, see chart below. With interest rates staying high for at least another year, the downside risks to employment continue to be meaningful.

Source: Bloomberg, ICE BofA H0A0 Index, Morningstar LSTA Index, Apollo Chief Economist. Note: Data includes 858 companies in the HY index with employment data available for 589 companies and median employment assumed for the rest. Similarly, there are 1059 companies in the leveraged loans index with employment data available for 451 companies and median employment assumed for the rest.

Recent Posts

  • More Than Half of Expenditures on Imports From China Stays in the US
  • A 10% Trade War Premium for the Dollar
  • It Takes Time to Rebuild Trust
  • Banks’ Unrealized Losses Increase Again
  • Lower Inventory-to-Sales Ratio for Retailers Today than in 2019

Recent Comments

No comments to show.

Archives

  • May 2025
  • April 2025
  • March 2025
  • February 2025
  • January 2025
  • December 2024
  • November 2024
  • October 2024
  • September 2024
  • August 2024
  • July 2024
  • June 2024
  • May 2024
  • April 2024
  • March 2024
  • February 2024
  • January 2024
  • December 2023
  • November 2023
  • October 2023
  • September 2023
  • August 2023
  • July 2023
  • June 2023
  • May 2023
  • April 2023
  • March 2023
  • February 2023
  • January 2023
  • December 2022
  • November 2022
  • October 2022
  • September 2022
  • August 2022
  • July 2022
  • June 2022
  • May 2022
  • April 2022
  • March 2022
  • February 2022
  • January 2022
  • December 2021
  • November 2021

Categories

  • Apollo Answers
  • Course Introductions
  • Economic Intelligence
  • Hide from Wordpress Search
  • Investment Knowledge
  • Perspectives
  • Redirecting
  • The Daily Spark
  • The View from Apollo
  • The Weekly Brief
  • Uncategorized
  • White Papers

BoJ YCC Exit

With yields going up in Japan, the risk is that Japanese investors will now begin to sell US fixed income and start buying higher-yielding Japanese fixed income.  

This is a big deal for global fixed income markets because Japanese investors are the biggest foreign holder of US Treasuries, and they also own significant amounts of US credit.

Our updated BoJ YCC exit chart book is available here, a few key stats:

  • Japan is the largest holder of US Treasuries in the world, see the first chart below.
  • The BoJ owns more than 50% of all JGBs outstanding, see the second chart.
  • BoJ JGB buying has been a dominant force in markets for the past decade, see the third chart.
  • Because of the significant yield differences in the front end of the yield curve between the US and Japan, the hedging costs for Japanese investors buying US Treasuries are very high at the moment, see the fourth chart.
  • Also, this BoJ illustration of their policy change shows how they will now do “YCC with greater flexibility.”

All other central banks in the world, including the Fed, ECB, BoE BoC, and RBA, have aggressively raised short-term interest rates to get inflation under control. The BoJ has not raised short-term interest rates, and abandoning YCC is the BoJ’s response to high inflation. The BoJ YCC policy started in 2016.

What are the consequences of Japan abandoning YCC?
Japan owns more than $1 trillion in US Treasuries, more than China
Source: Bloomberg, Apollo Chief Economist
The BoJ owns more than 50% of Japanese government bonds
Source: BoJ, Bloomberg, Apollo Chief Economist
BoJ bond buying since 2013
Source: Bloomberg, Apollo Chief Economist
Dollar-hedging costs for Japanese investors
Source: Bloomberg, Apollo Chief Economist

Recent Posts

  • More Than Half of Expenditures on Imports From China Stays in the US
  • A 10% Trade War Premium for the Dollar
  • It Takes Time to Rebuild Trust
  • Banks’ Unrealized Losses Increase Again
  • Lower Inventory-to-Sales Ratio for Retailers Today than in 2019

Recent Comments

No comments to show.

Archives

  • May 2025
  • April 2025
  • March 2025
  • February 2025
  • January 2025
  • December 2024
  • November 2024
  • October 2024
  • September 2024
  • August 2024
  • July 2024
  • June 2024
  • May 2024
  • April 2024
  • March 2024
  • February 2024
  • January 2024
  • December 2023
  • November 2023
  • October 2023
  • September 2023
  • August 2023
  • July 2023
  • June 2023
  • May 2023
  • April 2023
  • March 2023
  • February 2023
  • January 2023
  • December 2022
  • November 2022
  • October 2022
  • September 2022
  • August 2022
  • July 2022
  • June 2022
  • May 2022
  • April 2022
  • March 2022
  • February 2022
  • January 2022
  • December 2021
  • November 2021

Categories

  • Apollo Answers
  • Course Introductions
  • Economic Intelligence
  • Hide from Wordpress Search
  • Investment Knowledge
  • Perspectives
  • Redirecting
  • The Daily Spark
  • The View from Apollo
  • The Weekly Brief
  • Uncategorized
  • White Papers

It Has to Be a Soft Landing, Not a Reacceleration

The Fed has used the Taylor Rule framework for decades to understand what the Fed funds rate should be, and inserting the current level of inflation and unemployment into the Taylor Rule shows that the Fed funds rate today should be 9%, see chart below and our Daily Spark here.

The ongoing gap between the Fed funds rate predicted by the Taylor Rule and the actual Fed funds rate raises the question whether the Fed remains behind the curve. In other words, if the economy reaccelerates over the coming quarters with higher consumer spending and a boom in housing, it will increase the risk that the Taylor Rule was right and that the Fed will have to continue hiking. 

In sum, for markets to continue to trade higher, the soft landing must be a soft landing, not a reacceleration, because if housing and consumer spending accelerate from here, the Fed will have to raise rates a lot more.

Fed’s forecast versus the Taylor Rule
Source: Bloomberg, Fed SEP, Apollo Chief Economist. Note: Taylor Rule calculated using TAYL <GO> function on Bloomberg.

Recent Posts

  • More Than Half of Expenditures on Imports From China Stays in the US
  • A 10% Trade War Premium for the Dollar
  • It Takes Time to Rebuild Trust
  • Banks’ Unrealized Losses Increase Again
  • Lower Inventory-to-Sales Ratio for Retailers Today than in 2019

Recent Comments

No comments to show.

Archives

  • May 2025
  • April 2025
  • March 2025
  • February 2025
  • January 2025
  • December 2024
  • November 2024
  • October 2024
  • September 2024
  • August 2024
  • July 2024
  • June 2024
  • May 2024
  • April 2024
  • March 2024
  • February 2024
  • January 2024
  • December 2023
  • November 2023
  • October 2023
  • September 2023
  • August 2023
  • July 2023
  • June 2023
  • May 2023
  • April 2023
  • March 2023
  • February 2023
  • January 2023
  • December 2022
  • November 2022
  • October 2022
  • September 2022
  • August 2022
  • July 2022
  • June 2022
  • May 2022
  • April 2022
  • March 2022
  • February 2022
  • January 2022
  • December 2021
  • November 2021

Categories

  • Apollo Answers
  • Course Introductions
  • Economic Intelligence
  • Hide from Wordpress Search
  • Investment Knowledge
  • Perspectives
  • Redirecting
  • The Daily Spark
  • The View from Apollo
  • The Weekly Brief
  • Uncategorized
  • White Papers

Labor Market Softening Continues as a Result of Fed Hikes

Fed hikes continue to slow down hiring for both small firms and for the broader economy, see charts below. The labor market is softening with hours worked, the number of job openings, and the quits rate all declining.

This is how monetary policy works; higher costs of capital slow down capex spending and hiring, and with rates staying at these levels for a couple of years, this process is going to continue.

That is why the consensus expects negative nonfarm payrolls for six months from October 2023 to March 2024.

The share of small businesses planning to increase hiring
Source: NFIB, Haver Analytics, Apollo Chief Economist
Employment growth keeps slowing
Source: BLS, Haver Analytics, Apollo Chief Economist

Recent Posts

  • More Than Half of Expenditures on Imports From China Stays in the US
  • A 10% Trade War Premium for the Dollar
  • It Takes Time to Rebuild Trust
  • Banks’ Unrealized Losses Increase Again
  • Lower Inventory-to-Sales Ratio for Retailers Today than in 2019

Recent Comments

No comments to show.

Archives

  • May 2025
  • April 2025
  • March 2025
  • February 2025
  • January 2025
  • December 2024
  • November 2024
  • October 2024
  • September 2024
  • August 2024
  • July 2024
  • June 2024
  • May 2024
  • April 2024
  • March 2024
  • February 2024
  • January 2024
  • December 2023
  • November 2023
  • October 2023
  • September 2023
  • August 2023
  • July 2023
  • June 2023
  • May 2023
  • April 2023
  • March 2023
  • February 2023
  • January 2023
  • December 2022
  • November 2022
  • October 2022
  • September 2022
  • August 2022
  • July 2022
  • June 2022
  • May 2022
  • April 2022
  • March 2022
  • February 2022
  • January 2022
  • December 2021
  • November 2021

Categories

  • Apollo Answers
  • Course Introductions
  • Economic Intelligence
  • Hide from Wordpress Search
  • Investment Knowledge
  • Perspectives
  • Redirecting
  • The Daily Spark
  • The View from Apollo
  • The Weekly Brief
  • Uncategorized
  • White Papers

The Impact of Fed Hikes on Loans

Since the Fed started raising interest rates, we have seen an increase in downgrades of loans and a rise in the share of loans trading at distressed levels, i.e. below 80, see charts below. This is the monetary policy transmission mechanism at work; higher costs of capital are having a negative impact on the economy.

Downgrades for leveraged loans have increased since the Fed started hiking
Source: Pitchbook LCD
Distressed ratio for leveraged loans has risen since the Fed started hiking
Source: Pitchbook LCD, Apollo Chief Economist. Note: For percent loans priced below 80.

Recent Posts

  • More Than Half of Expenditures on Imports From China Stays in the US
  • A 10% Trade War Premium for the Dollar
  • It Takes Time to Rebuild Trust
  • Banks’ Unrealized Losses Increase Again
  • Lower Inventory-to-Sales Ratio for Retailers Today than in 2019

Recent Comments

No comments to show.

Archives

  • May 2025
  • April 2025
  • March 2025
  • February 2025
  • January 2025
  • December 2024
  • November 2024
  • October 2024
  • September 2024
  • August 2024
  • July 2024
  • June 2024
  • May 2024
  • April 2024
  • March 2024
  • February 2024
  • January 2024
  • December 2023
  • November 2023
  • October 2023
  • September 2023
  • August 2023
  • July 2023
  • June 2023
  • May 2023
  • April 2023
  • March 2023
  • February 2023
  • January 2023
  • December 2022
  • November 2022
  • October 2022
  • September 2022
  • August 2022
  • July 2022
  • June 2022
  • May 2022
  • April 2022
  • March 2022
  • February 2022
  • January 2022
  • December 2021
  • November 2021

Categories

  • Apollo Answers
  • Course Introductions
  • Economic Intelligence
  • Hide from Wordpress Search
  • Investment Knowledge
  • Perspectives
  • Redirecting
  • The Daily Spark
  • The View from Apollo
  • The Weekly Brief
  • Uncategorized
  • White Papers

A Default Cycle Has Started

Markets are not taking the ongoing rise in default rates for HY and loans seriously, see charts below, and many investors argue that “this is just a normalization,” or “these are companies nobody has heard about.”

The reality is that more and more companies are defaulting because the cost of capital is higher, and Fed Chair Powell says that interest rates will stay at these levels “for a couple of years,” so tight monetary policy will continue to have a greater negative effect on the economy and capital markets.

In fact, higher costs of capital is precisely how monetary policy works: By making it more difficult to get financing.

In other words, Fed hikes are biting harder and harder, and all investors should have a view on how high they think default rates will go during this cycle, see again charts below.

What could be the aha moment in markets? Once there is a default by some household name in credit, we will likely see an overnight change in market sentiment from bullish to bearish.

A default cycle has started, and markets are not paying attention
Source: Moody’s Analytics, Apollo Chief Economist
Leveraged loan index default rates starting to rise
Source: Pitchbook LCD, Apollo Chief Economist

Recent Posts

  • More Than Half of Expenditures on Imports From China Stays in the US
  • A 10% Trade War Premium for the Dollar
  • It Takes Time to Rebuild Trust
  • Banks’ Unrealized Losses Increase Again
  • Lower Inventory-to-Sales Ratio for Retailers Today than in 2019

Recent Comments

No comments to show.

Archives

  • May 2025
  • April 2025
  • March 2025
  • February 2025
  • January 2025
  • December 2024
  • November 2024
  • October 2024
  • September 2024
  • August 2024
  • July 2024
  • June 2024
  • May 2024
  • April 2024
  • March 2024
  • February 2024
  • January 2024
  • December 2023
  • November 2023
  • October 2023
  • September 2023
  • August 2023
  • July 2023
  • June 2023
  • May 2023
  • April 2023
  • March 2023
  • February 2023
  • January 2023
  • December 2022
  • November 2022
  • October 2022
  • September 2022
  • August 2022
  • July 2022
  • June 2022
  • May 2022
  • April 2022
  • March 2022
  • February 2022
  • January 2022
  • December 2021
  • November 2021

Categories

  • Apollo Answers
  • Course Introductions
  • Economic Intelligence
  • Hide from Wordpress Search
  • Investment Knowledge
  • Perspectives
  • Redirecting
  • The Daily Spark
  • The View from Apollo
  • The Weekly Brief
  • Uncategorized
  • White Papers

Global Coal Consumption

China accounts for more than 50% of global coal consumption, see chart below.

China is the world’s largest consumer of coal
Source: BP, Bloomberg, Apollo Chief Economist

Recent Posts

  • More Than Half of Expenditures on Imports From China Stays in the US
  • A 10% Trade War Premium for the Dollar
  • It Takes Time to Rebuild Trust
  • Banks’ Unrealized Losses Increase Again
  • Lower Inventory-to-Sales Ratio for Retailers Today than in 2019

Recent Comments

No comments to show.

Archives

  • May 2025
  • April 2025
  • March 2025
  • February 2025
  • January 2025
  • December 2024
  • November 2024
  • October 2024
  • September 2024
  • August 2024
  • July 2024
  • June 2024
  • May 2024
  • April 2024
  • March 2024
  • February 2024
  • January 2024
  • December 2023
  • November 2023
  • October 2023
  • September 2023
  • August 2023
  • July 2023
  • June 2023
  • May 2023
  • April 2023
  • March 2023
  • February 2023
  • January 2023
  • December 2022
  • November 2022
  • October 2022
  • September 2022
  • August 2022
  • July 2022
  • June 2022
  • May 2022
  • April 2022
  • March 2022
  • February 2022
  • January 2022
  • December 2021
  • November 2021

Categories

  • Apollo Answers
  • Course Introductions
  • Economic Intelligence
  • Hide from Wordpress Search
  • Investment Knowledge
  • Perspectives
  • Redirecting
  • The Daily Spark
  • The View from Apollo
  • The Weekly Brief
  • Uncategorized
  • White Papers

Higher Jobless Claims

The economy continues to gradually slow down as the impacts of the Federal Reserve’s interest rate hikes ripple through—with increasing effects on consumers, capex spending, and corporate financings. Several leading indicators (from small business hiring plans, Google searches, to WARN notices) tell us that jobless claims are inching upwards. This week, we’ll be closely tracking the FOMC meeting during which the Fed is expected to hike interest rates by 25 basis points. Given that inflation is trending downwards and growth is slowing, it will be particularly interesting to hear what Chairman Jerome Powell says about the September forward guidance.


This presentation may not be distributed, transmitted or otherwise communicated to others in whole or in part without the express consent of Apollo Global Management, Inc. (together with its subsidiaries, “Apollo”).  

Apollo makes no representation or warranty, expressed or implied, with respect to the accuracy, reasonableness, or completeness of any of the statements made during this presentation, including, but not limited to, statements obtained from third parties. Opinions, estimates and projections constitute the current judgment of the speaker as of the date indicated. They do not necessarily reflect the views and opinions of Apollo and are subject to change at any time without notice. Apollo does not have any responsibility to update this presentation to account for such changes. There can be no assurance that any trends discussed during this presentation will continue.   

Statements made throughout this presentation are not intended to provide, and should not be relied upon for, accounting, legal or tax advice and do not constitute an investment recommendation or investment advice. Investors should make an independent investigation of the information discussed during this presentation, including consulting their tax, legal, accounting or other advisors about such information. Apollo does not act for you and is not responsible for providing you with the protections afforded to its clients. This presentation does not constitute an offer to sell, or the solicitation of an offer to buy, any security, product or service, including interest in any investment product or fund or account managed or advised by Apollo. 

Certain statements made throughout this presentation may be “forward-looking” in nature. Due to various risks and uncertainties, actual events or results may differ materially from those reflected or contemplated in such forward-looking information. As such, undue reliance should not be placed on such statements. Forward-looking statements may be identified by the use of terminology including, but not limited to, “may”, “will”, “should”, “expect”, “anticipate”, “target”, “project”, “estimate”, “intend”, “continue” or “believe” or the negatives thereof or other variations thereon or comparable terminology.

Recent Posts

  • More Than Half of Expenditures on Imports From China Stays in the US
  • A 10% Trade War Premium for the Dollar
  • It Takes Time to Rebuild Trust
  • Banks’ Unrealized Losses Increase Again
  • Lower Inventory-to-Sales Ratio for Retailers Today than in 2019

Recent Comments

No comments to show.

Archives

  • May 2025
  • April 2025
  • March 2025
  • February 2025
  • January 2025
  • December 2024
  • November 2024
  • October 2024
  • September 2024
  • August 2024
  • July 2024
  • June 2024
  • May 2024
  • April 2024
  • March 2024
  • February 2024
  • January 2024
  • December 2023
  • November 2023
  • October 2023
  • September 2023
  • August 2023
  • July 2023
  • June 2023
  • May 2023
  • April 2023
  • March 2023
  • February 2023
  • January 2023
  • December 2022
  • November 2022
  • October 2022
  • September 2022
  • August 2022
  • July 2022
  • June 2022
  • May 2022
  • April 2022
  • March 2022
  • February 2022
  • January 2022
  • December 2021
  • November 2021

Categories

  • Apollo Answers
  • Course Introductions
  • Economic Intelligence
  • Hide from Wordpress Search
  • Investment Knowledge
  • Perspectives
  • Redirecting
  • The Daily Spark
  • The View from Apollo
  • The Weekly Brief
  • Uncategorized
  • White Papers

Posts navigation

Page 1 Page 2 … Page 4 Next page→
  • Privacy Notice
  • Terms of Use
  • Forward-Looking Statements
Apollo
© Apollo Global Management, Inc. 2025 All Rights Reserved.

The Apollo Academy is for informational and educational purposes only and nothing contained herein should be taken as investment advice or a recommendation to enter into any transaction. They are not an invitation by or on behalf of Apollo to any person to buy or sell any security or to adopt any investment strategy, and shall not form the basis of, nor may it accompany nor form part of, any right or contract to buy or sell any security or to adopt any investment strategy. There is no guarantee that the views and opinions expressed in this website will come to pass. For additional information, please see the disclaimers included in each piece of content or the legal page of our website here.