• Apollo.com
  • Login
  • Register Now
light site-logo
  • The Academy
  • Upcoming Events
        • Upcoming Events

        • Hybrid Investments: Flexible Structures for Volatile TimesThursday, May 29, 2025 • 11:00AM ET
  • Learning Center
        • New & UpdatedAlternative Investing Course 2.0

        • Alternative Investing Essentials Part OnePrivate Equity, Venture Capital, Private Credit
        • Alternative Investing Essentials Part TwoReal Estate, Infrastructure, Digital Assets, Hedge Funds
        • Practical ConsiderationsAsset Allocation, Risk Considerations, Fund Structures, Fees
        • Introductory Videos

          View All Videos

        •  Recent Classes & Videos

        • • Private Credit Investing in Volatile Times
        • • Potential Implications of the Latest US Administration Policy Proposals
        • • Beyond 60/40: Private Assets in an Era of High Public Valuations
        • • Investment Grade Private Credit as a Core Fixed Income Allocation
        • • 2025 Economic Outlook: Firing on All Cylinders
        • • Building the Future: Understanding the Tailwinds Behind Infrastructure Investing
        • View All Classes

  • Alternative Perspectives
        • Investment Knowledge
        • The View from Apollo
          • Investment Knowledge White Papers

            Beyond 60/40: Private Assets in an Era of High Public Valuations

            March 21, 2025
          • The View From Apollo

            Private Credit Investing in Volatile Times

            May 9, 2025
          • Investment Knowledge

            Apollo Answers: What Is PIK?

            March 19, 2025
  • The Daily Spark
        • Read The Daily Spark Blog


        • Want it delivered daily to your inbox?
          • The Daily Spark

            More Than Half of Expenditures on Imports From China Stays in the US

            May 15, 2025
          • The Daily Spark

            A 10% Trade War Premium for the Dollar

            May 14, 2025
          • The Daily Spark

            It Takes Time to Rebuild Trust

            May 13, 2025
  • Register for Apollo Academy: Alternative Investing Course
  • Login
  • About Apollo Academy
  • Upcoming Events
  • Learning Center
  • Alternative Perspectives
  • The Daily Spark
  • Register for Apollo Academy: Alternative Investing Course
  • Login
  • Private Credit Investing in Volatile Times
    Tuesday, April 29, 2025 • 11:00am ET
  • Alternative Investing Course 2.0
  • Potential Implications of the Latest US Administration Policy Proposals
  • Beyond 60/40: Private Assets in an Era of Soaring Public Valuations
  • Investment Grade Private Credit as a Core Fixed Income Allocation
  • 2025 Economic Outlook: Where’s the Slowdown?
  • Building the Future: Understanding the Tailwinds Behind Infrastructure Investing
  • Clean Transition Investing: Going Where the Opportunities Are
  • View All Classes
  • Introductory Videos
  • Alternative Investing Essentials Part One • Now Available On Demand
  • Alternative Investing Essentials Part Two • Now Available On Demand
  • Practical Considerations • Now Available On Demand
  • Investment Knowledge
  • The View from Apollo
Home September 2023

The Outlook for the 60/40 Portfolio

There is something weird going on in US government bond markets, and the relentless increase in long-term interest rates is quite ominous for the economy, and perhaps also for financial stability. 

We are late in the cycle, and Fed hikes are biting harder and harder on consumers and firms. Stock markets see the negative effects of tighter monetary policy, and equities are trading lower. But long-term interest rates should be going down, not up.

So what is going on?

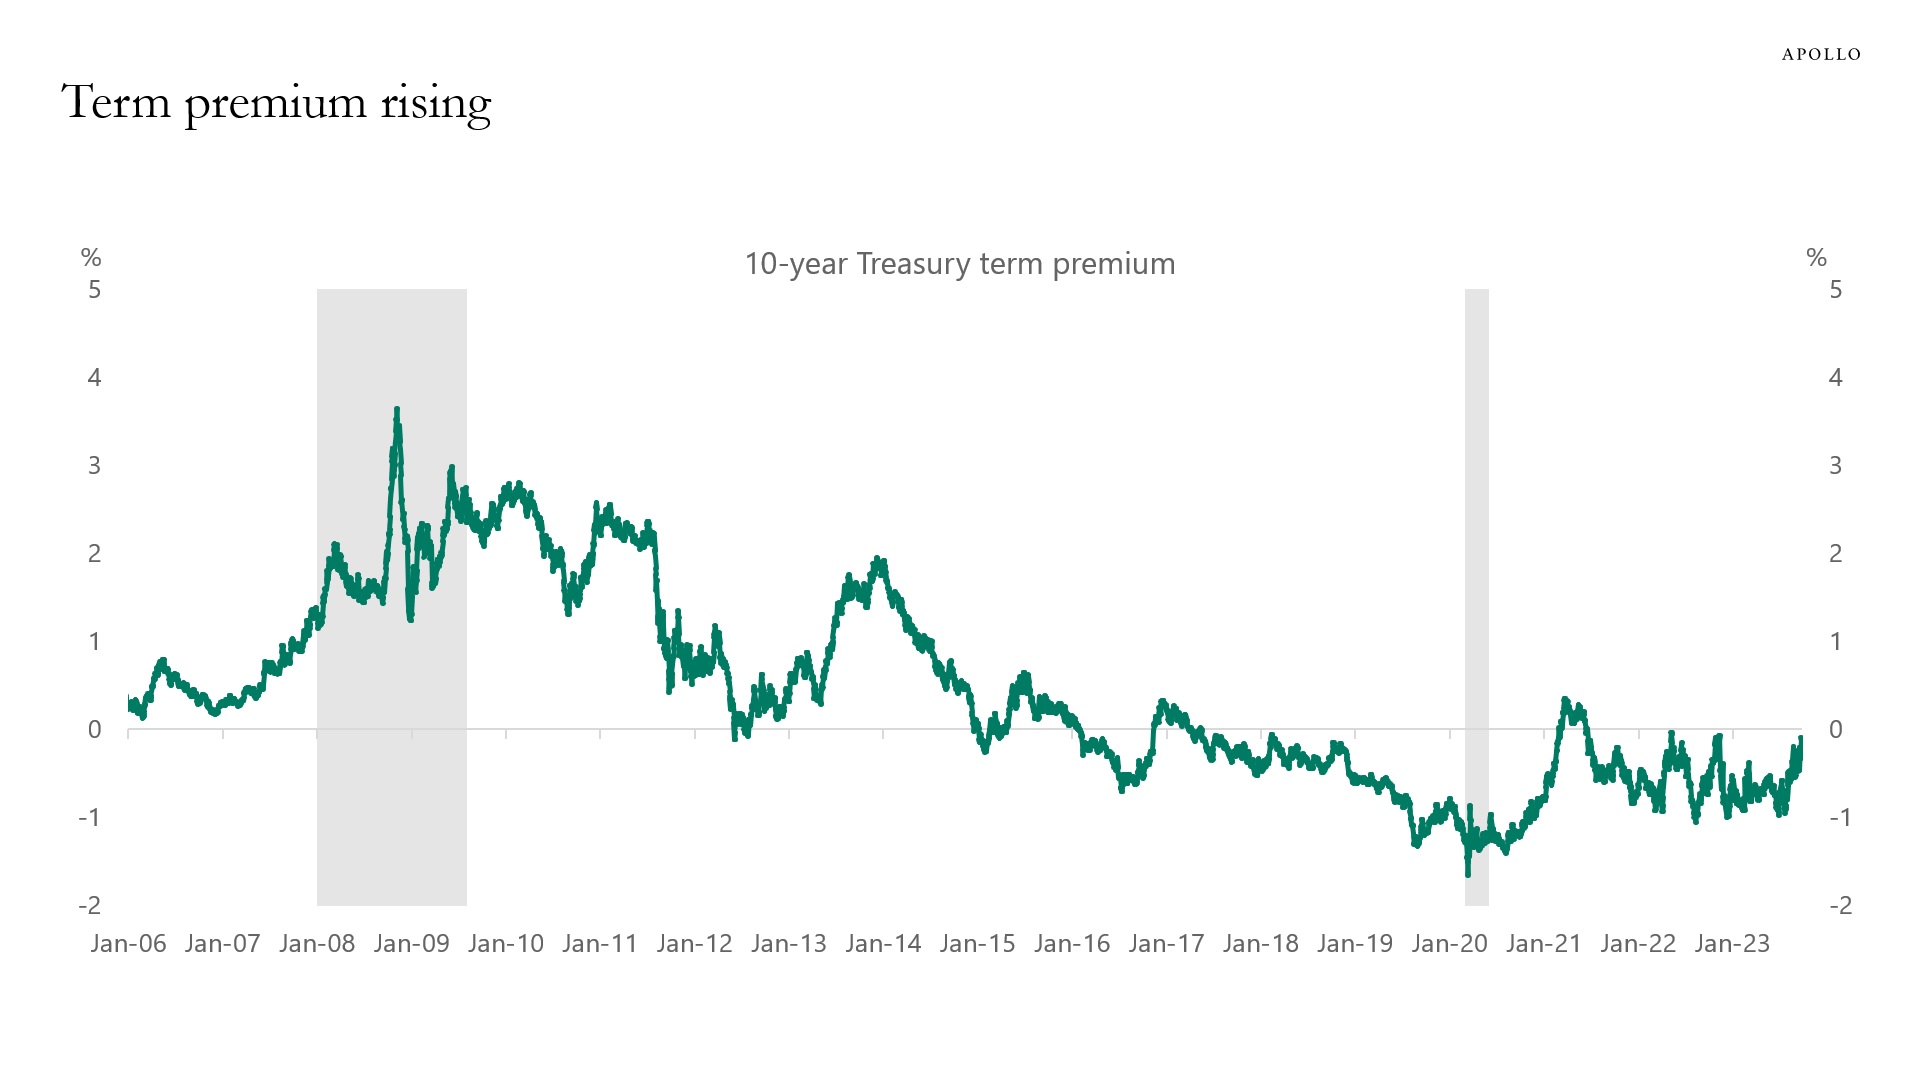
With the term premium accounting for the entire move in long rates since July, we know that the source of higher long-term interest rates is not Fed expectations.

If the move is not driven by changing Fed expectations, what are then the reasons why long rates are moving higher? There are several potential explanations:

1) First, with declining repo it could be an unwind of the basis trade that is pushing long rates higher, somewhat similar to what happened in March 2020. This has been getting a lot of attention, and maybe conditions for getting repo are tightening.

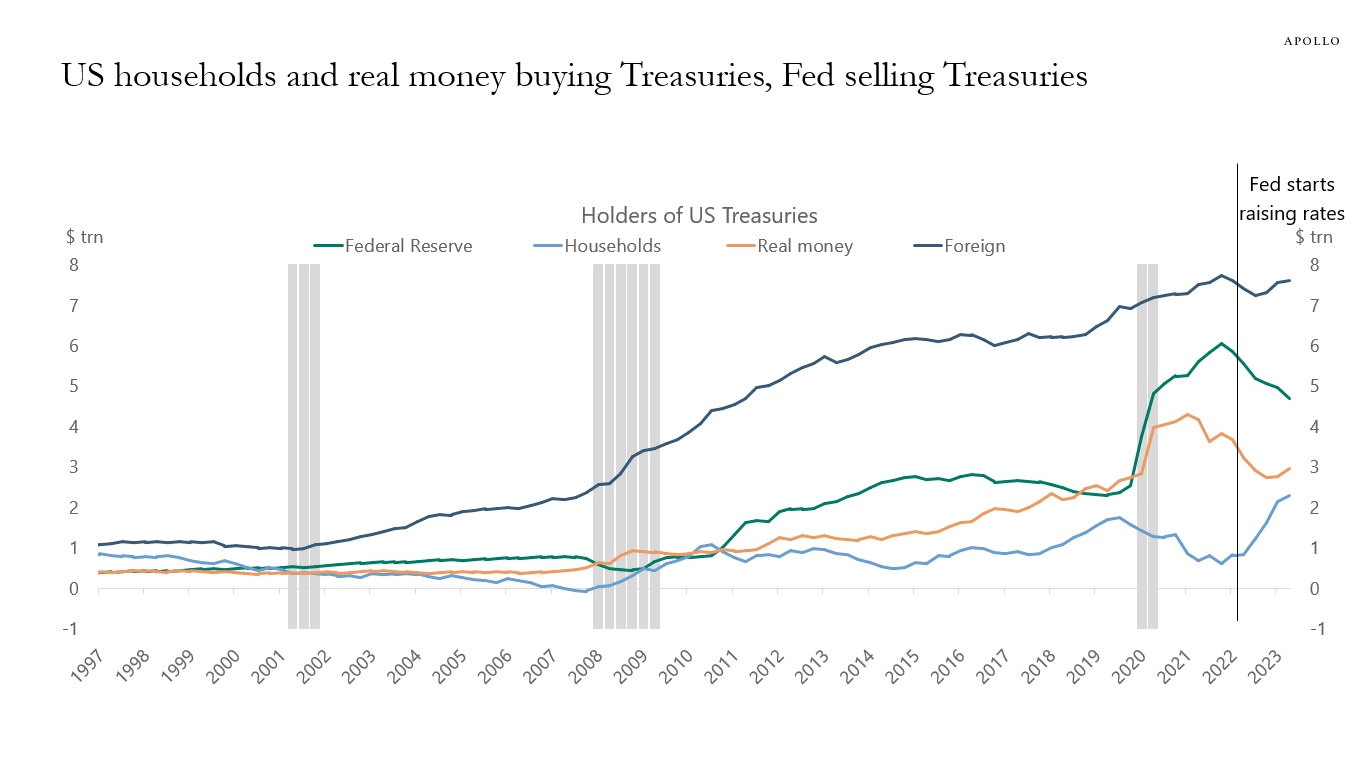
2) Another potential explanation is the slowing growth in China, which means that China is recycling fewer dollars into Treasuries because of declining Chinese exports.

3) Rates may also be moving higher because of the Fed still doing QT. Remember, the entire goal with QT is to put upward pressure on government bond yields.

4) The US budget deficit remains big at 6% of GDP, which requires more Treasury issuance today and in the future, and investors may be reacting to that.

5) The US sovereign downgrade has likely had a negative impact.

6) Japan exiting YCC has put upward pressure on JGB yields, which, despite high hedging costs, makes US yields less attractive.

7) There is a large stock of T-bills outstanding, and the Treasury intends over the next six months to increase auction sizes across the Treasury curve.

No matter which explanation is more important, it is clear that the spike in rates is having a very negative impact on consumers and firms, and the risks of a hard landing are intensifying.

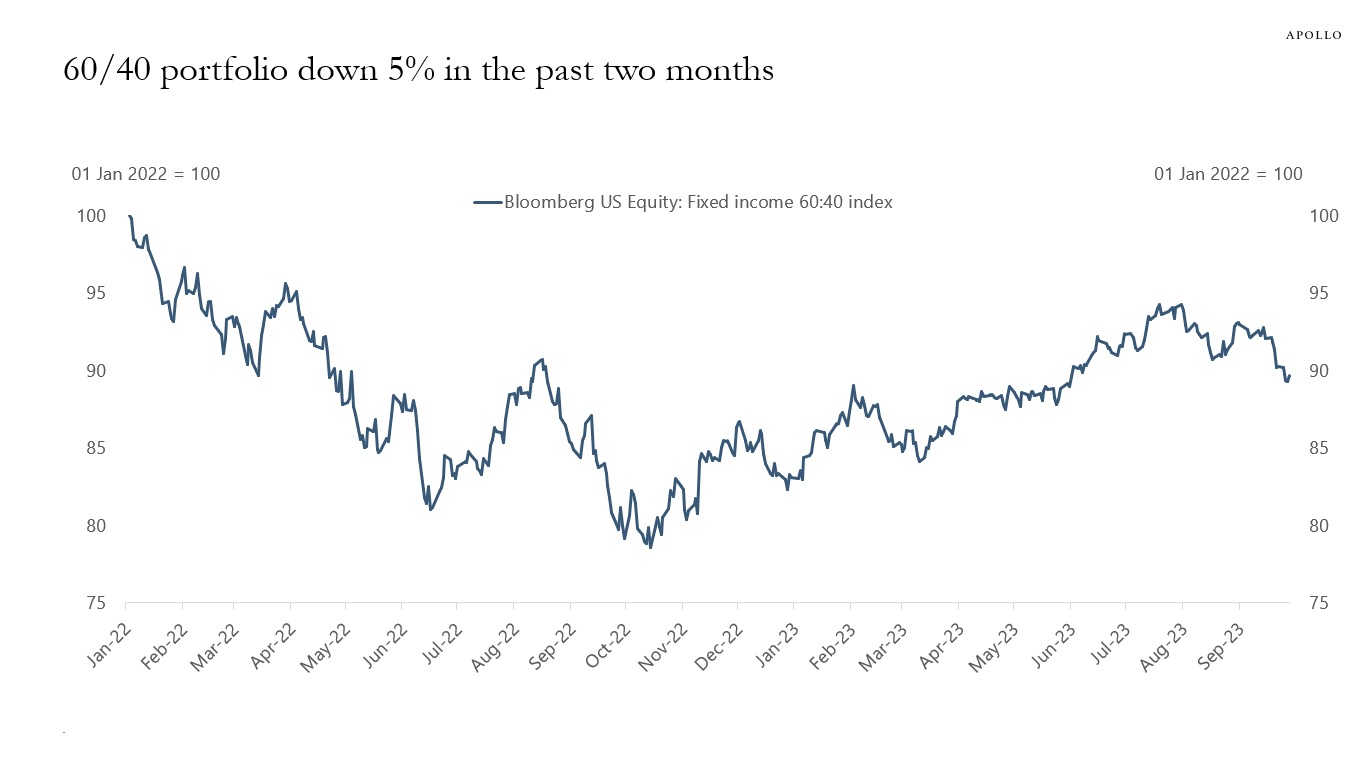
For investors in the 60/40 portfolio, the ongoing volatility in a high rates environment is stomach-churning, see chart below. Over the past two months, the 60/40 portfolio has lost 5%, and with an outlook of high rates and slowing earnings—which is needed to get inflation under control—the outlook for the 60/40 portfolio remains negative.

60/40 portfolio down 5% in the past two months
Source: Bloomberg, Apollo Chief Economist. The Bloomberg US BMA6040 Index rebalances monthly to 60% equities and 40% fixed income.

Recent Posts

  • More Than Half of Expenditures on Imports From China Stays in the US
  • A 10% Trade War Premium for the Dollar
  • It Takes Time to Rebuild Trust
  • Banks’ Unrealized Losses Increase Again
  • Lower Inventory-to-Sales Ratio for Retailers Today than in 2019

Recent Comments

No comments to show.

Archives

  • May 2025
  • April 2025
  • March 2025
  • February 2025
  • January 2025
  • December 2024
  • November 2024
  • October 2024
  • September 2024
  • August 2024
  • July 2024
  • June 2024
  • May 2024
  • April 2024
  • March 2024
  • February 2024
  • January 2024
  • December 2023
  • November 2023
  • October 2023
  • September 2023
  • August 2023
  • July 2023
  • June 2023
  • May 2023
  • April 2023
  • March 2023
  • February 2023
  • January 2023
  • December 2022
  • November 2022
  • October 2022
  • September 2022
  • August 2022
  • July 2022
  • June 2022
  • May 2022
  • April 2022
  • March 2022
  • February 2022
  • January 2022
  • December 2021
  • November 2021

Categories

  • Apollo Answers
  • Course Introductions
  • Economic Intelligence
  • Hide from Wordpress Search
  • Investment Knowledge
  • Perspectives
  • Redirecting
  • The Daily Spark
  • The View from Apollo
  • The Weekly Brief
  • Uncategorized
  • White Papers

Comparing Public and Private Markets

There is $130 trillion in global fixed income outstanding, see chart below.

The total market cap of global equity markets is $101 trillion.

The total value of all assets in the global banking sector is $98 trillion.

And total global private capital AUM is $13 trillion.

The first conclusion is that private capital makes up less than 5% of global financing markets.

Over the past decade, global fixed income markets have increased $42 trillion, the global equity market cap has increased $35 trillion, global assets on banking sector balance sheets have increased by $34 trillion, and the global amount of private capital AUM has increased $8 trillion, see charts below.

The second conclusion is that private capital has over the past decade grown much slower than global financing markets.

The bottom line is that the alternatives industry is small, and has over the past decade grown much slower than the rest of the financial system.

Our latest outlook for private markets is available here.

Source: SIFMA, BIS, Pitchbook, Apollo Chief Economist. Note: Data as of 2022 and 2023Q2 (BIS data).
Source: SIFMA, BIS, Pitchbook, Apollo Chief Economist
Source: SIFMA, Apollo Chief Economist
Source: BIS, Haver Analytics, Apollo Chief Economist
Source: Pitchbook, Apollo Chief Economist. Note: Data as of 31st December 2022.

Recent Posts

  • More Than Half of Expenditures on Imports From China Stays in the US
  • A 10% Trade War Premium for the Dollar
  • It Takes Time to Rebuild Trust
  • Banks’ Unrealized Losses Increase Again
  • Lower Inventory-to-Sales Ratio for Retailers Today than in 2019

Recent Comments

No comments to show.

Archives

  • May 2025
  • April 2025
  • March 2025
  • February 2025
  • January 2025
  • December 2024
  • November 2024
  • October 2024
  • September 2024
  • August 2024
  • July 2024
  • June 2024
  • May 2024
  • April 2024
  • March 2024
  • February 2024
  • January 2024
  • December 2023
  • November 2023
  • October 2023
  • September 2023
  • August 2023
  • July 2023
  • June 2023
  • May 2023
  • April 2023
  • March 2023
  • February 2023
  • January 2023
  • December 2022
  • November 2022
  • October 2022
  • September 2022
  • August 2022
  • July 2022
  • June 2022
  • May 2022
  • April 2022
  • March 2022
  • February 2022
  • January 2022
  • December 2021
  • November 2021

Categories

  • Apollo Answers
  • Course Introductions
  • Economic Intelligence
  • Hide from Wordpress Search
  • Investment Knowledge
  • Perspectives
  • Redirecting
  • The Daily Spark
  • The View from Apollo
  • The Weekly Brief
  • Uncategorized
  • White Papers

Why Are Long Rates Going Up?

The term premium is up one percentage point since late July, see chart below showing that the ongoing rise in long rates is driven less by changing Fed expectations and more by:

1) The US sovereign downgrade

2) Japan exiting YCC

3) Fed QT

4) Fewer dollars for China to recycle in a falling exports environment

5) The US budget deficit

6) The large stock of T-bills and the Treasury’s intention to increase auction sizes.

Looking ahead, the real risk to the economy, including financial stability, is if weak economic data doesn’t result in falling long-term interest rates. The Treasury market’s reaction to the employment report next week will be very important and likely set the tone for markets in Q4.

The 10-year T-bill's term premium is rising.
Source: Bloomberg, Apollo Chief Economist

Recent Posts

  • More Than Half of Expenditures on Imports From China Stays in the US
  • A 10% Trade War Premium for the Dollar
  • It Takes Time to Rebuild Trust
  • Banks’ Unrealized Losses Increase Again
  • Lower Inventory-to-Sales Ratio for Retailers Today than in 2019

Recent Comments

No comments to show.

Archives

  • May 2025
  • April 2025
  • March 2025
  • February 2025
  • January 2025
  • December 2024
  • November 2024
  • October 2024
  • September 2024
  • August 2024
  • July 2024
  • June 2024
  • May 2024
  • April 2024
  • March 2024
  • February 2024
  • January 2024
  • December 2023
  • November 2023
  • October 2023
  • September 2023
  • August 2023
  • July 2023
  • June 2023
  • May 2023
  • April 2023
  • March 2023
  • February 2023
  • January 2023
  • December 2022
  • November 2022
  • October 2022
  • September 2022
  • August 2022
  • July 2022
  • June 2022
  • May 2022
  • April 2022
  • March 2022
  • February 2022
  • January 2022
  • December 2021
  • November 2021

Categories

  • Apollo Answers
  • Course Introductions
  • Economic Intelligence
  • Hide from Wordpress Search
  • Investment Knowledge
  • Perspectives
  • Redirecting
  • The Daily Spark
  • The View from Apollo
  • The Weekly Brief
  • Uncategorized
  • White Papers

Eight Months from Last Fed Hike to First Fed Cut

The last Fed hike was in July.

If this was the last Fed hike during this cycle, and assuming it takes on average eight months from the last Fed hike to the first Fed cut, then the Fed will start cutting rates in March 2024, see chart below.

The big difference today is that inflation remains significantly above the FOMC’s 2% target. This may lead the Fed to keep rates high, even if the economic data starts to slow down more meaningfully.

Chart of average time from Fed hike to Fed rate cut
Source: FRB, Haver Analytics, Apollo Chief Economist. Note: Discount rate used before 1988.

Recent Posts

  • More Than Half of Expenditures on Imports From China Stays in the US
  • A 10% Trade War Premium for the Dollar
  • It Takes Time to Rebuild Trust
  • Banks’ Unrealized Losses Increase Again
  • Lower Inventory-to-Sales Ratio for Retailers Today than in 2019

Recent Comments

No comments to show.

Archives

  • May 2025
  • April 2025
  • March 2025
  • February 2025
  • January 2025
  • December 2024
  • November 2024
  • October 2024
  • September 2024
  • August 2024
  • July 2024
  • June 2024
  • May 2024
  • April 2024
  • March 2024
  • February 2024
  • January 2024
  • December 2023
  • November 2023
  • October 2023
  • September 2023
  • August 2023
  • July 2023
  • June 2023
  • May 2023
  • April 2023
  • March 2023
  • February 2023
  • January 2023
  • December 2022
  • November 2022
  • October 2022
  • September 2022
  • August 2022
  • July 2022
  • June 2022
  • May 2022
  • April 2022
  • March 2022
  • February 2022
  • January 2022
  • December 2021
  • November 2021

Categories

  • Apollo Answers
  • Course Introductions
  • Economic Intelligence
  • Hide from Wordpress Search
  • Investment Knowledge
  • Perspectives
  • Redirecting
  • The Daily Spark
  • The View from Apollo
  • The Weekly Brief
  • Uncategorized
  • White Papers

High Interest Rates Pressuring VC

The index of VC-backed IPOs is down 50% since last year when the Fed started raising interest rates, see chart below.

Similarly, Nasdaq 100 and Russell 2000 Growth are down 10% and 20%, respectively.

With interest rates permanently higher, venture capital and growth will likely continue to underperform.

VC-backed new issues are down sharply
Source: Pitchbook, Apollo Chief Economist

Recent Posts

  • More Than Half of Expenditures on Imports From China Stays in the US
  • A 10% Trade War Premium for the Dollar
  • It Takes Time to Rebuild Trust
  • Banks’ Unrealized Losses Increase Again
  • Lower Inventory-to-Sales Ratio for Retailers Today than in 2019

Recent Comments

No comments to show.

Archives

  • May 2025
  • April 2025
  • March 2025
  • February 2025
  • January 2025
  • December 2024
  • November 2024
  • October 2024
  • September 2024
  • August 2024
  • July 2024
  • June 2024
  • May 2024
  • April 2024
  • March 2024
  • February 2024
  • January 2024
  • December 2023
  • November 2023
  • October 2023
  • September 2023
  • August 2023
  • July 2023
  • June 2023
  • May 2023
  • April 2023
  • March 2023
  • February 2023
  • January 2023
  • December 2022
  • November 2022
  • October 2022
  • September 2022
  • August 2022
  • July 2022
  • June 2022
  • May 2022
  • April 2022
  • March 2022
  • February 2022
  • January 2022
  • December 2021
  • November 2021

Categories

  • Apollo Answers
  • Course Introductions
  • Economic Intelligence
  • Hide from Wordpress Search
  • Investment Knowledge
  • Perspectives
  • Redirecting
  • The Daily Spark
  • The View from Apollo
  • The Weekly Brief
  • Uncategorized
  • White Papers

Europe in Stagflation

Consensus expectations show that the market is expecting Europe to be in stagflation in 2023 and in 2024, see charts below.

The classic textbook response to stagflation by the central bank is to keep interest rates high until inflation is under control and then wait for growth to eventually restart.

This is also what we should be expecting from the ECB. The implication for markets is high short rates and low growth in earnings.

Consensus expects stagflation for Europe in 2023
Source: Bloomberg, Apollo Chief Economist
Consensus expects stagflation for Europe in 2024
Source: Bloomberg, Apollo Chief Economist

Recent Posts

  • More Than Half of Expenditures on Imports From China Stays in the US
  • A 10% Trade War Premium for the Dollar
  • It Takes Time to Rebuild Trust
  • Banks’ Unrealized Losses Increase Again
  • Lower Inventory-to-Sales Ratio for Retailers Today than in 2019

Recent Comments

No comments to show.

Archives

  • May 2025
  • April 2025
  • March 2025
  • February 2025
  • January 2025
  • December 2024
  • November 2024
  • October 2024
  • September 2024
  • August 2024
  • July 2024
  • June 2024
  • May 2024
  • April 2024
  • March 2024
  • February 2024
  • January 2024
  • December 2023
  • November 2023
  • October 2023
  • September 2023
  • August 2023
  • July 2023
  • June 2023
  • May 2023
  • April 2023
  • March 2023
  • February 2023
  • January 2023
  • December 2022
  • November 2022
  • October 2022
  • September 2022
  • August 2022
  • July 2022
  • June 2022
  • May 2022
  • April 2022
  • March 2022
  • February 2022
  • January 2022
  • December 2021
  • November 2021

Categories

  • Apollo Answers
  • Course Introductions
  • Economic Intelligence
  • Hide from Wordpress Search
  • Investment Knowledge
  • Perspectives
  • Redirecting
  • The Daily Spark
  • The View from Apollo
  • The Weekly Brief
  • Uncategorized
  • White Papers

Europe in Stagflation

At last week’s FOMC meeting, the Federal Reserve decided to keep interest rate increases on hold. But what was more important was what they said about the future, which is to expect more rate hikes in 2023 and fewer rate cuts in 2024. This was clearly a hawkish message and implies that the cost of capital will stay higher for longer. Broadening out our scope and looking at Europe, the inflation forecasts there have been going up and the growth forecasts have been trending downwards—for both 2023 and 2024. This brings us to the conclusion that Europe is in stagflation. With that in mind, the ECB is expected to keep interest rates high to get inflation under control, which will continue to pose downside risks to growth.


This presentation may not be distributed, transmitted or otherwise communicated to others in whole or in part without the express consent of Apollo Global Management, Inc. (together with its subsidiaries, “Apollo”).  

Apollo makes no representation or warranty, expressed or implied, with respect to the accuracy, reasonableness, or completeness of any of the statements made during this presentation, including, but not limited to, statements obtained from third parties. Opinions, estimates and projections constitute the current judgment of the speaker as of the date indicated. They do not necessarily reflect the views and opinions of Apollo and are subject to change at any time without notice. Apollo does not have any responsibility to update this presentation to account for such changes. There can be no assurance that any trends discussed during this presentation will continue.   

Statements made throughout this presentation are not intended to provide, and should not be relied upon for, accounting, legal or tax advice and do not constitute an investment recommendation or investment advice. Investors should make an independent investigation of the information discussed during this presentation, including consulting their tax, legal, accounting or other advisors about such information. Apollo does not act for you and is not responsible for providing you with the protections afforded to its clients. This presentation does not constitute an offer to sell, or the solicitation of an offer to buy, any security, product or service, including interest in any investment product or fund or account managed or advised by Apollo. 

Certain statements made throughout this presentation may be “forward-looking” in nature. Due to various risks and uncertainties, actual events or results may differ materially from those reflected or contemplated in such forward-looking information. As such, undue reliance should not be placed on such statements. Forward-looking statements may be identified by the use of terminology including, but not limited to, “may”, “will”, “should”, “expect”, “anticipate”, “target”, “project”, “estimate”, “intend”, “continue” or “believe” or the negatives thereof or other variations thereon or comparable terminology.

Recent Posts

  • More Than Half of Expenditures on Imports From China Stays in the US
  • A 10% Trade War Premium for the Dollar
  • It Takes Time to Rebuild Trust
  • Banks’ Unrealized Losses Increase Again
  • Lower Inventory-to-Sales Ratio for Retailers Today than in 2019

Recent Comments

No comments to show.

Archives

  • May 2025
  • April 2025
  • March 2025
  • February 2025
  • January 2025
  • December 2024
  • November 2024
  • October 2024
  • September 2024
  • August 2024
  • July 2024
  • June 2024
  • May 2024
  • April 2024
  • March 2024
  • February 2024
  • January 2024
  • December 2023
  • November 2023
  • October 2023
  • September 2023
  • August 2023
  • July 2023
  • June 2023
  • May 2023
  • April 2023
  • March 2023
  • February 2023
  • January 2023
  • December 2022
  • November 2022
  • October 2022
  • September 2022
  • August 2022
  • July 2022
  • June 2022
  • May 2022
  • April 2022
  • March 2022
  • February 2022
  • January 2022
  • December 2021
  • November 2021

Categories

  • Apollo Answers
  • Course Introductions
  • Economic Intelligence
  • Hide from Wordpress Search
  • Investment Knowledge
  • Perspectives
  • Redirecting
  • The Daily Spark
  • The View from Apollo
  • The Weekly Brief
  • Uncategorized
  • White Papers

Are Credit Markets Focusing on Yield Levels or Credit Fundamentals?

The CCC spread in Europe is normally very highly correlated with the CCC spread in the US. But this relationship has changed after the Fed started raising rates, see the first chart below. 

Spreads are currently pricing that Europe will have a recession with many defaults, but in the US, everything is fine. 

The rally in the US relative to the EU has happened despite the consensus seeing a 60% probability of a recession in the US over the next 12 months and only a 50% probability in Europe, see the second chart.

The bottom line is that there is an inconsistency in pricing of lower-rated corporate credit in the US and Europe. We cannot both have that everything is fine and at the same time we are going into a recession. 

The key question is why US credit has rallied so much despite the high recession probability. Given the relationship changed after the Fed started raising rates maybe the reason is what could be called a yield level illusion in US lower-rated credit, where investors focus more on the levels of yields than on the underlying fundamental credit risks of Fed hikes and permanently higher costs of capital.

In short, credit investors today should be asking themselves if spreads are focusing on yield levels or on credit fundamentals.

Lower-rated US credit is outperforming European counterparts
Source: Bloomberg, Apollo Chief Economist
US has a high probability of recession
Source: Bloomberg, Apollo Chief Economist

Recent Posts

  • More Than Half of Expenditures on Imports From China Stays in the US
  • A 10% Trade War Premium for the Dollar
  • It Takes Time to Rebuild Trust
  • Banks’ Unrealized Losses Increase Again
  • Lower Inventory-to-Sales Ratio for Retailers Today than in 2019

Recent Comments

No comments to show.

Archives

  • May 2025
  • April 2025
  • March 2025
  • February 2025
  • January 2025
  • December 2024
  • November 2024
  • October 2024
  • September 2024
  • August 2024
  • July 2024
  • June 2024
  • May 2024
  • April 2024
  • March 2024
  • February 2024
  • January 2024
  • December 2023
  • November 2023
  • October 2023
  • September 2023
  • August 2023
  • July 2023
  • June 2023
  • May 2023
  • April 2023
  • March 2023
  • February 2023
  • January 2023
  • December 2022
  • November 2022
  • October 2022
  • September 2022
  • August 2022
  • July 2022
  • June 2022
  • May 2022
  • April 2022
  • March 2022
  • February 2022
  • January 2022
  • December 2021
  • November 2021

Categories

  • Apollo Answers
  • Course Introductions
  • Economic Intelligence
  • Hide from Wordpress Search
  • Investment Knowledge
  • Perspectives
  • Redirecting
  • The Daily Spark
  • The View from Apollo
  • The Weekly Brief
  • Uncategorized
  • White Papers

S&P493 Is Basically Flat This Year

The seven biggest stocks in the S&P500 are up more than 50% in 2023, see chart below.

The remaining 493 stocks are basically flat.

The bottom line is that if you buy the S&P500 today, you are basically buying a handful of companies that make up 34% of the index and have an average P/E ratio around 50.

So far in 2023 S&P7 is up more than 50%. S&P493 is basically flat.
Source: Bloomberg, Apollo Chief Economist

Recent Posts

  • More Than Half of Expenditures on Imports From China Stays in the US
  • A 10% Trade War Premium for the Dollar
  • It Takes Time to Rebuild Trust
  • Banks’ Unrealized Losses Increase Again
  • Lower Inventory-to-Sales Ratio for Retailers Today than in 2019

Recent Comments

No comments to show.

Archives

  • May 2025
  • April 2025
  • March 2025
  • February 2025
  • January 2025
  • December 2024
  • November 2024
  • October 2024
  • September 2024
  • August 2024
  • July 2024
  • June 2024
  • May 2024
  • April 2024
  • March 2024
  • February 2024
  • January 2024
  • December 2023
  • November 2023
  • October 2023
  • September 2023
  • August 2023
  • July 2023
  • June 2023
  • May 2023
  • April 2023
  • March 2023
  • February 2023
  • January 2023
  • December 2022
  • November 2022
  • October 2022
  • September 2022
  • August 2022
  • July 2022
  • June 2022
  • May 2022
  • April 2022
  • March 2022
  • February 2022
  • January 2022
  • December 2021
  • November 2021

Categories

  • Apollo Answers
  • Course Introductions
  • Economic Intelligence
  • Hide from Wordpress Search
  • Investment Knowledge
  • Perspectives
  • Redirecting
  • The Daily Spark
  • The View from Apollo
  • The Weekly Brief
  • Uncategorized
  • White Papers

US Households Are Big Buyers of Treasuries

Since the Fed started hiking rates last year, US households have bought $1.5 trillion in Treasuries, and over the past six months, US pension and insurance have also emerged as a buyer, see chart below. Over the same period, the Fed has been doing QT and been a net seller of Treasuries. The bottom line is that US households and real money are finding current levels of US yields attractive.

US households and real money buying Treasuries, Fed selling Treasuries
Source: FFUNDS, Haver, Apollo Chief Economist

Recent Posts

  • More Than Half of Expenditures on Imports From China Stays in the US
  • A 10% Trade War Premium for the Dollar
  • It Takes Time to Rebuild Trust
  • Banks’ Unrealized Losses Increase Again
  • Lower Inventory-to-Sales Ratio for Retailers Today than in 2019

Recent Comments

No comments to show.

Archives

  • May 2025
  • April 2025
  • March 2025
  • February 2025
  • January 2025
  • December 2024
  • November 2024
  • October 2024
  • September 2024
  • August 2024
  • July 2024
  • June 2024
  • May 2024
  • April 2024
  • March 2024
  • February 2024
  • January 2024
  • December 2023
  • November 2023
  • October 2023
  • September 2023
  • August 2023
  • July 2023
  • June 2023
  • May 2023
  • April 2023
  • March 2023
  • February 2023
  • January 2023
  • December 2022
  • November 2022
  • October 2022
  • September 2022
  • August 2022
  • July 2022
  • June 2022
  • May 2022
  • April 2022
  • March 2022
  • February 2022
  • January 2022
  • December 2021
  • November 2021

Categories

  • Apollo Answers
  • Course Introductions
  • Economic Intelligence
  • Hide from Wordpress Search
  • Investment Knowledge
  • Perspectives
  • Redirecting
  • The Daily Spark
  • The View from Apollo
  • The Weekly Brief
  • Uncategorized
  • White Papers

Posts navigation

Page 1 Page 2 … Page 4 Next page→
  • Privacy Notice
  • Terms of Use
  • Forward-Looking Statements
Apollo
© Apollo Global Management, Inc. 2025 All Rights Reserved.

The Apollo Academy is for informational and educational purposes only and nothing contained herein should be taken as investment advice or a recommendation to enter into any transaction. They are not an invitation by or on behalf of Apollo to any person to buy or sell any security or to adopt any investment strategy, and shall not form the basis of, nor may it accompany nor form part of, any right or contract to buy or sell any security or to adopt any investment strategy. There is no guarantee that the views and opinions expressed in this website will come to pass. For additional information, please see the disclaimers included in each piece of content or the legal page of our website here.