The distribution of P/E ratios for the S&P 500 shows that stocks today are more overvalued than they were in March 2000, see chart below.
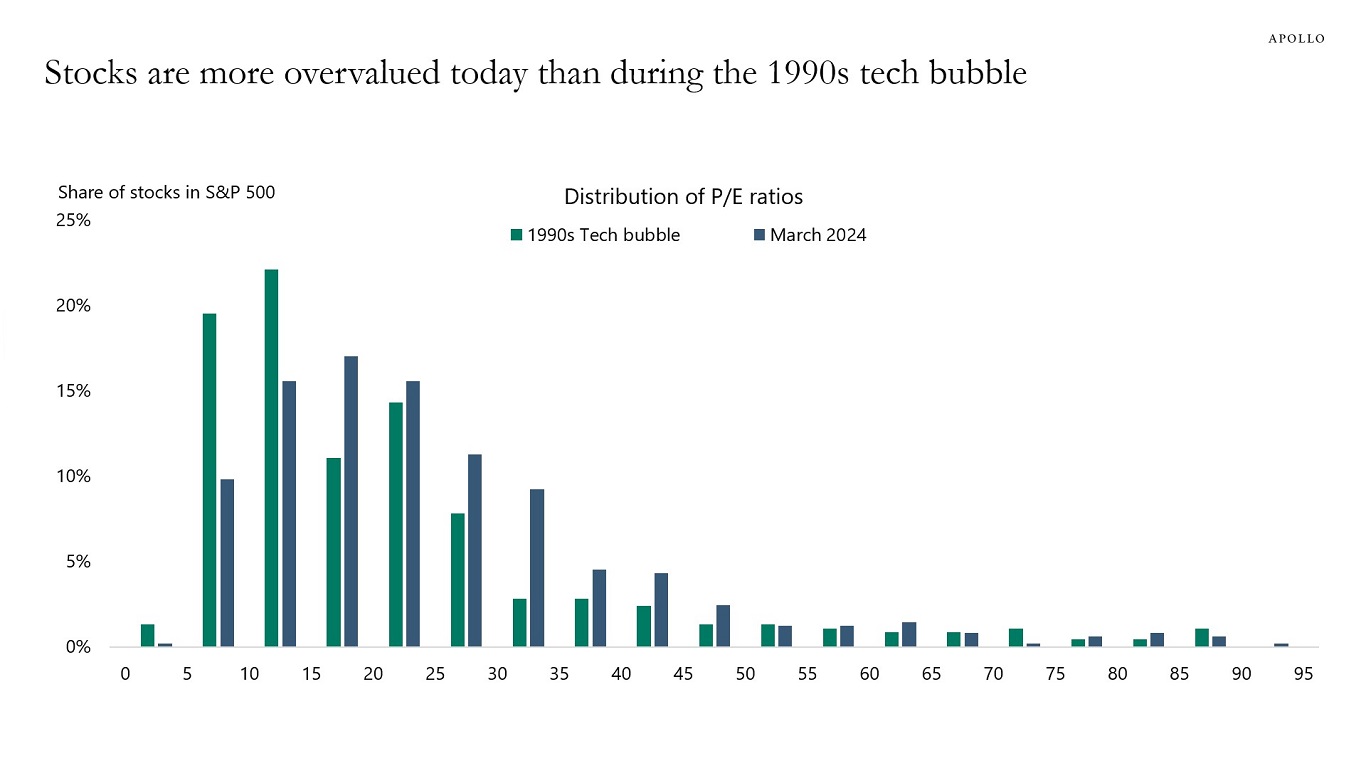


The distribution of P/E ratios for the S&P 500 shows that stocks today are more overvalued than they were in March 2000, see chart below.
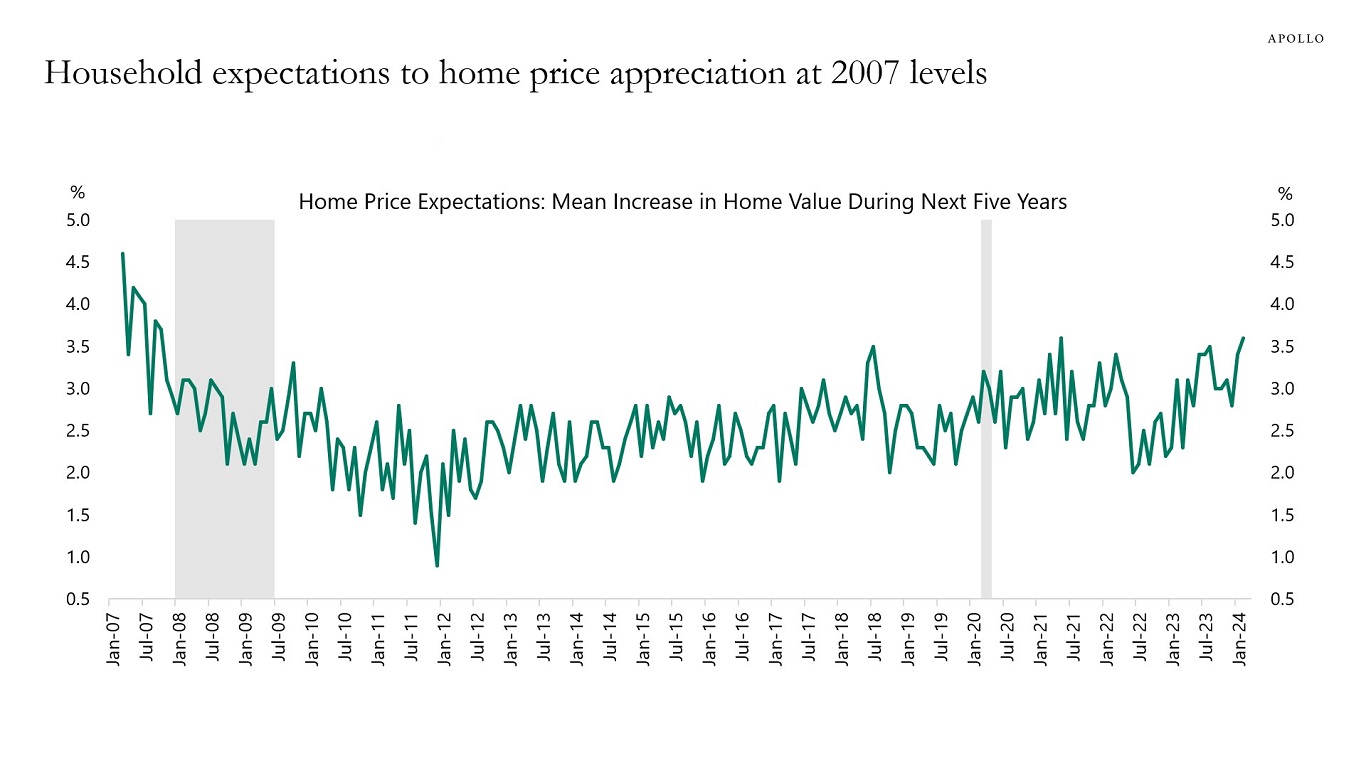
Household expectations to future home price appreciation are currently at the highest level since 2007, see chart below.
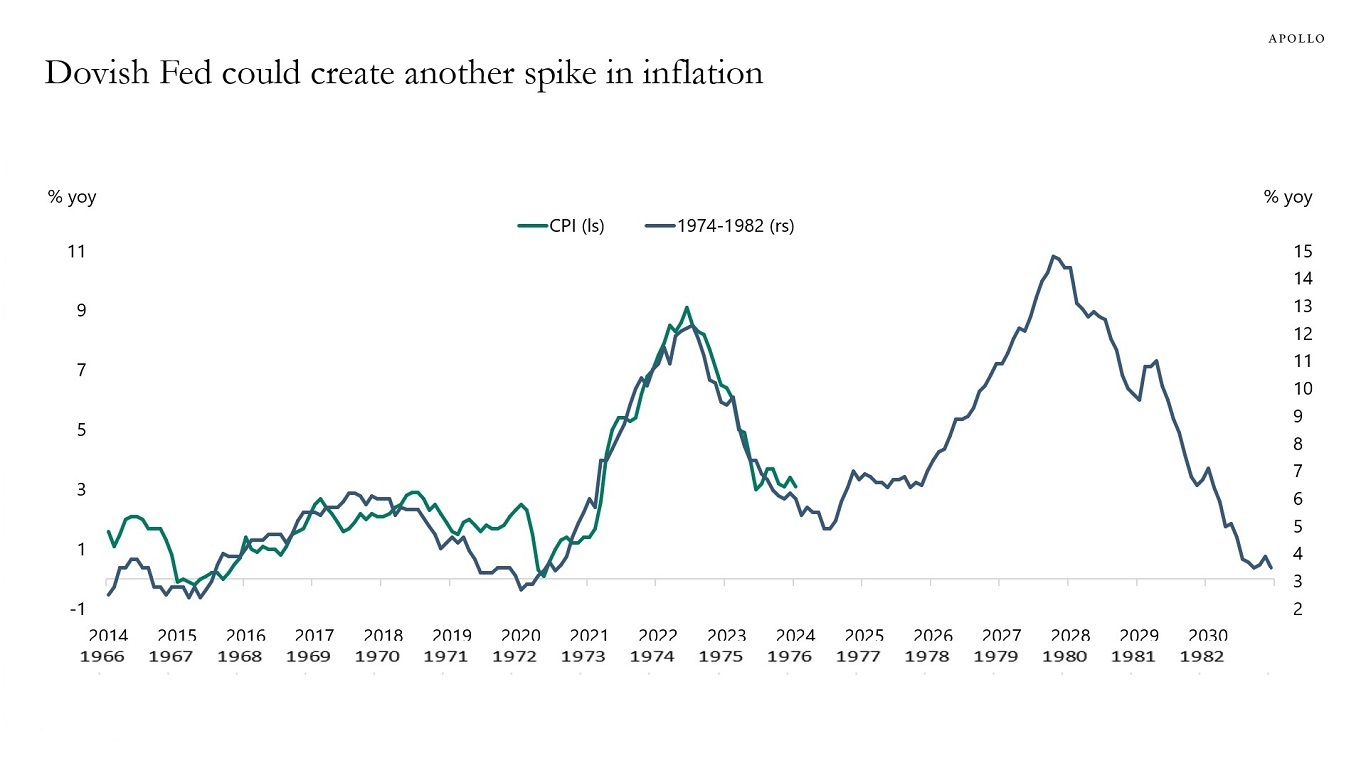
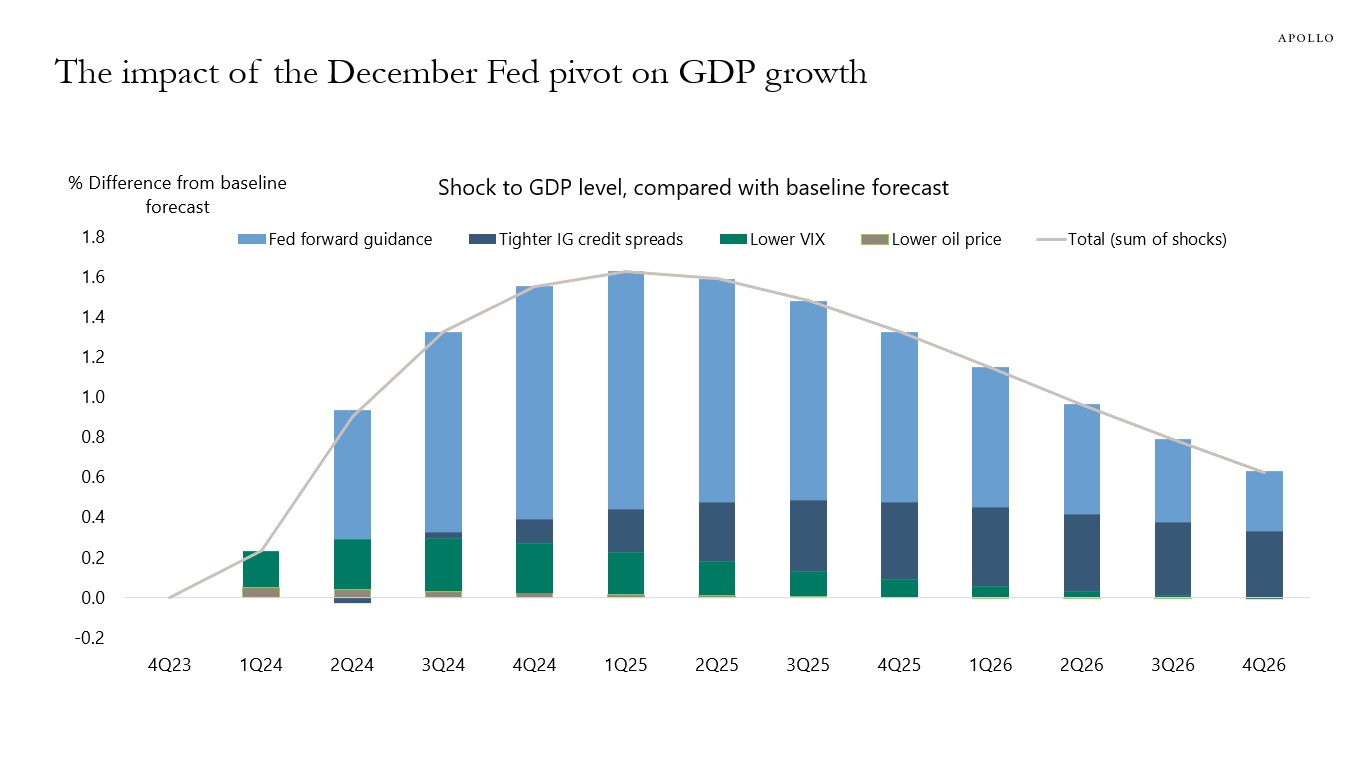
Since the Fed turned dovish in December, financial conditions have eased dramatically, with the S&P 500 reaching all-time highs, credit spreads tightening, IPO activity picking up, and M&A activity picking up. As a result, consumer spending is currently getting a strong boost from record-high stock prices, high home prices, and record-high Bitcoin prices combined with high cash flows for owners of fixed income. The bottom line is that a dovish Fed giving the green light to investors too soon could result in a second mountain in inflation. That is the reason why the last mile is harder.
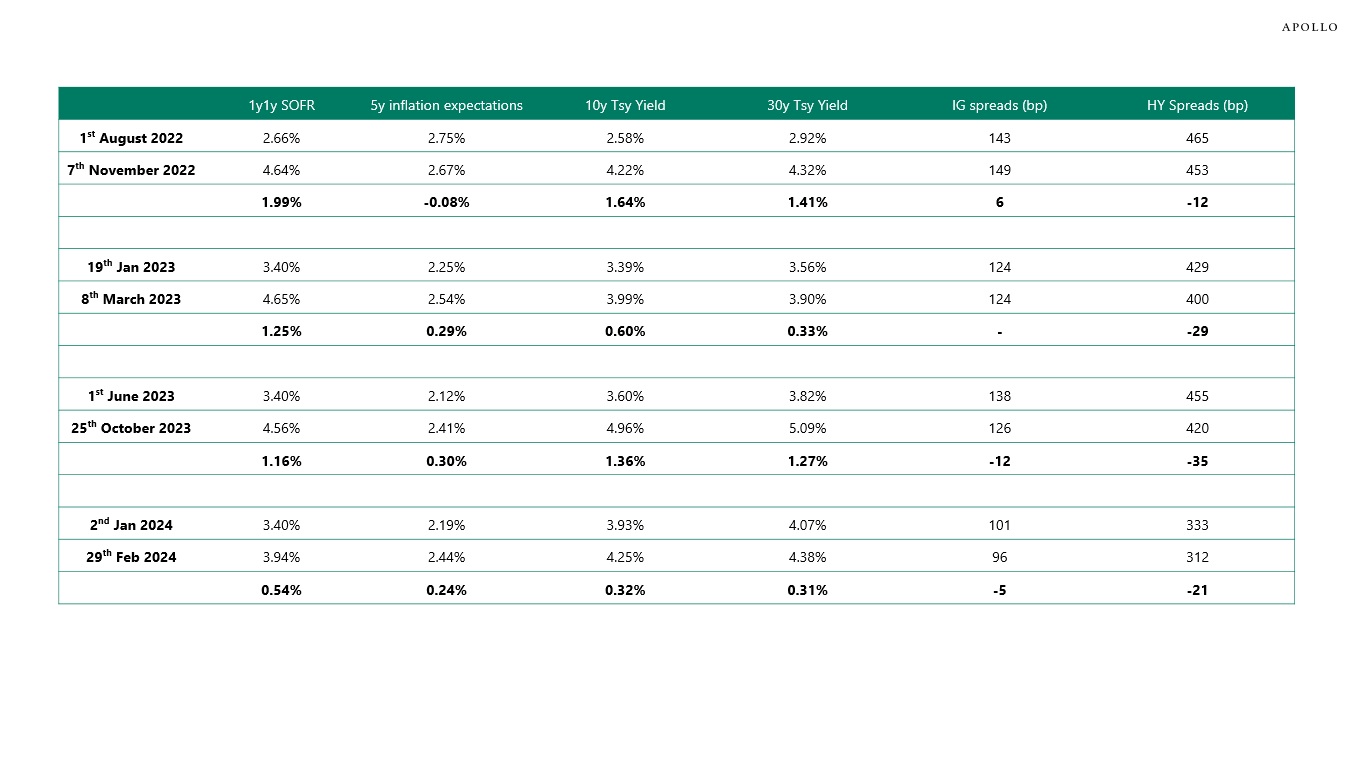
With the Fed on hold until 2025, my colleague Shobhit Gupta and I took a look at recent episodes since 2022 when rates markets have been pricing higher for longer. The evidence shows that rates higher for longer have generally been associated with tighter credit spreads both for IG and HY, likely because of stronger-than-expected growth and earnings, see table below.

Listen to Apollo Chief Economist Torsten Sløk and co-head of Sponsor and Secondary Solutions (S3) Steve Lessar discuss how private equity secondary markets can create opportunities for investors seeking diversification in an environment where rates are seen higher for longer and public equity valuations remain lofty. It’s a wide-ranging conversation, covering different types of secondaries, how to deploy them in portfolios, and much more.
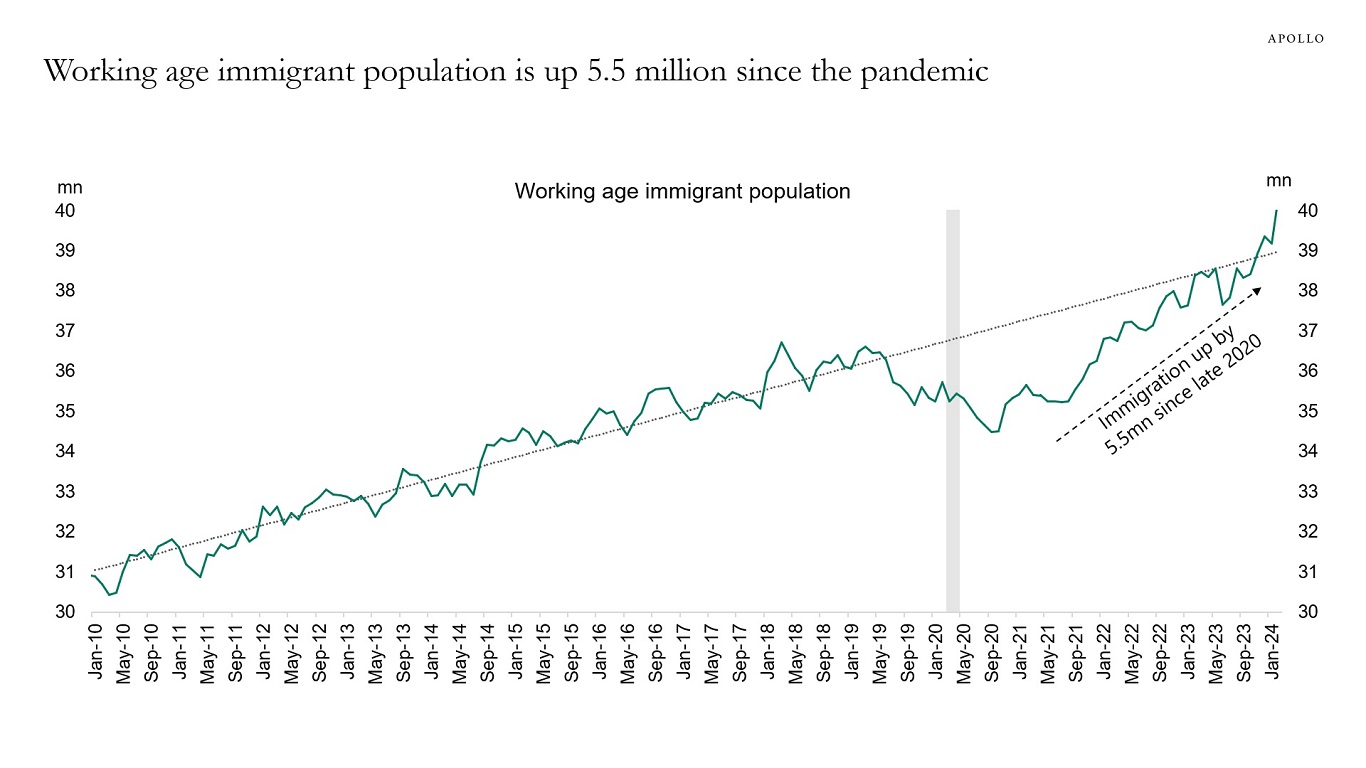
The employment report showed a continued increase in immigration, which supports employment growth, consumer spending, and demand for housing, see chart below.
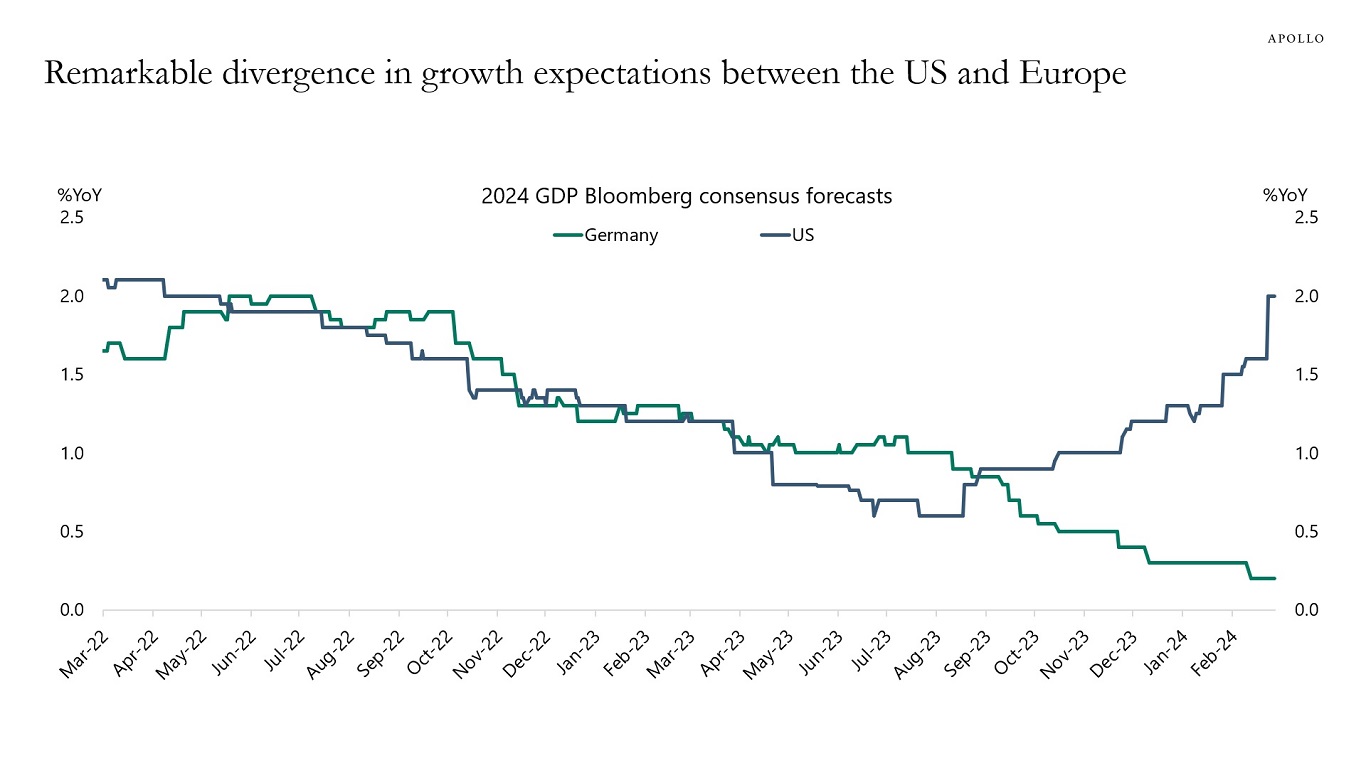
Normally, the business cycles in the US and Europe are highly correlated, but over the past six months, a remarkable gap has appeared, with growth expectations rising in the US and falling in Germany, see chart below.
What are the arguments for a strong February employment report?
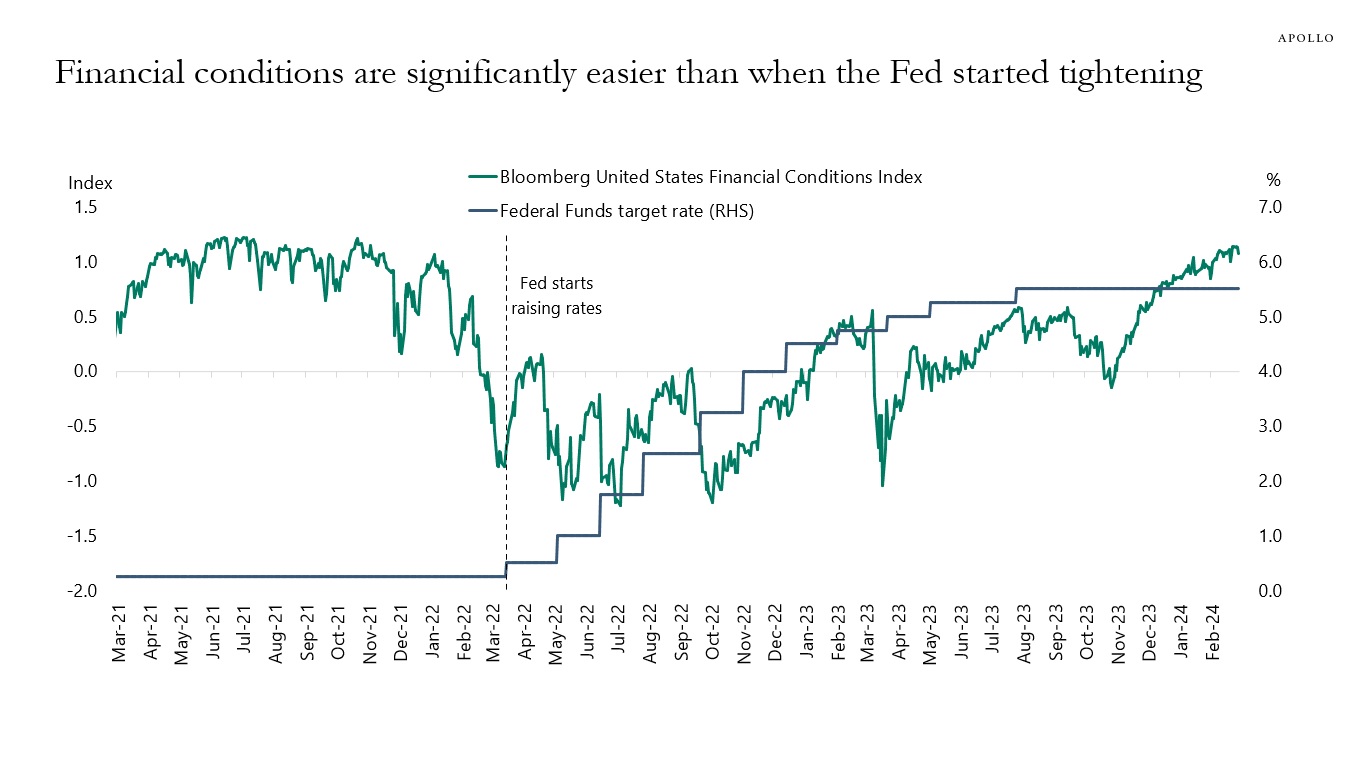
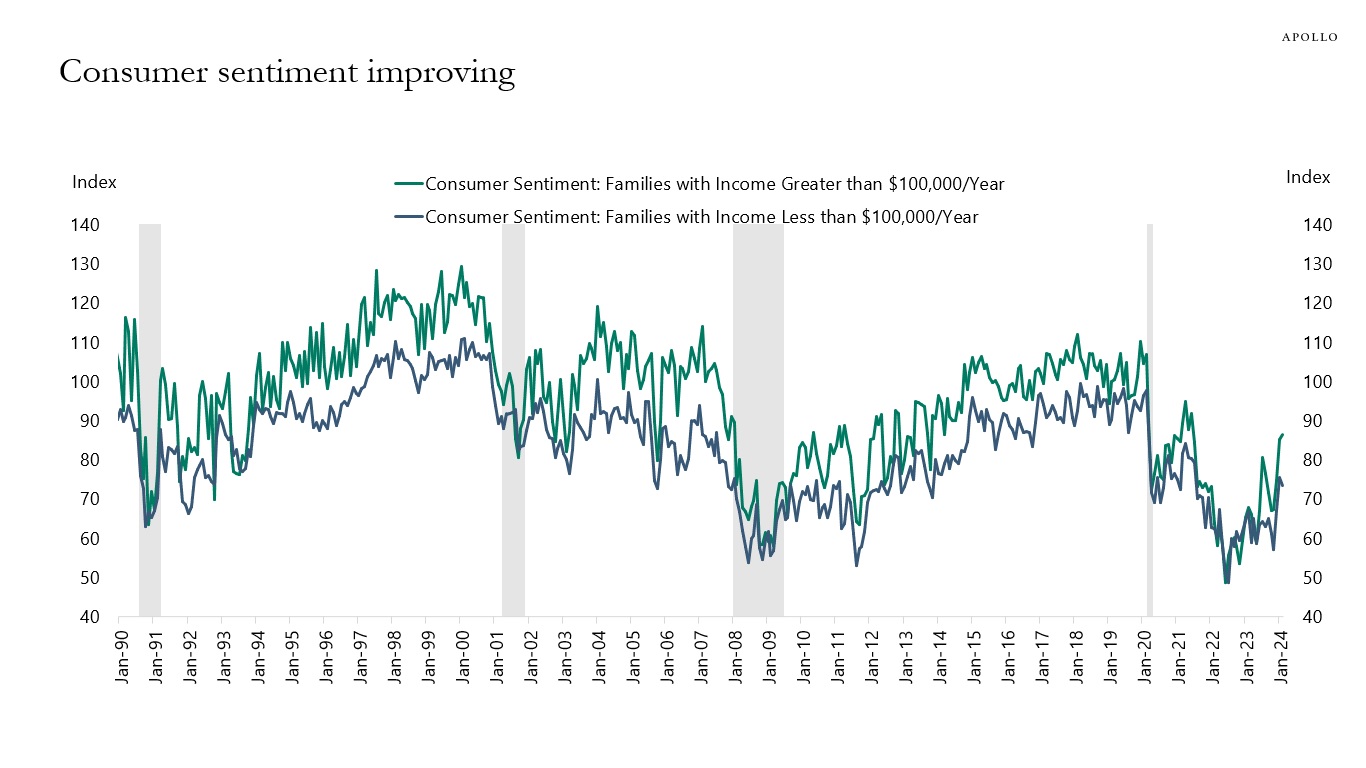
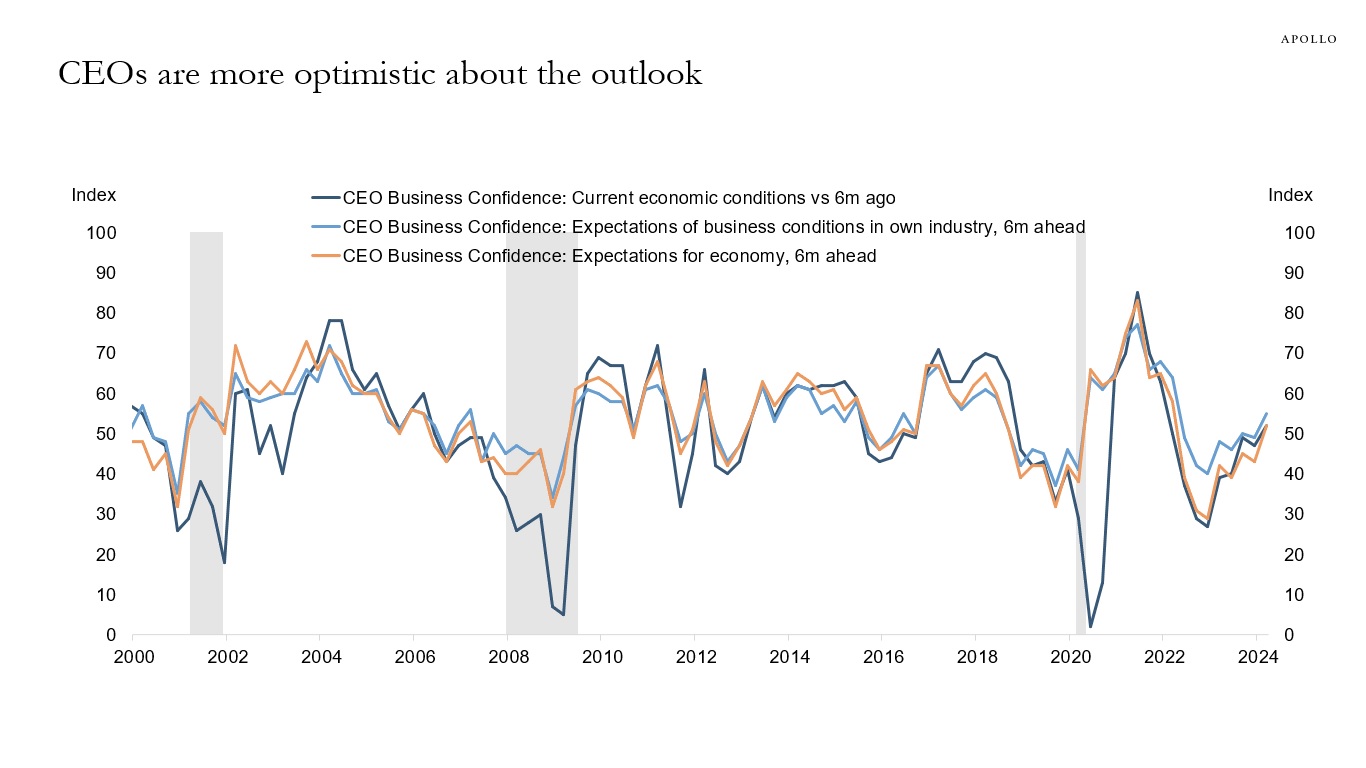
1) Financial conditions have eased dramatically since the December FOMC meeting, with the S&P 500 at all-time highs and very tight IG and HY spreads. Significant wealth effects and lower borrowing costs are a major tailwind to consumer spending and capex spending, see the first and second charts.
2) Jobless claims remain very low, around 200,000, and the economy remains surprisingly resilient, with households and firms having locked in lower interest rates during Covid, see the third and fourth charts.
3) The fiscal deficit is running at a high 6% of GDP for an expansion, driven by the CHIPS Act, IRA, and Infrastructure Act, and associated positive effects on manufacturing construction, energy investments, and infrastructure investments.
4) The employment-to-population ratio is almost a full percentage point lower than pre-Covid, and immigration continues to be strong, suggesting there is still more upside potential to employment.
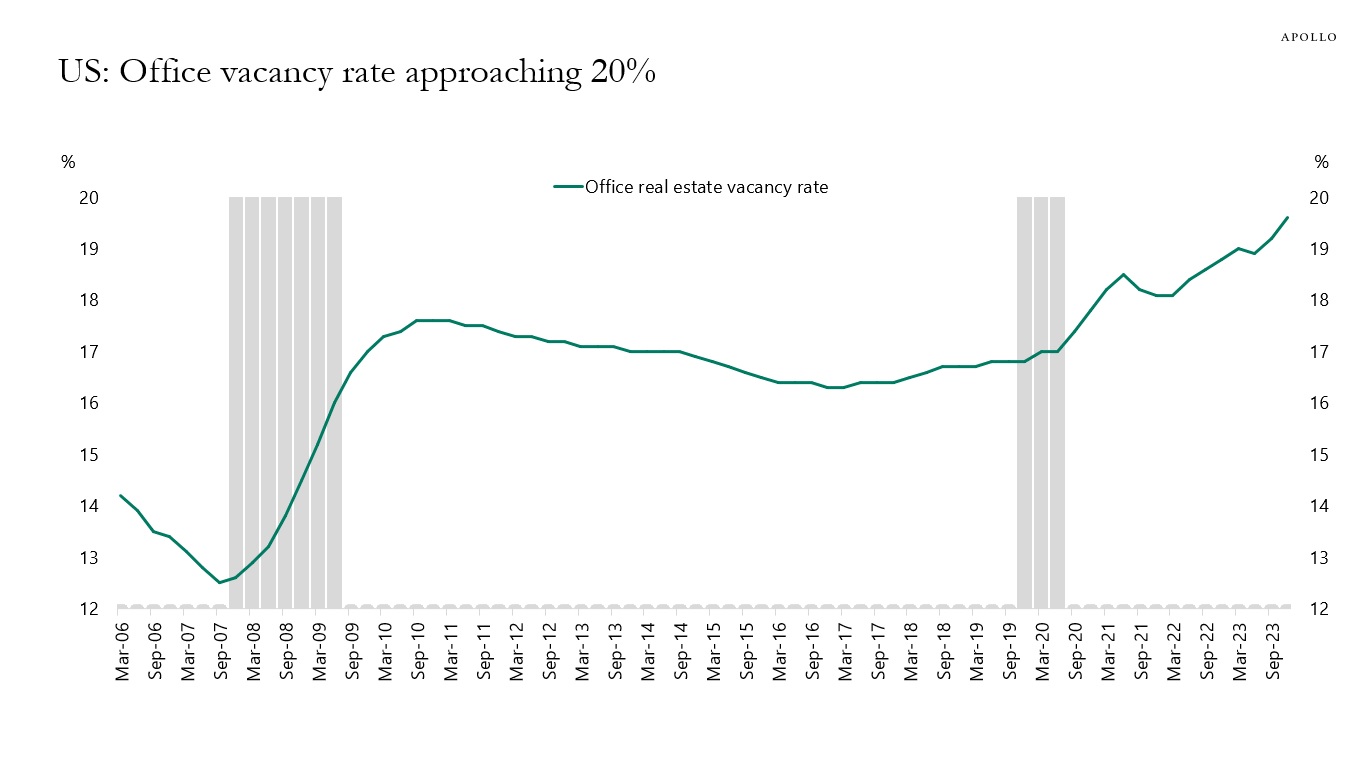
The vacancy rate for US office is approaching 20%, see chart below. And this is in a strong economy with a strong labor market. If the unemployment rate starts rising because of the lagged effects of Fed hikes, the office vacancy rate will increase even more.
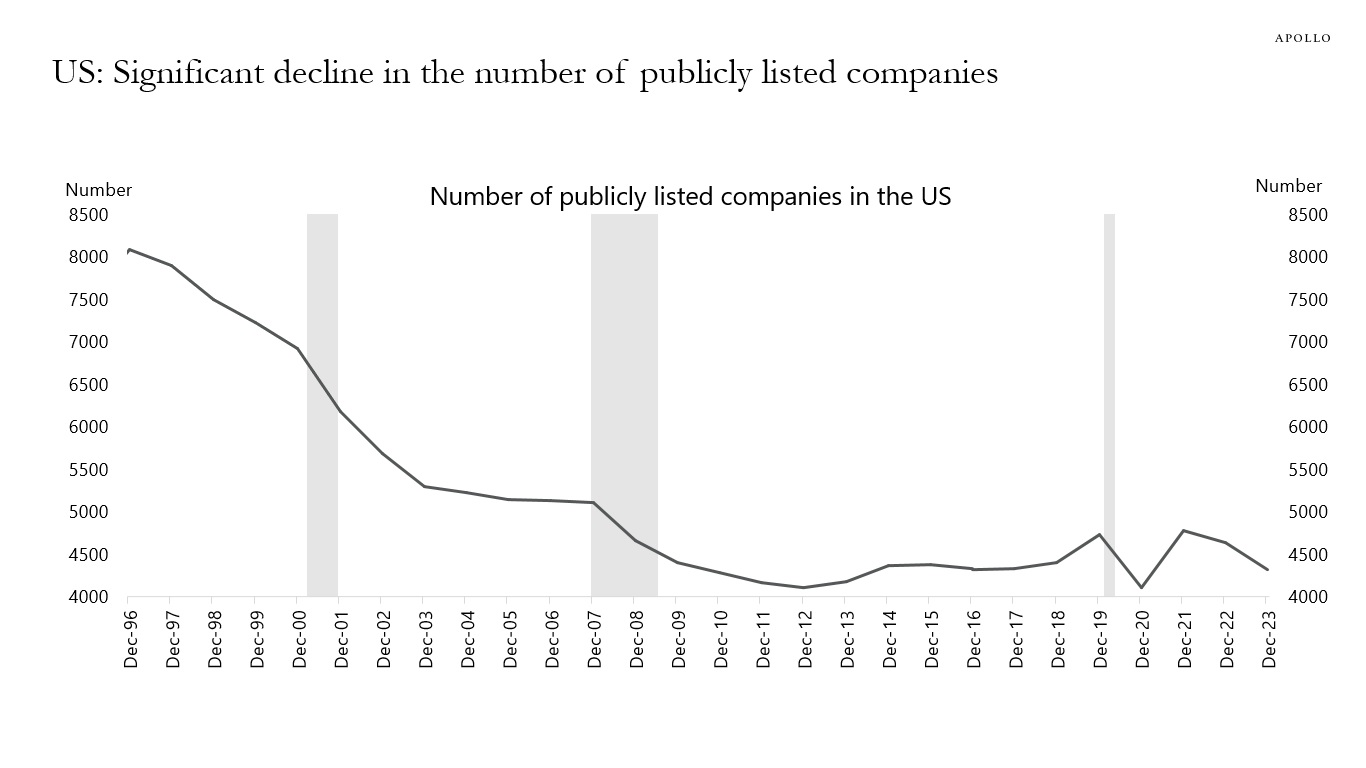
The number of publicly listed companies has declined 50% since the mid-1990s, see chart below.