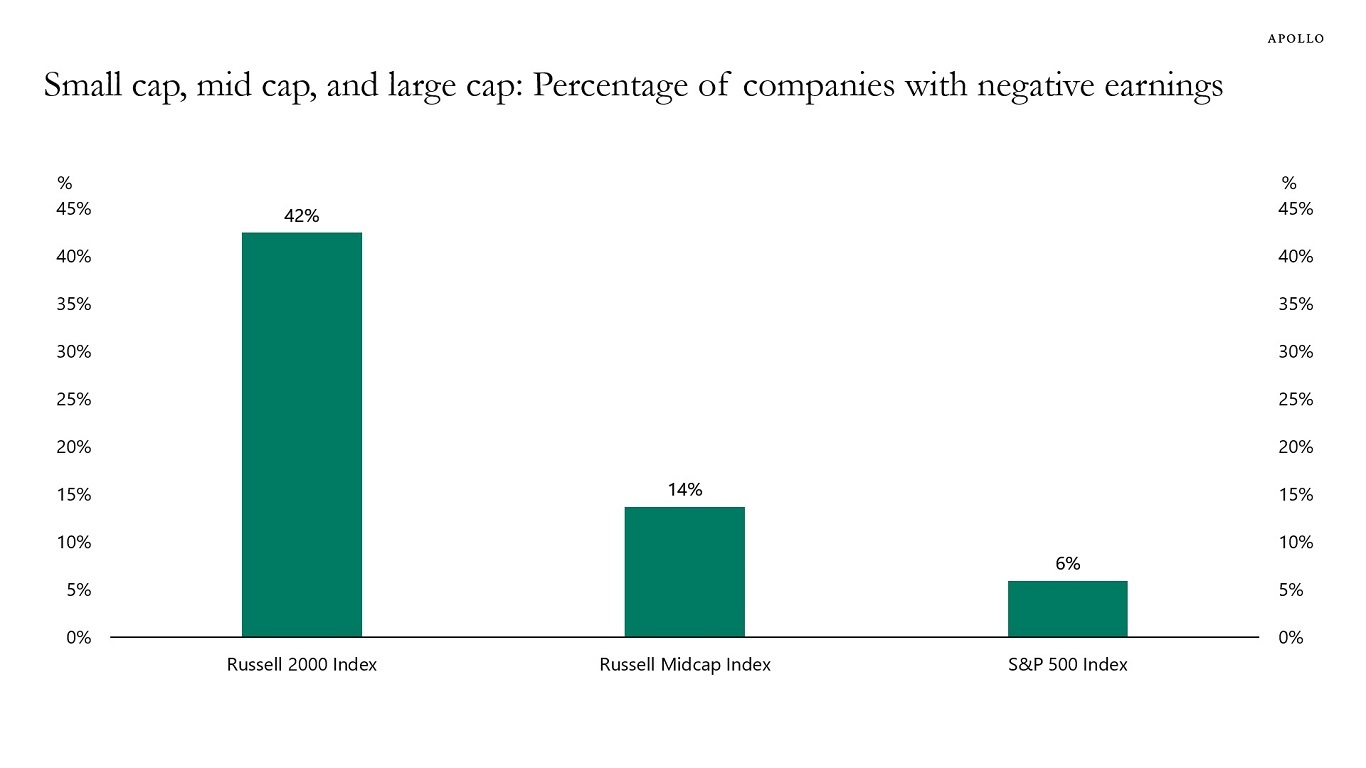
Forty-two percent of companies in the Russell 2000 have negative earnings. For the mid-cap index, the number is 14%, and for the S&P 500, it is 6%, see chart below.


Forty-two percent of companies in the Russell 2000 have negative earnings. For the mid-cap index, the number is 14%, and for the S&P 500, it is 6%, see chart below.
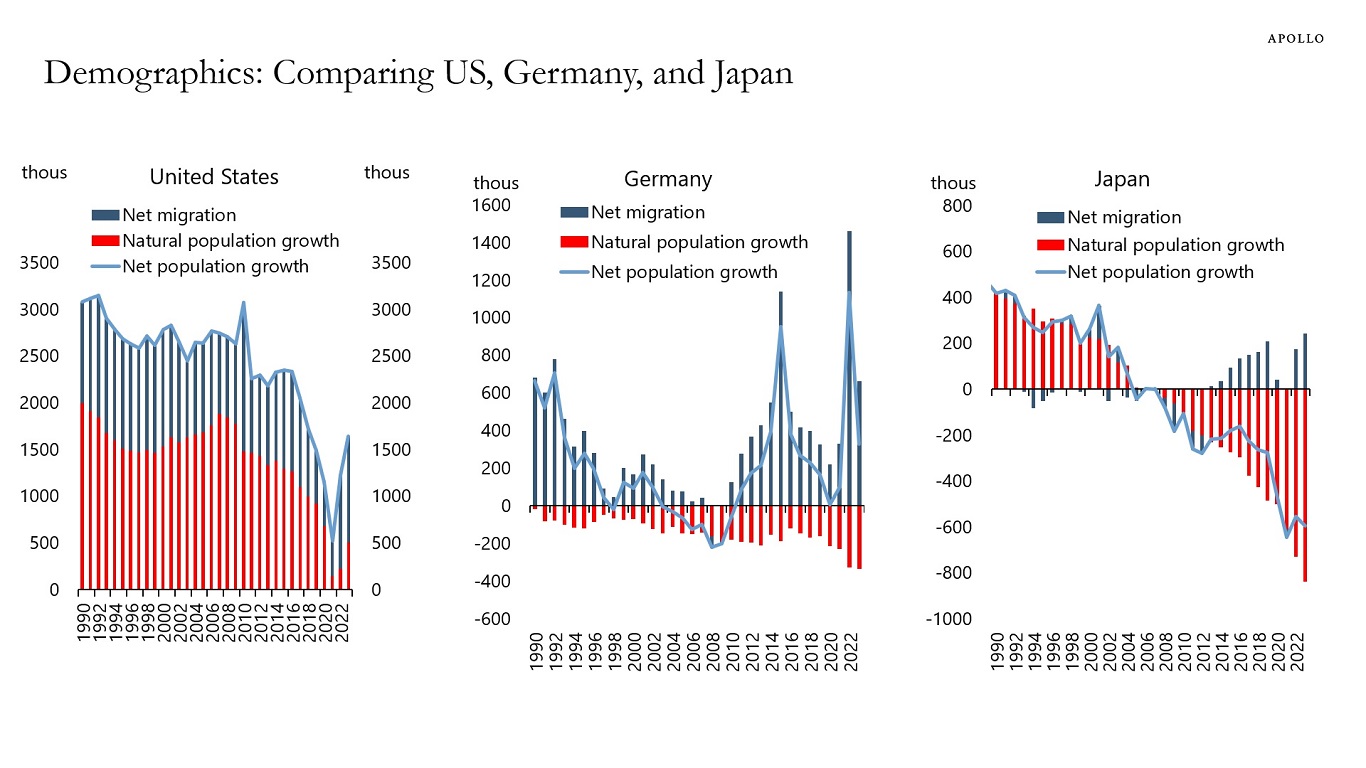
The US has positive net immigration and positive but declining natural population growth.
Germany has negative natural population growth and positive net immigration.
Japan has very negative population growth and modest net immigration.
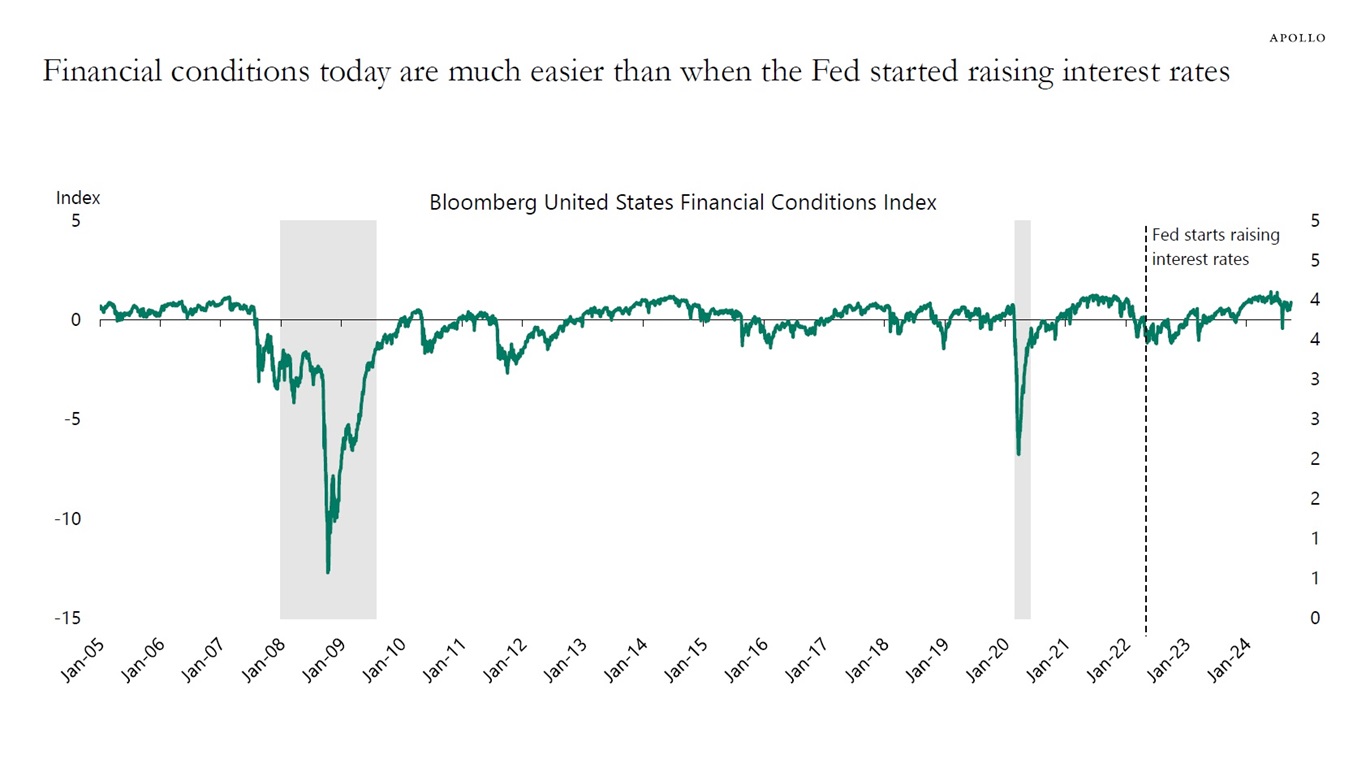
The idea that real interest rates become tighter when inflation falls and, therefore, the Fed must follow along with cuts is misguided. No household or firm borrows at the Fed funds rate. It is financial conditions that matter. With record-high stock prices and very tight credit spreads, cutting 50bps makes financial conditions even easier, see charts below.
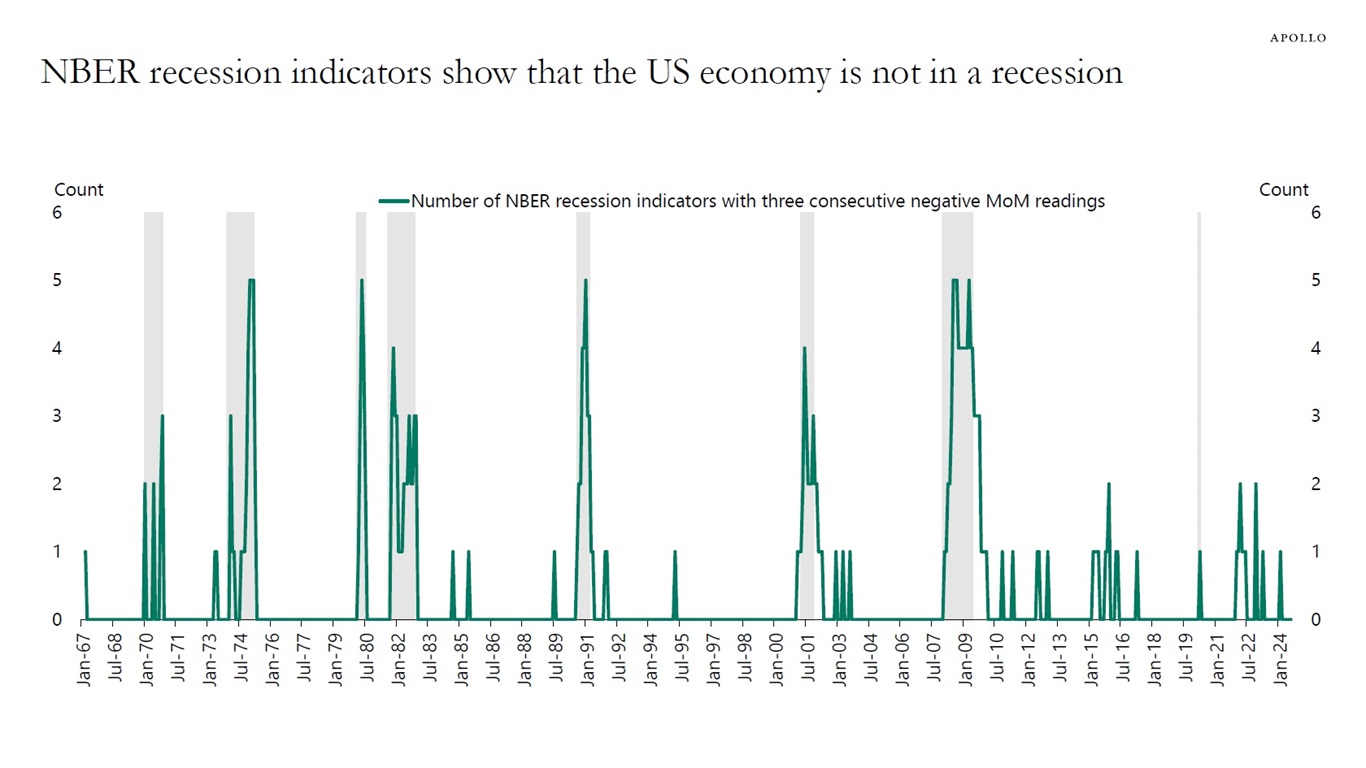
More broadly, the source of recessions and why the economy suddenly goes from calm to chaos in a nonlinear way is because of a shock. In the 2020 recession, Covid was the shock that triggered a sudden stop in consumer spending and capex spending. In 2008, the shock was Lehman. In the 2001 recession, the shock was a 50% decline in the S&P 500 index.
But there is no exogenous shock today. Households don’t suddenly stop spending unless there is some shock hitting their income or wealth.
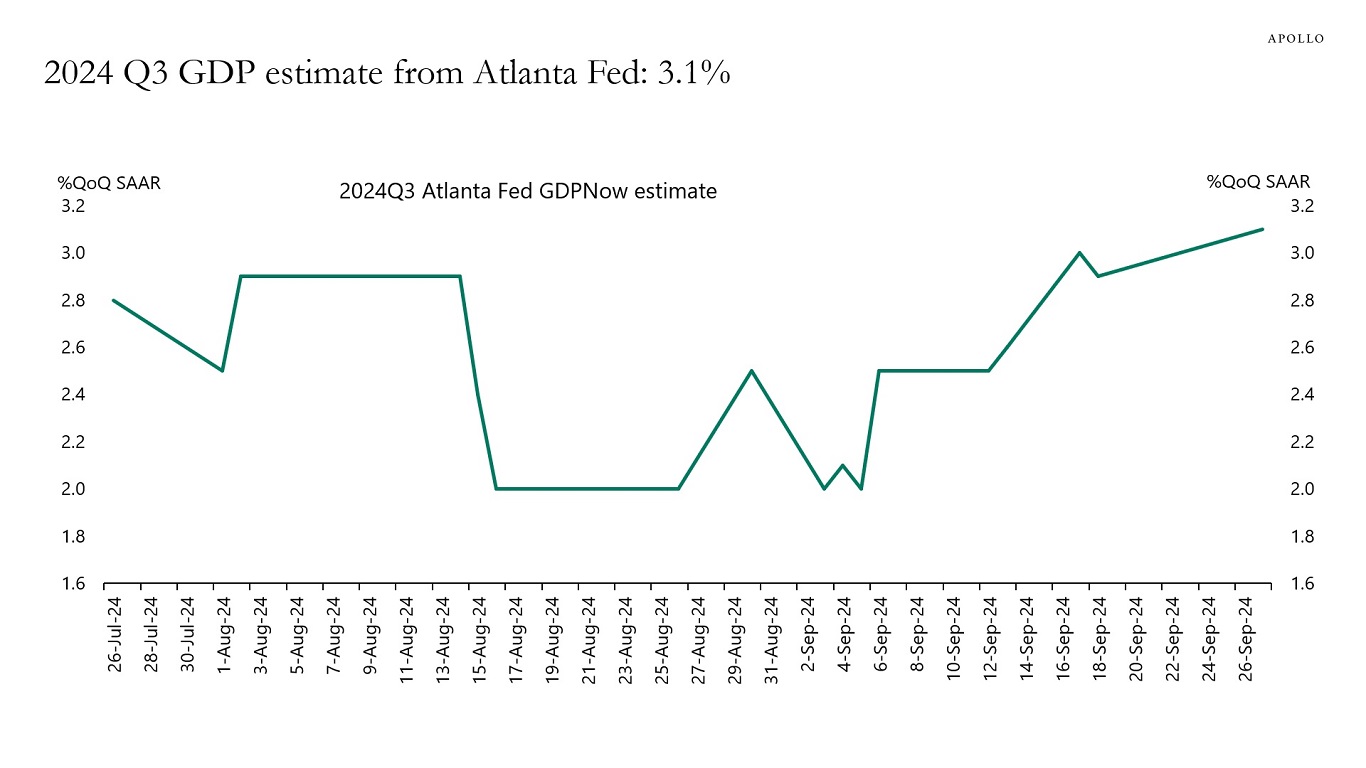
The shock during this cycle was interest rates going up since March 2022, and that didn’t generate a recession. Now, interest rates are going down, and financial conditions are easing rapidly. Inflation is currently close to 2%, and growth is strong, and the Atlanta Fed GDP estimate for the third quarter stands at 3.1%.
Summing up, current economic conditions can be best described as “goldilocks.” Not too hot, and not too cold. But the story doesn’t end here. The risk with cutting interest rates too much too quickly is that the economy becomes too hot again.
See our chart book with daily and weekly indicators.
German exports to Kyrgyzstan have increased significantly since February 2022, see chart below. For a timeline of EU sanctions against Russia, see here.

The price of car insurance has increased 50% since the pandemic began, see chart below.

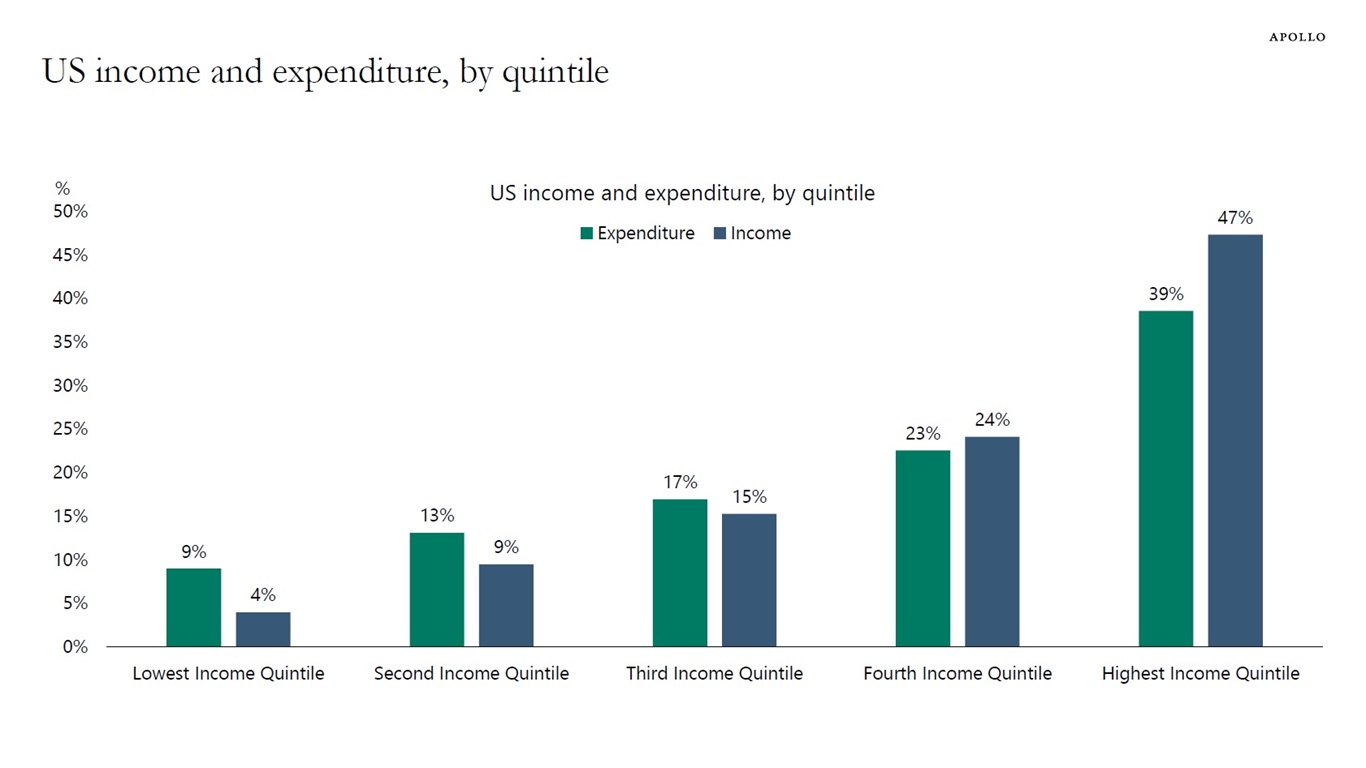
The bottom 40% of incomes account for 22% of total consumer spending and 13% of total income, and the top 20% of incomes account for 39% of total consumer spending and 47% of total income, see chart below.
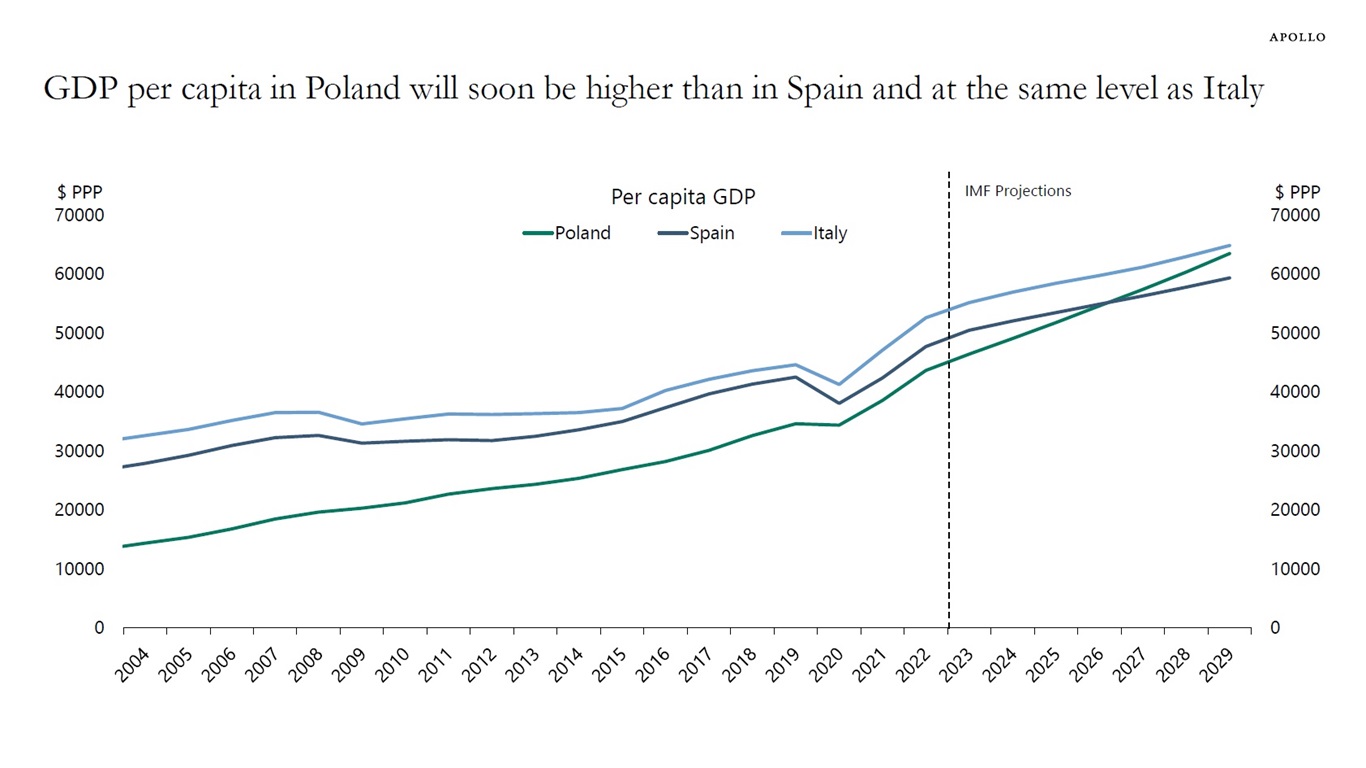
The IMF is forecasting that in a few years GDP per capita in Poland will be higher than in Spain and at the same level as Italy, see chart below.
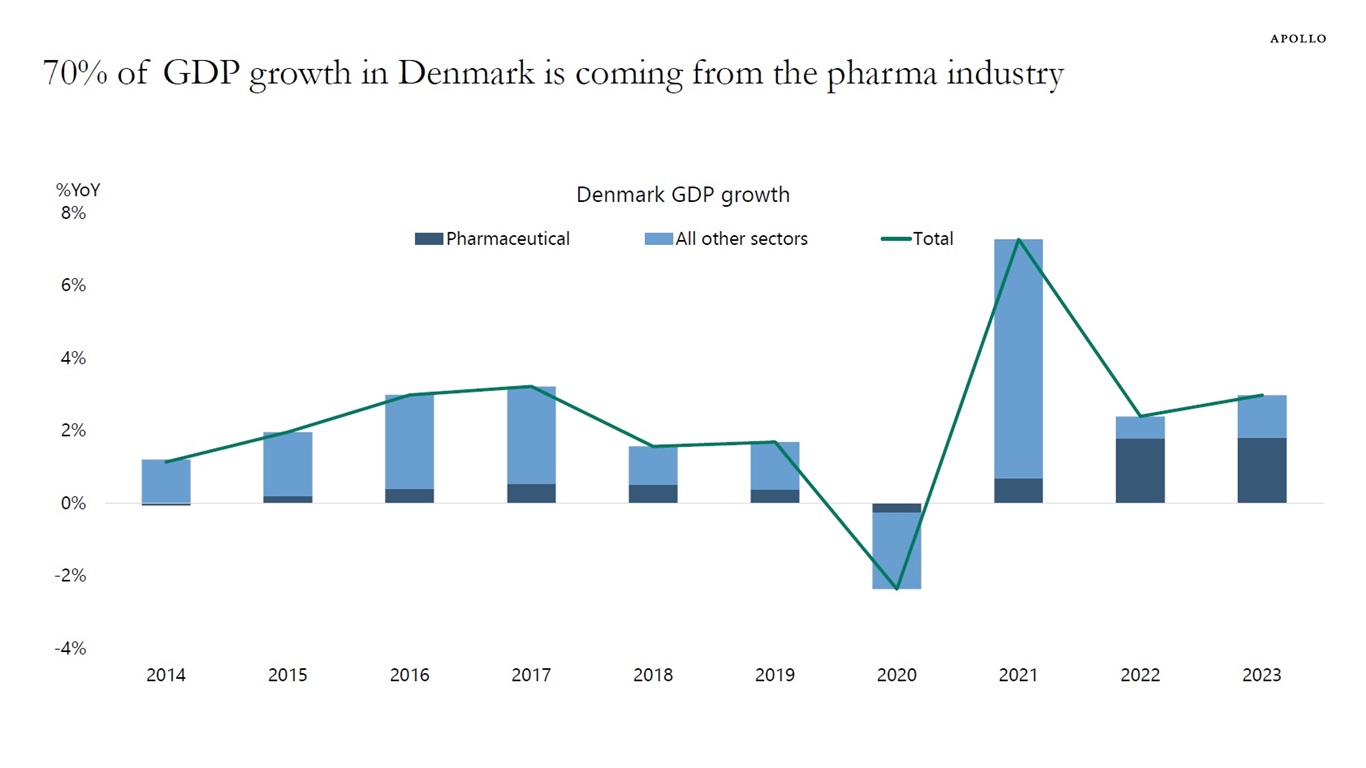
The pharma industry currently accounts for about 70% of GDP growth in Denmark, see chart below.
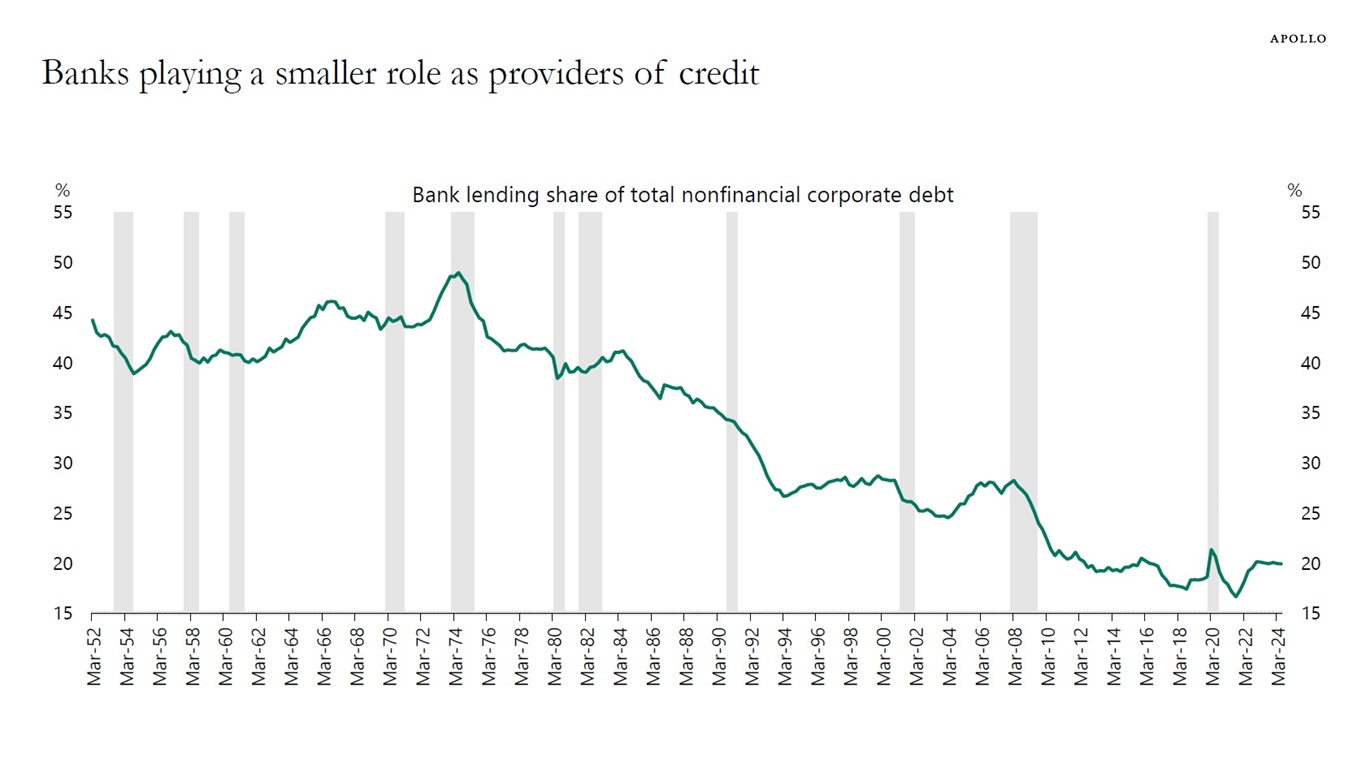
Long-term loans to corporates are moving away from being financed by overnight deposits to instead being financed by the long-term liabilities of organizations such as insurers and pensions, thereby making the financial system more stable, see chart below.
It is inconsistent to say that the incoming economic data is strong but the labor market is weakening.
For example, if the Atlanta Fed GDP Now estimate is 2.9%, significantly above the CBO’s 2% estimate of long-run growth, then job growth is accelerating and the unemployment rate is declining.
With the data for consumer spending, capex spending, and government spending still strong, we should soon begin to see a rebound in nonfarm payrolls and a decline in the unemployment rate.
That is also what the incoming data is showing:
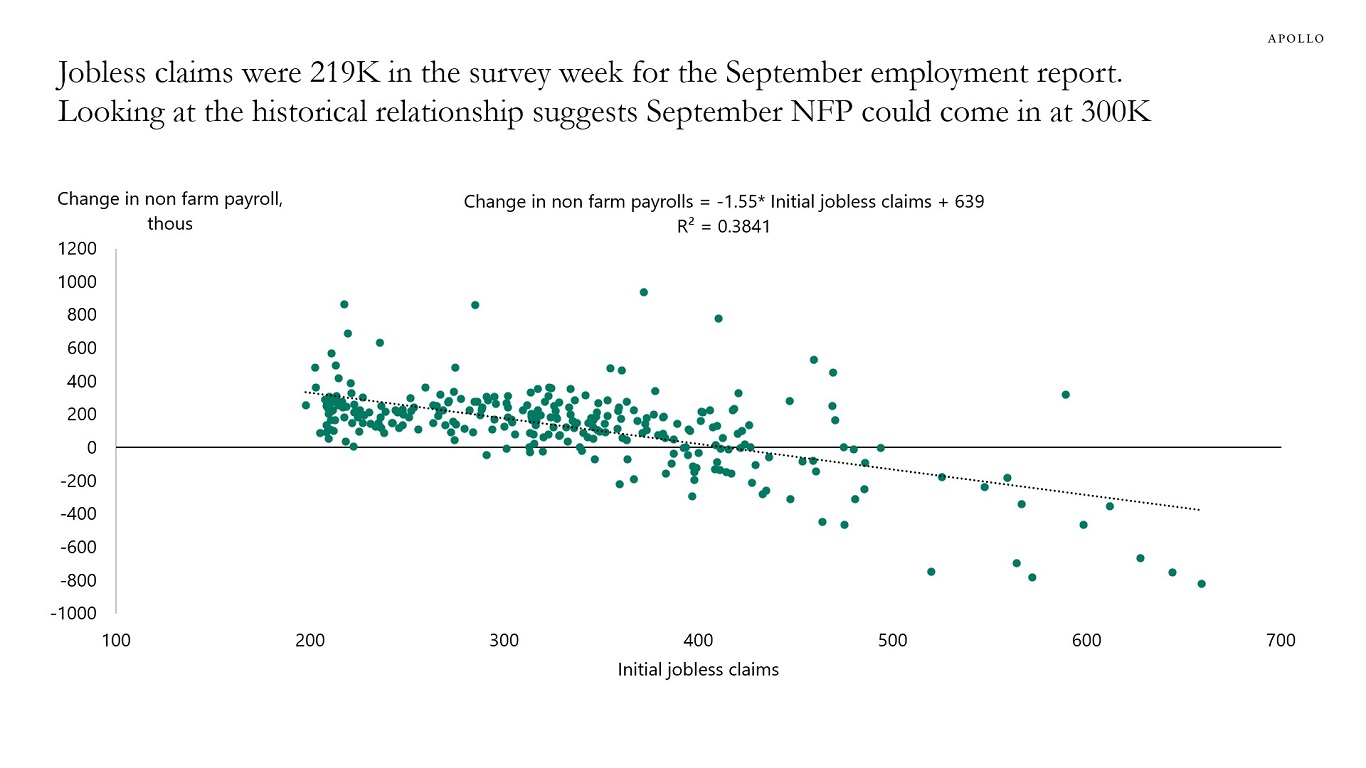
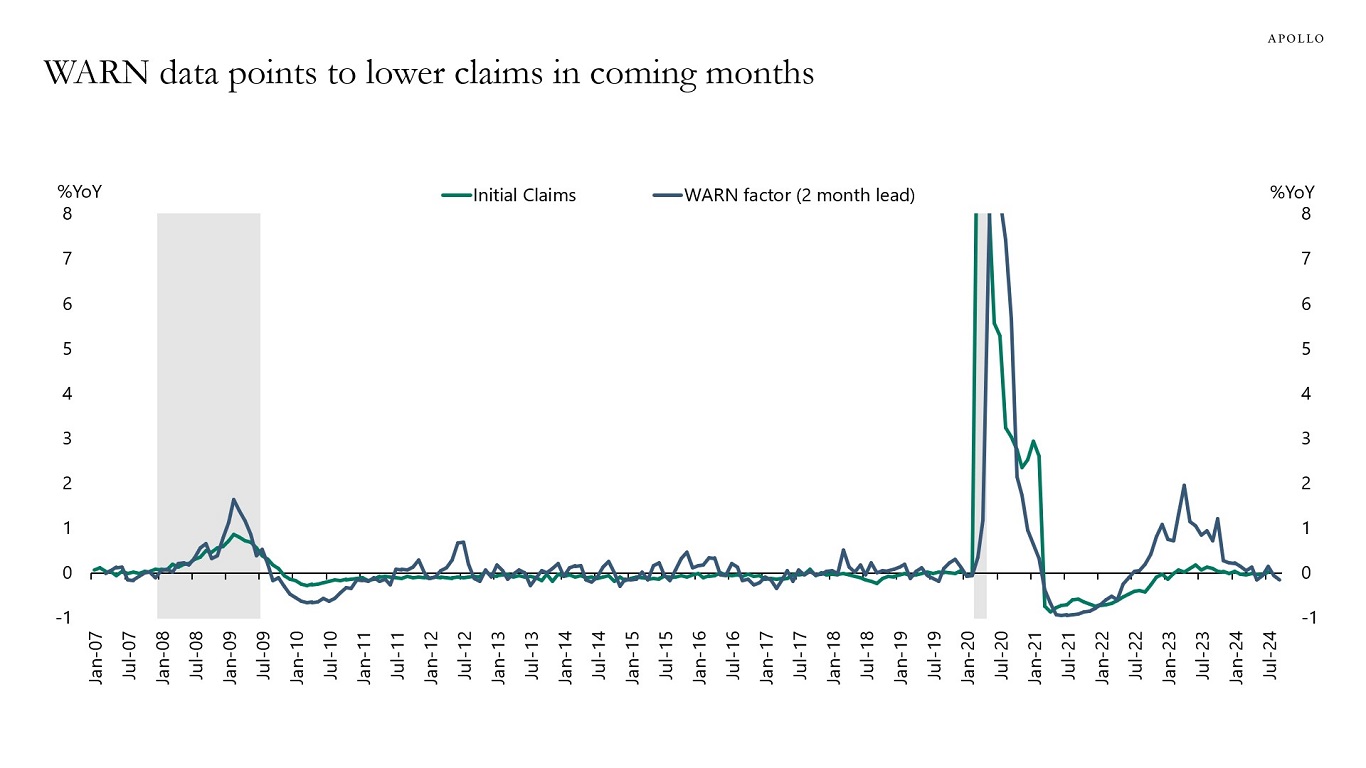
1) This week, jobless claims declined to 219,000, and given this was the survey week for the September employment report, this suggests that nonfarm payrolls for September could come in at 300,000, see the first chart below.
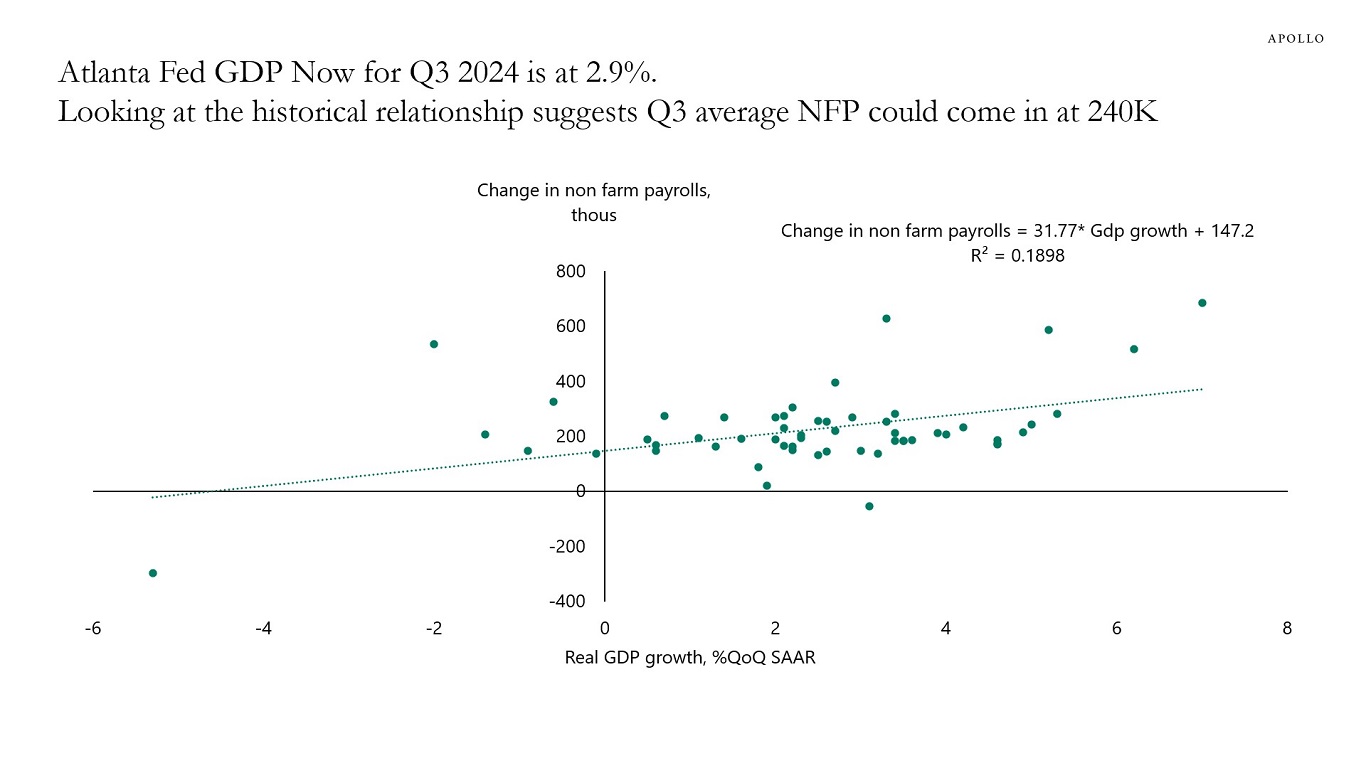
2) The Atlanta Fed GDP Now estimate currently stands at 2.9%, and looking at the historical relationship, this implies that nonfarm payrolls in the third quarter will come in at 240,000 jobs created each month in July, August, and September, see the second chart. In other words, we could see a sharp rebound in job growth in September from the low levels we saw in July and August.
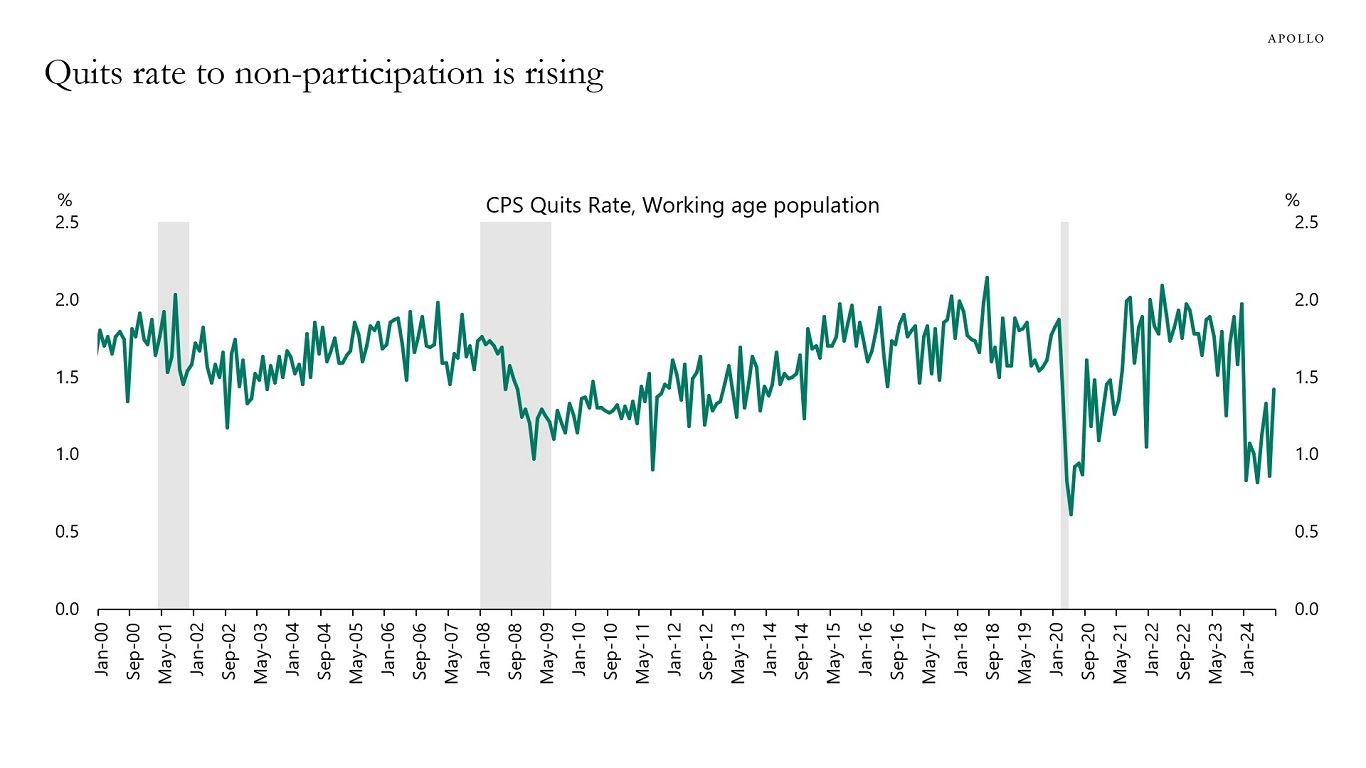
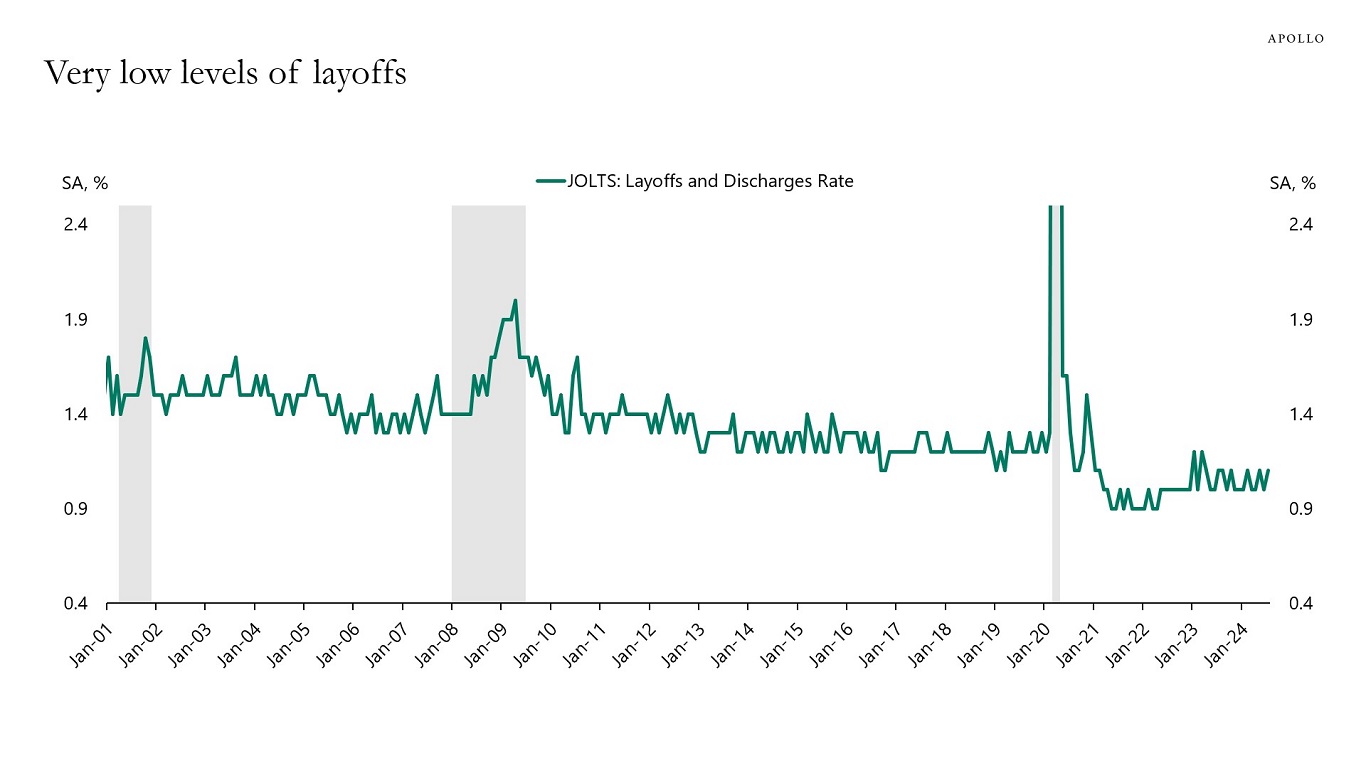
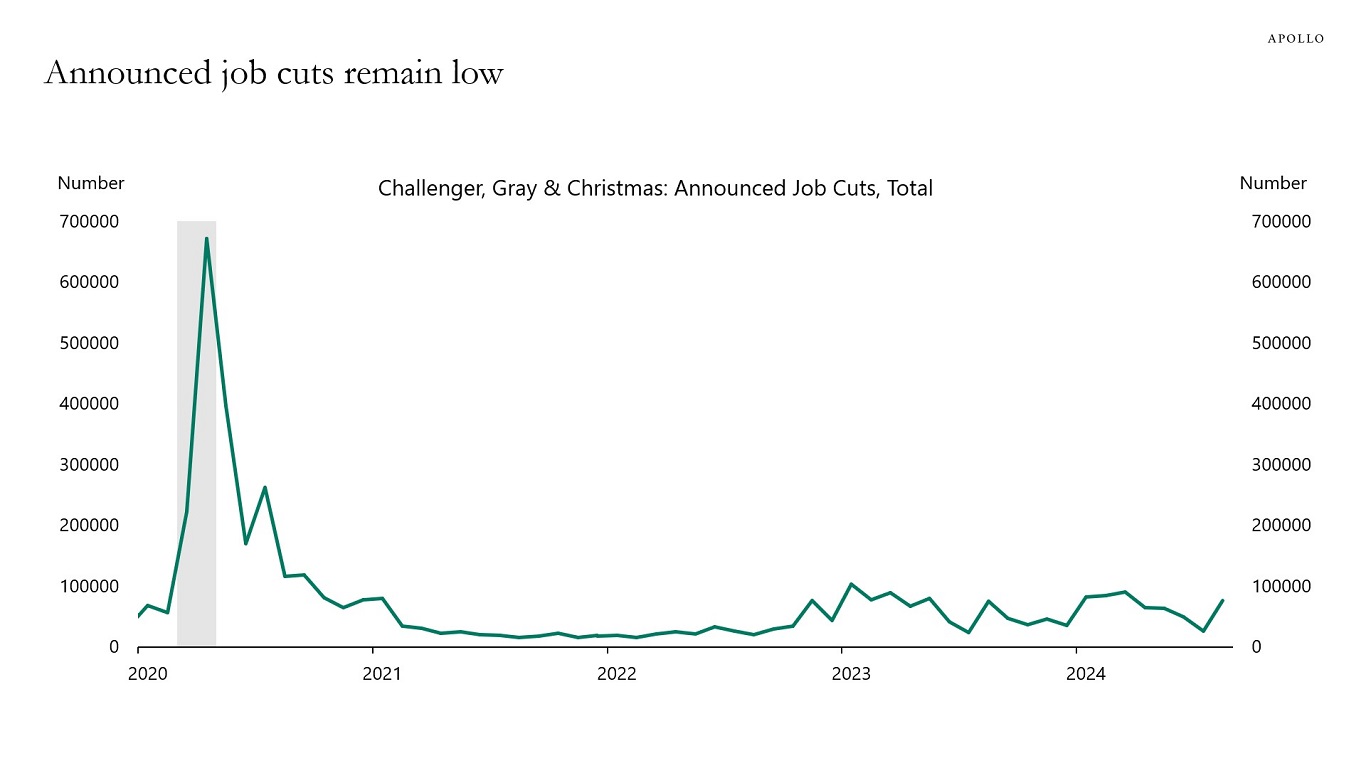
3) A new Fed paper looks at the procyclicality of quits and countercyclicality of layoffs and finds that layoffs are a leading indicator of a recession. During recessions, quits decline as layoffs increase. But this is not what the latest data for layoffs and quits to non-participation show, see the next four charts below.
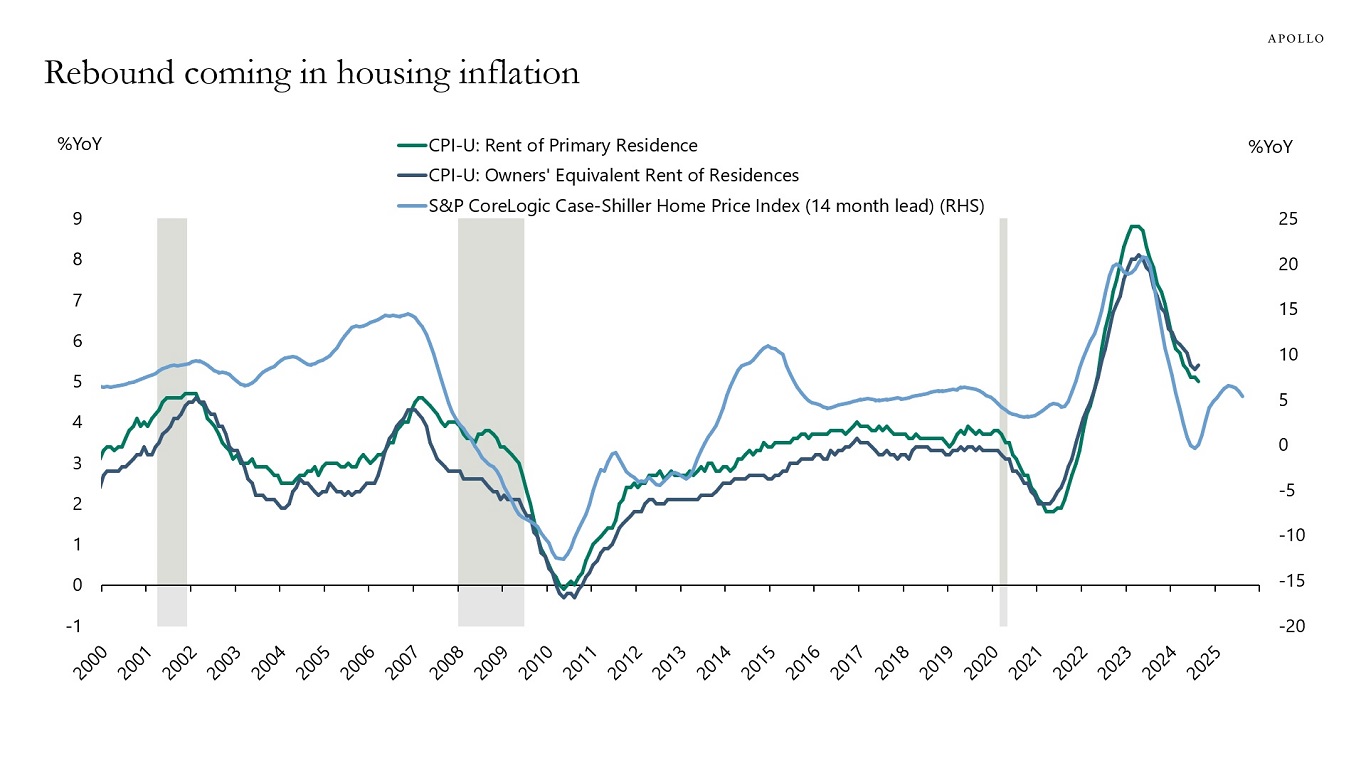
4) Finally, with mortgage rates coming down and Case-Shiller at 5% we could see a rebound in the housing market, which could trigger a rebound in overall inflation, see the last chart.
With financial conditions easing further because of the 50bps Fed cut and still strong tailwinds to economic growth from the CHIPS Act, the IRA, the Infrastructure Act, strong AI spending, and strong defense spending, the bottom line is that there are no signs of the economy entering a recession. And because of these tailwinds, there are no reasons to expect a recession. On the contrary, the incoming data seen in our chart book (available here), in particular jobless claims and the Atlanta Fed GDP Now, are pointing to a reacceleration in employment growth over the coming months.