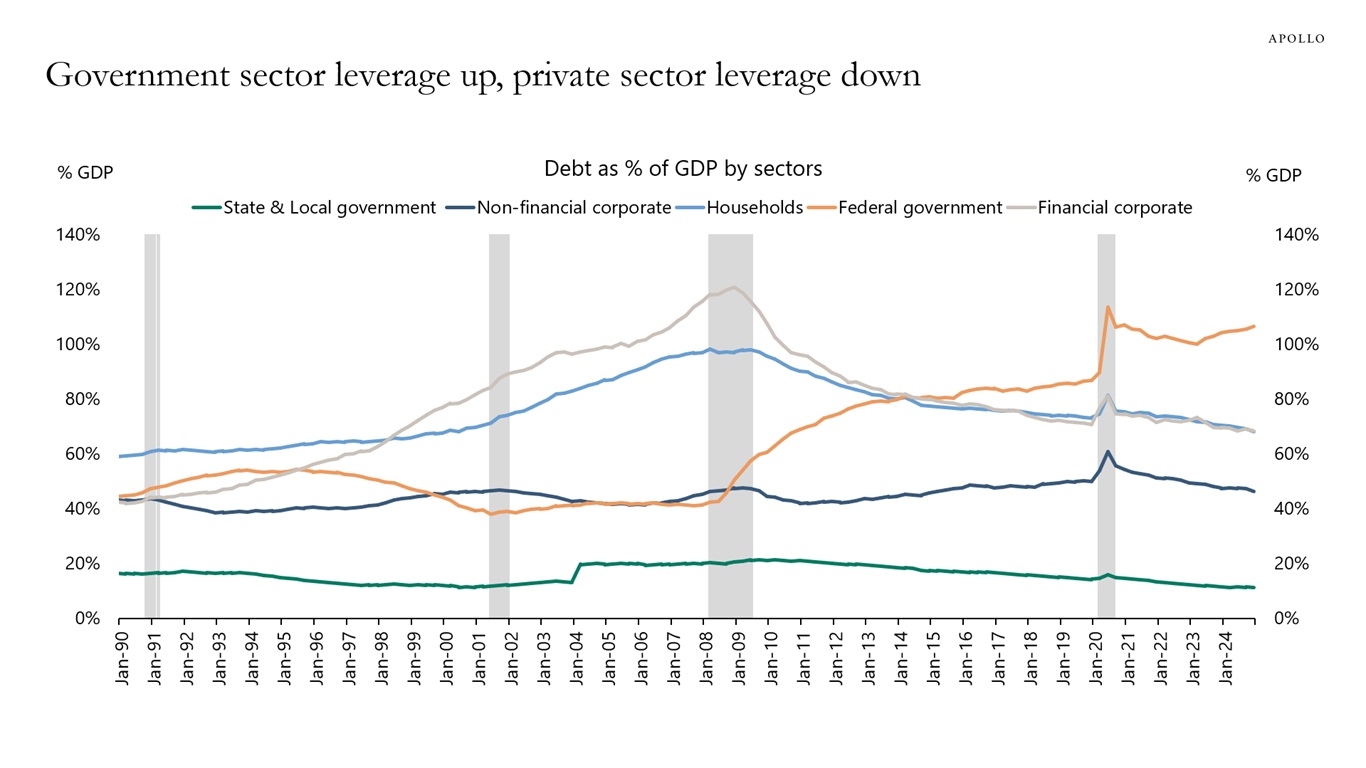
There are adjustment costs associated with changing trade policy and changing the size of the government sector, see chart below. The immediate question for markets is how big the short-term pain will be, see chart below.

There are adjustment costs associated with changing trade policy and changing the size of the government sector, see chart below. The immediate question for markets is how big the short-term pain will be, see chart below.
Investors are getting very worried about the downside risks to their portfolios. VIX call volume buying is near record-high levels, and S&P 500 put volume buying is near record-high levels, see charts below.
The chart below shows Canada and Mexico imports plus exports as a share of state GDP, and the states that are most impacted by the trade war with Canada and Mexico are Michigan, Texas, New Mexico, North Dakota, Montana, Illinois, Kentucky, Indiana, Louisiana, and Ohio.
There are adjustment costs associated with changing trade policy and changing the size of the government sector, and the immediate question for markets is how big the short-term pain will be.
The biggest downside risk is that policy uncertainty could create a sudden stop in the economy where consumers stop buying cars, stop going to restaurants, and stop going on vacation, and companies stop hiring and stop doing capex. The employment report on Friday will be stale. The key indicator to watch over the coming weeks is jobless claims, which come out every Thursday at 8:30 am ET.
About 25% of jobs added in the US economy over the past two years were government jobs, up from 5% in 2021 and 7% in 2022, see chart below.
We are hosting a conference call today at 10 am EST to discuss the potential implications of the latest US administration policy proposals, you can register here, and the chart book we will be using is available here.
About half of the US population does not own any retirement assets, see chart below.
Since the Fed began to raise interest rates in March 2022, housing starts have declined significantly, in particular, multifamily housing starts for rent have declined almost 50%, see the first chart.
Given it currently takes on average 17 months to build a multifamily property, see the second chart, we can produce a forecast for the number of multifamily homes coming to the market this year and next year. The conclusion is that multifamily completions will decline significantly in 2025 and 2026, see the third chart.
Combined with a historically low rental vacancy rate, solid household formation, and an all-time high share of Americans saying that they would rent if they had to move, the bottom line is that rent inflation will start to rise later this year, see the fourth, fifth, and sixth chart below.
Rising rents put upward pressure on OER in the CPI index and will keep inflation higher for longer. With inflation higher for longer, the Fed will also keep interest rates higher for longer.
The bottom line is that inflation remains well above the Fed’s 2% inflation target, and it will require interest rates higher for longer to get inflation back to 2%.
Our latest US housing outlook is available here.
There are often adjustment costs associated with changing policies. Laying off government workers puts upward pressure on unemployment, and imposing tariffs increases prices and lowers demand for foreign goods. How significant the impact of these policies will be on the economy depends on the magnitude and duration of each policy.
The two first charts below show the impact of tariffs and DOGE on GDP and inflation, using a model similar to the Fed’s model of the US economy, FRBUS. The results show that over the coming quarters, inflation will be 0.2% higher and GDP will be 0.5% lower.
In other words, DOGE and tariffs combined are a mild temporary shock to the economy that will put modest upward pressure on inflation and modest downward pressure on GDP.
This is also what the incoming data is showing. This week, we saw inflation expectations move higher, a reversal of capex spending plans, and weakness in consumer confidence, see the third and fourth chart, and our chart book here. Jobless claims also moved higher, likely driven by government contractors and also by federal workers who had not received forms SF-50 and SF-8 and decided to file for unemployment benefits anyway to get the process started.
The bottom line for markets is that this is a modest stagflation shock to the economy but not a recession.