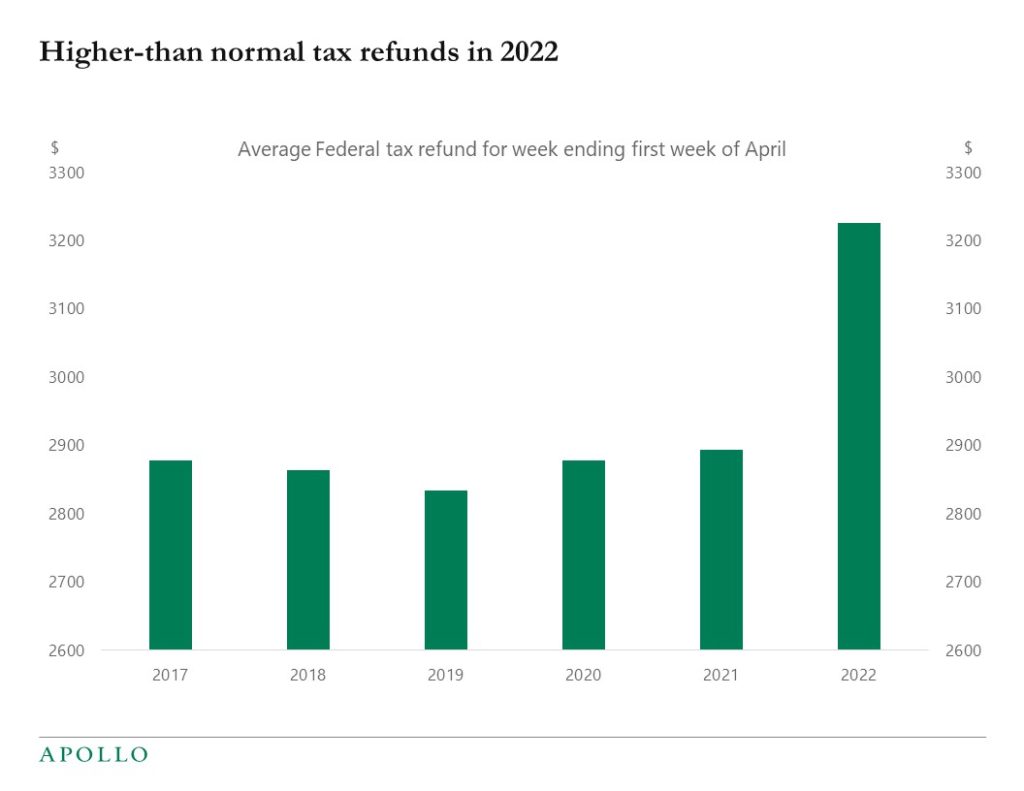
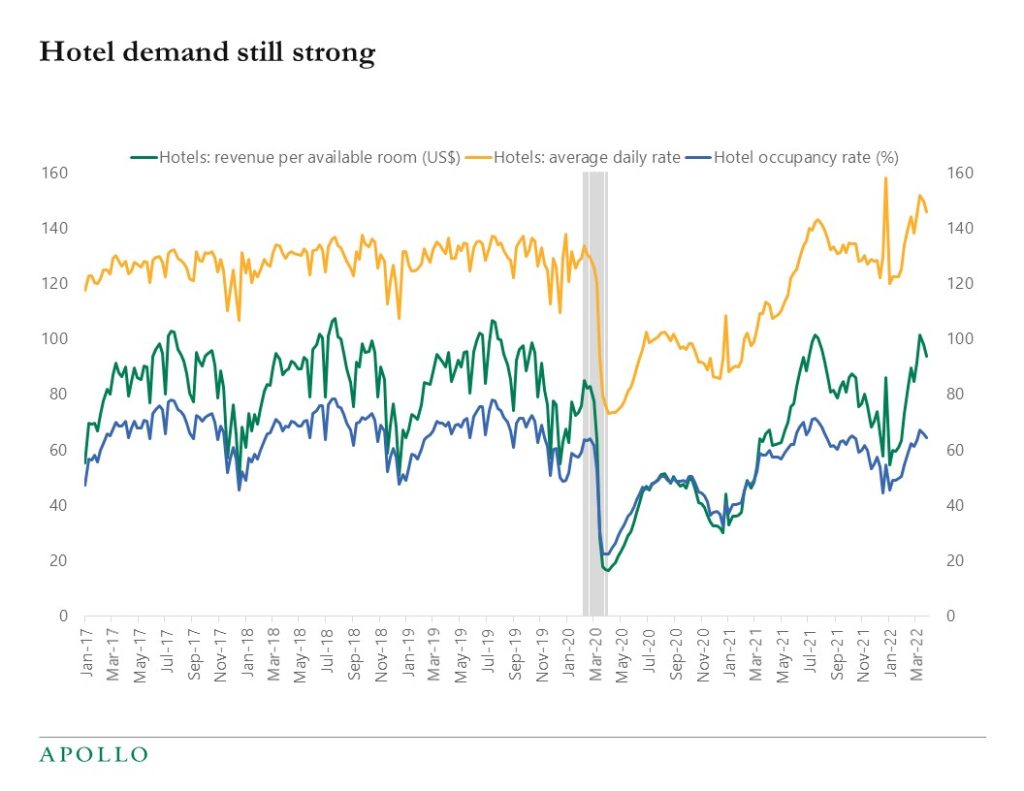
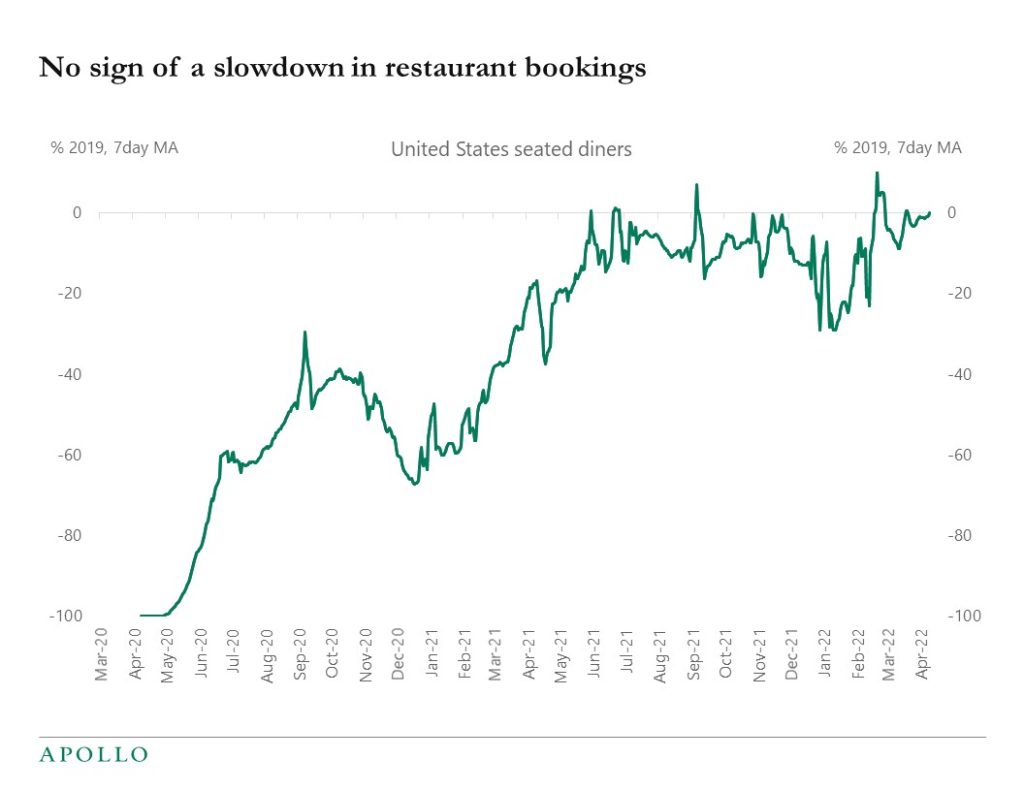
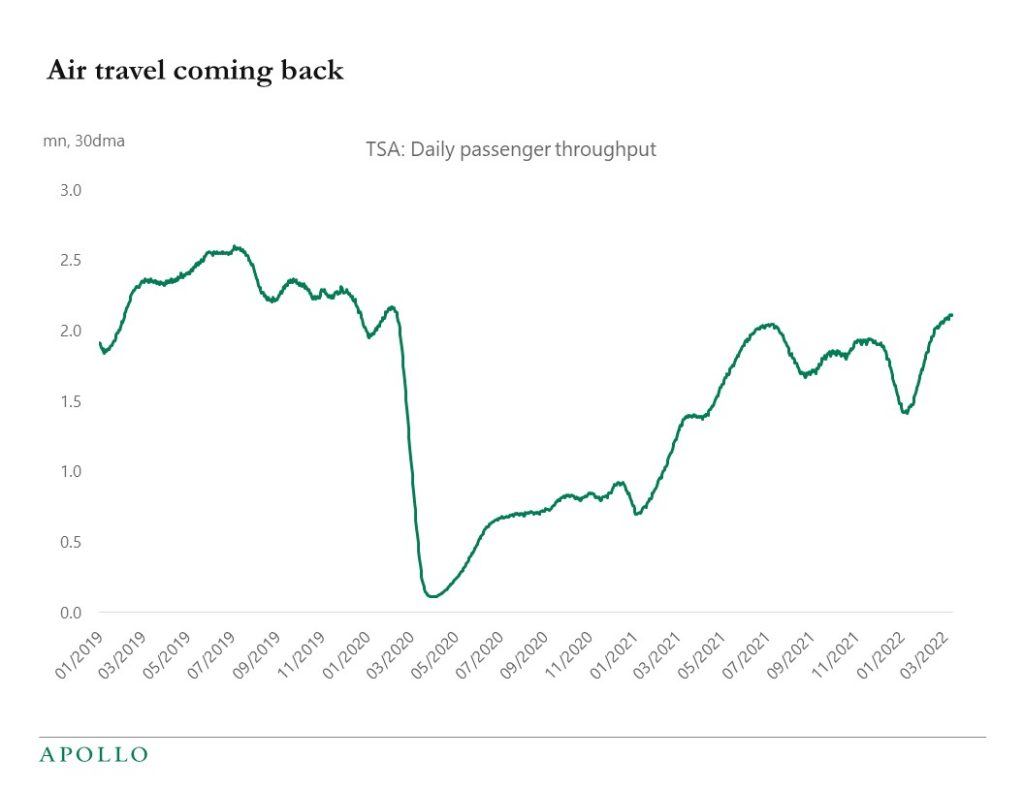
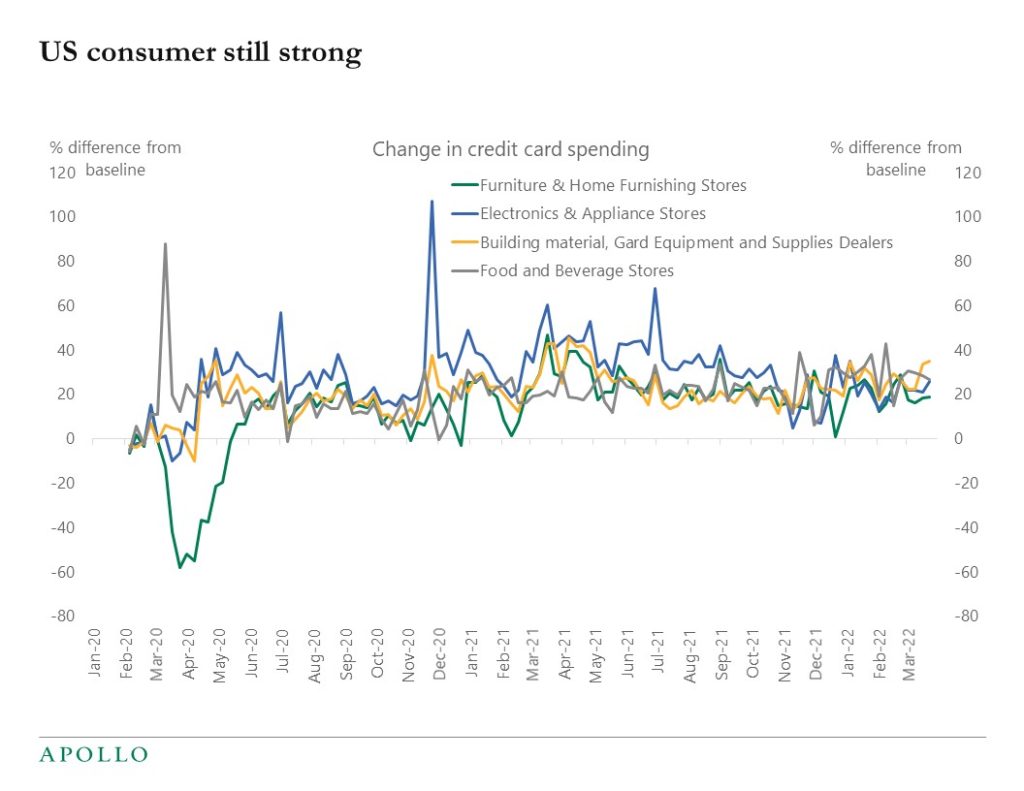
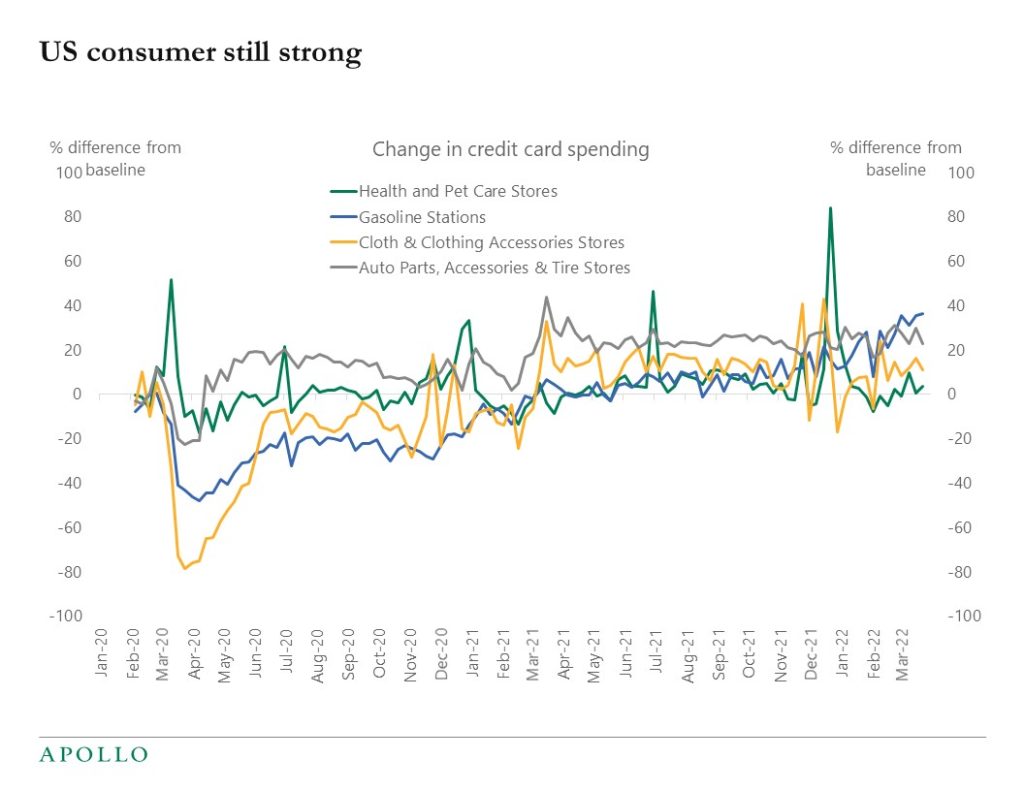
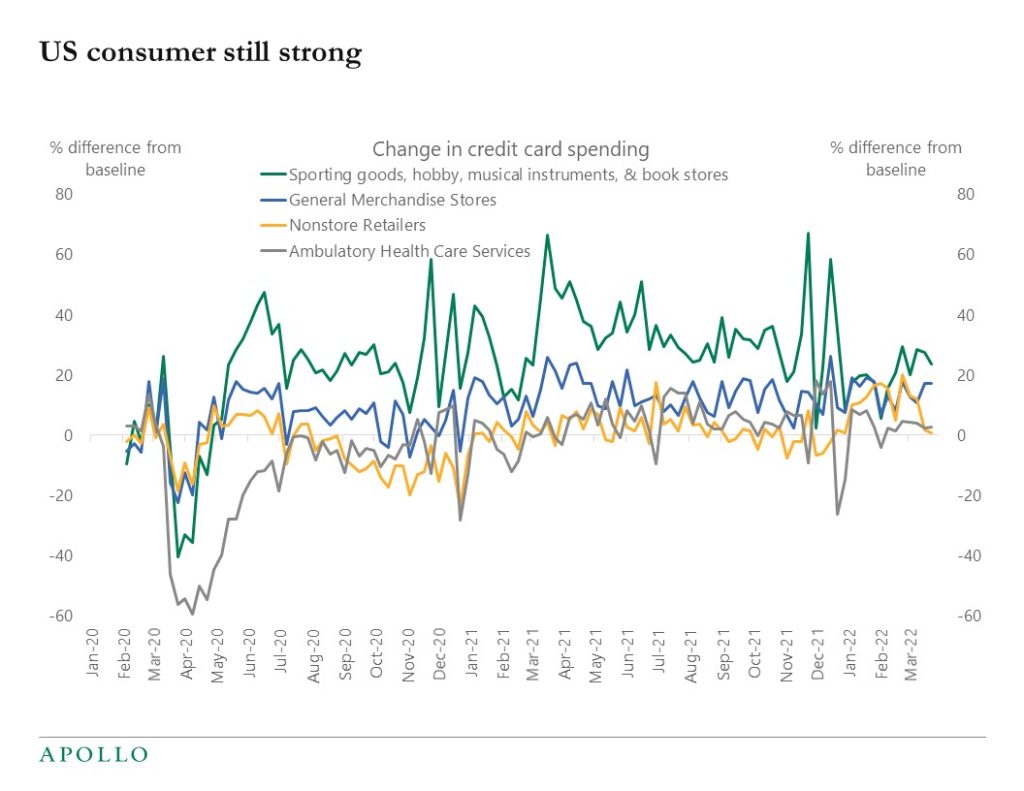
The Fed is raising rates to cool down inflation, but daily indicators for consumer spending, airline travel, hotel reservations, and restaurant bookings show no signs of the economy slowing down, see charts below.
Combined with the strong March employment report, the conclusion is that despite higher rates and heightened geopolitical uncertainty, the incoming data is still strong and the Fed will continue to be hawkish until the economy starts to show signs of slowing down.
Source: IRS, Apollo Chief EconomistSource: STR, Haver Analytics, Apollo Chief EconomistSource: OpenTable, Bloomberg, Apollo Chief EconomistSource: TSA, Bloomberg, Apollo Chief EconomistSource: BEA, Haver analytics, Apollo Chief Economist. Note: The weekly values represent the predicted percentage difference from the typical level of spending (prior to the pandemic declared by the World Health Organization on March 11, 2020) after adjusting for day-of-week, month, and year effects, based on daily data. The typical level corresponds to a value of zero.Source: BEA, Haver analytics, Apollo Chief Economist. Note: The weekly values represent the predicted percentage difference from the typical level of spending (prior to the pandemic declared by the World Health Organization on March 11, 2020) after adjusting for day-of-week, month, and year effects, based on daily data. The typical level corresponds to a value of zero.Source: BEA, Haver analytics, Apollo Chief Economist. Note: The weekly values represent the predicted percentage difference from the typical level of spending (prior to the pandemic declared by the World Health Organization on March 11, 2020) after adjusting for day-of-week, month, and year effects, based on daily data. The typical level corresponds to a value of zero.