


The Daily Spark is moving to Apollo.com— read the latest from Torsten Slok here.
Want it delivered daily to your inbox?
-
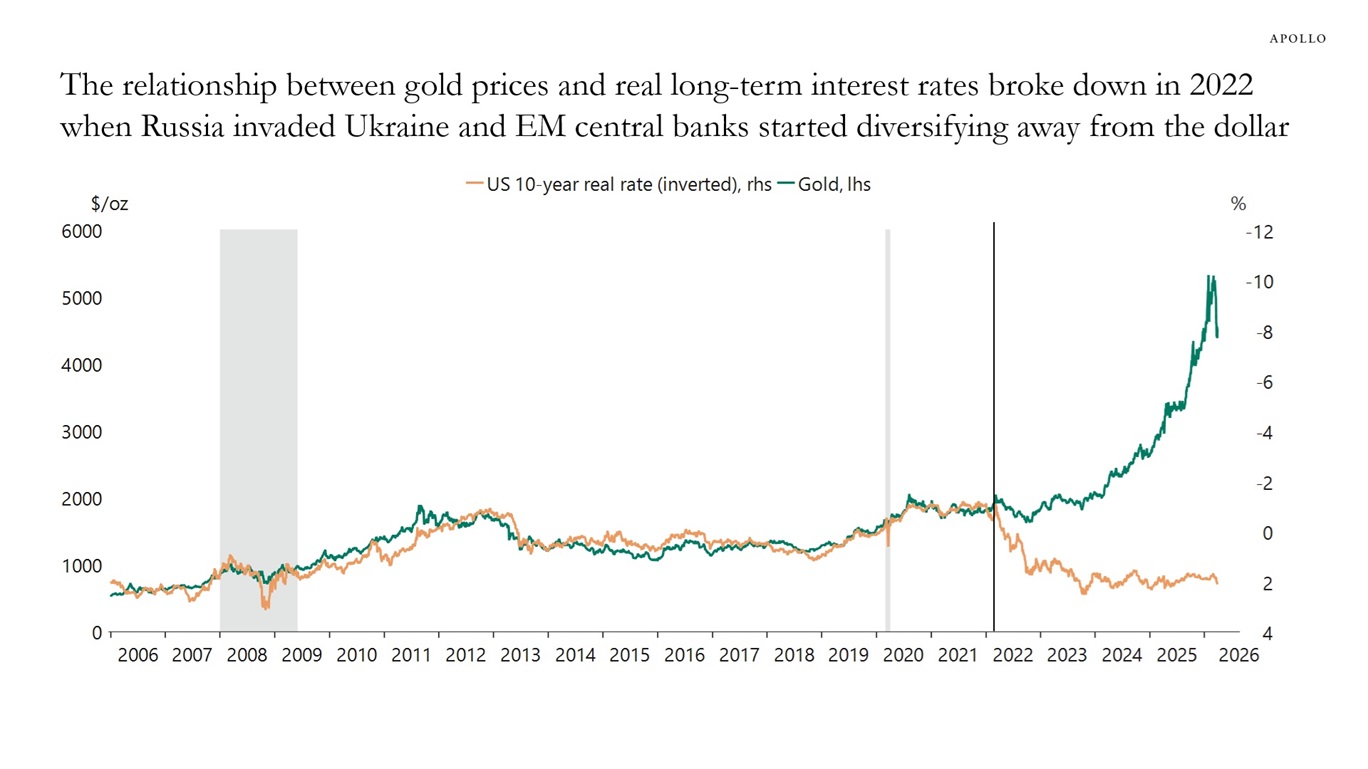
Our chart book (available here) looks at why gold prices have increased so much since 2022, and why they have declined more recently.
Reasons why gold prices started going up in 2022:
- Central bank buying driven by de-dollarization because of sanctions when Russia
invaded Ukraine - Worries about US inflation
- Strong retail demand in India and China accelerated the upward trend
Likely reason why gold prices have declined recently:
- Investors needed liquidity as they experienced losses elsewhere in their portfolios

Sources: Bloomberg, Macrobond, Apollo Chief Economist See important disclaimers at the bottom of the page.
- Central bank buying driven by de-dollarization because of sanctions when Russia
-
See important disclaimers at the bottom of the page.
-
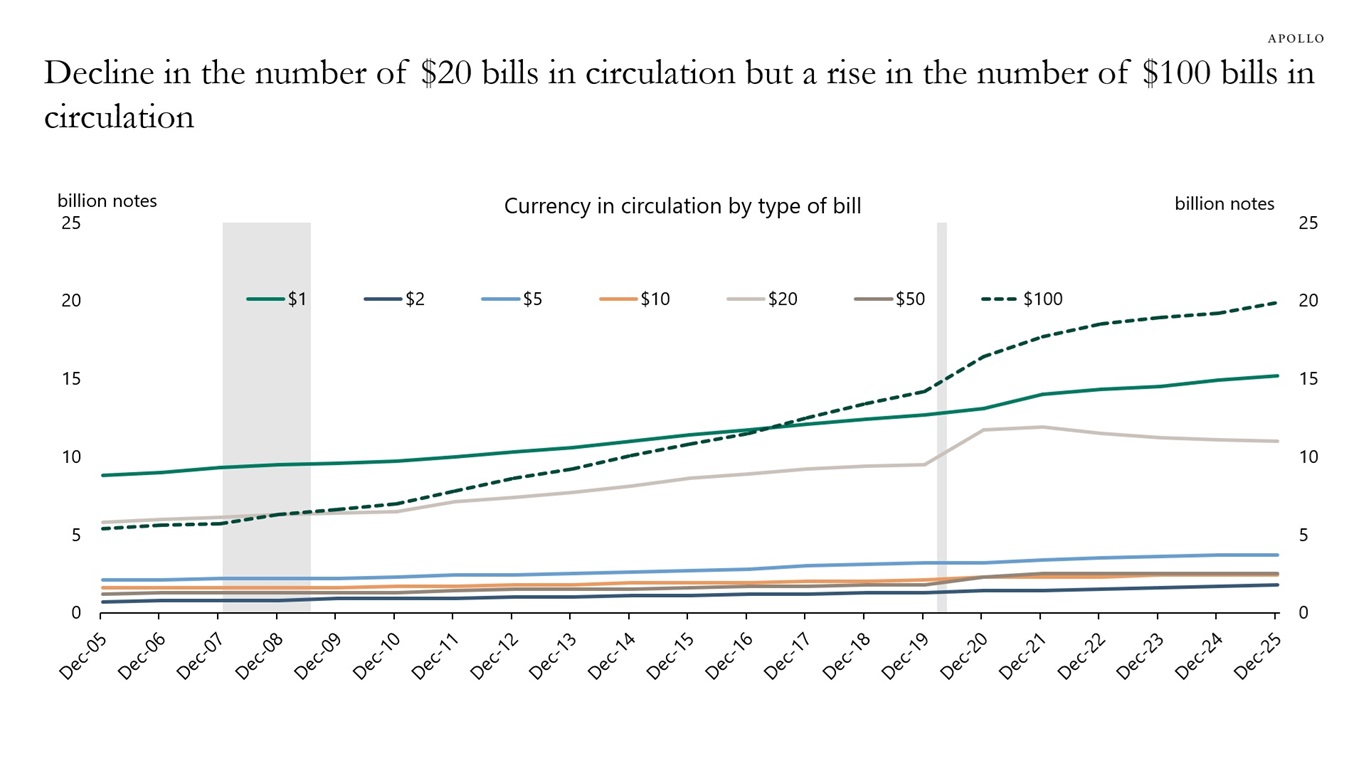
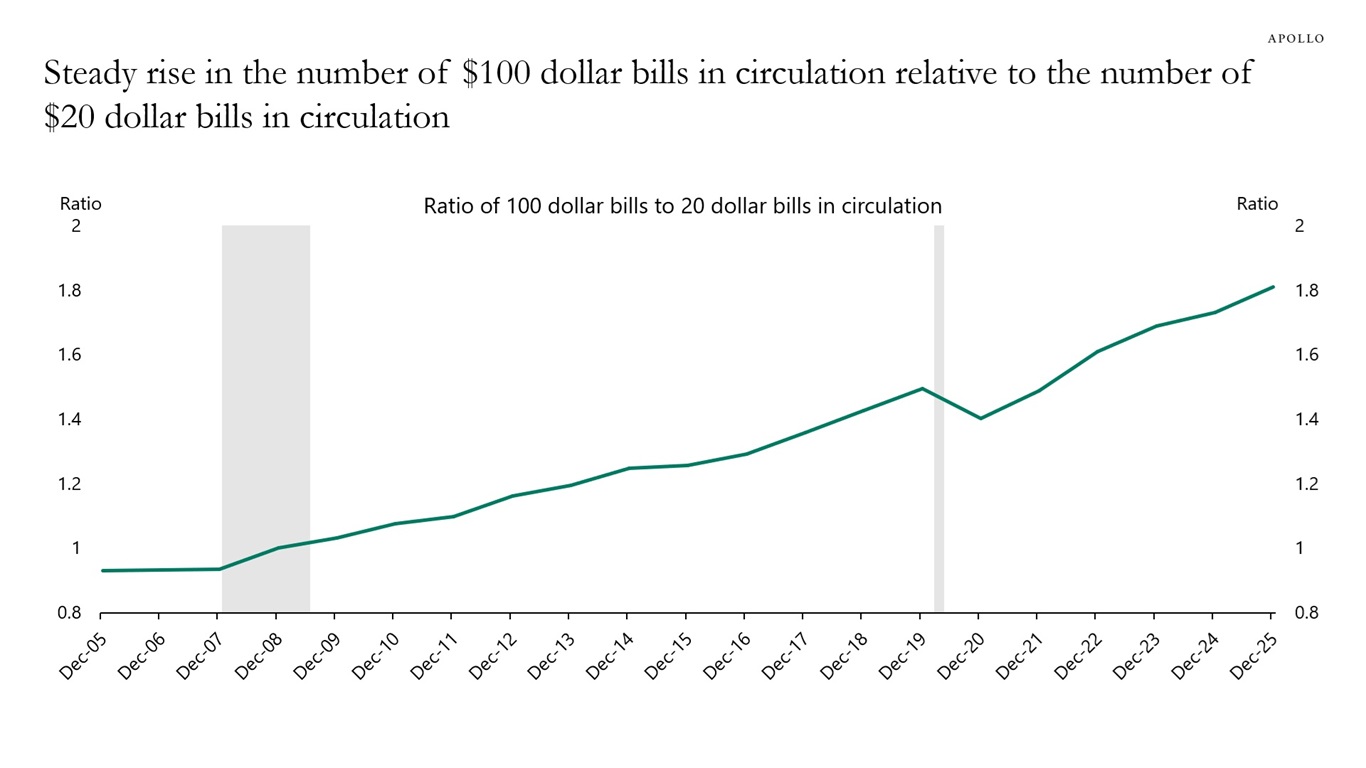
With the proliferation of cashless payments, you would expect the number of bills in circulation to be declining across all denominations. That is indeed the case for $20 bills, see charts below. But the number of $100 bills in circulation keeps rising.

Sources: Federal Reserve Board – Currency in Circulation: Volume, Apollo Chief Economist Sources: Federal Reserve Board – Currency in Circulation: Volume, Apollo Chief Economist See important disclaimers at the bottom of the page.
-
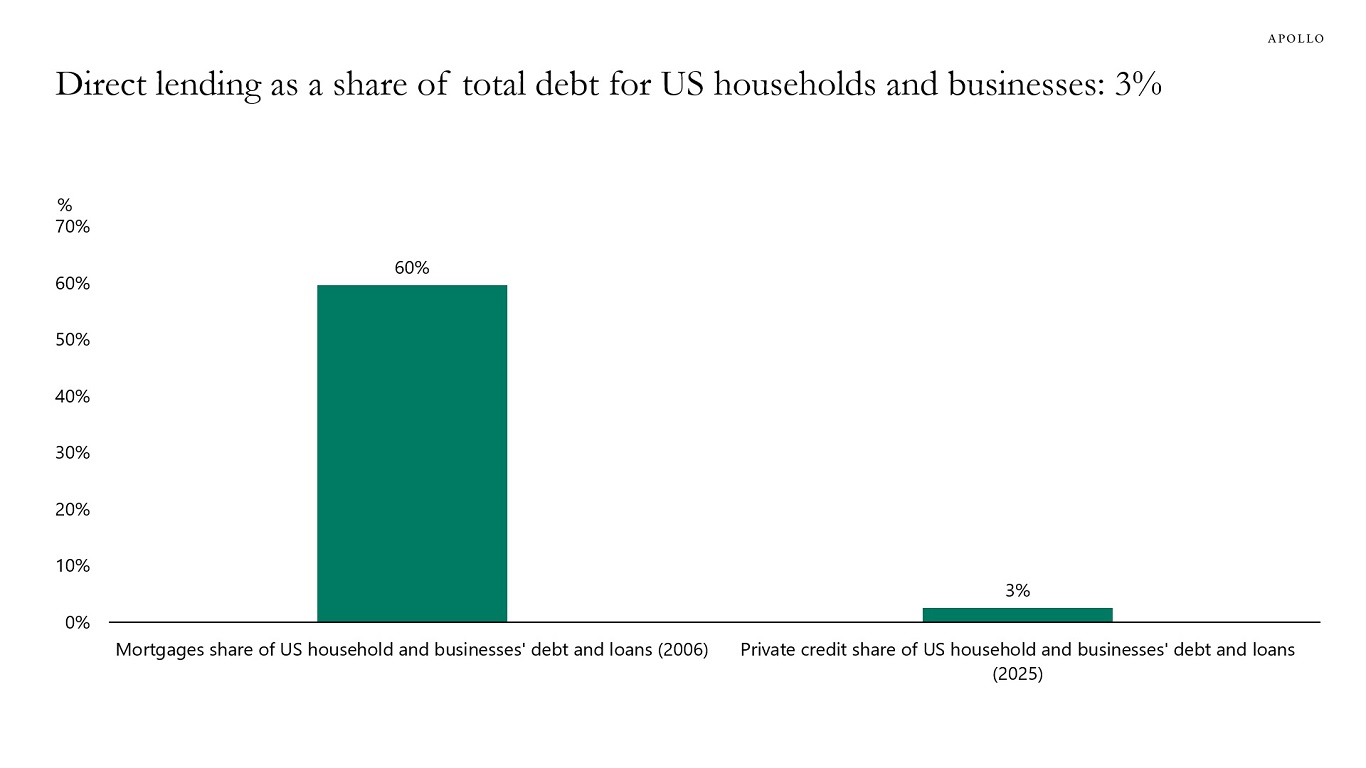
The direct lending market is roughly $2 trillion, or about 3% of total debt outstanding for US households and businesses.
By comparison, mortgages accounted for about 60% of total household and corporate debt at the peak of the housing bubble in 2006.
Sources: Preqin, FRB, Haver Analytics, Apollo Chief Economist See important disclaimers at the bottom of the page.
-
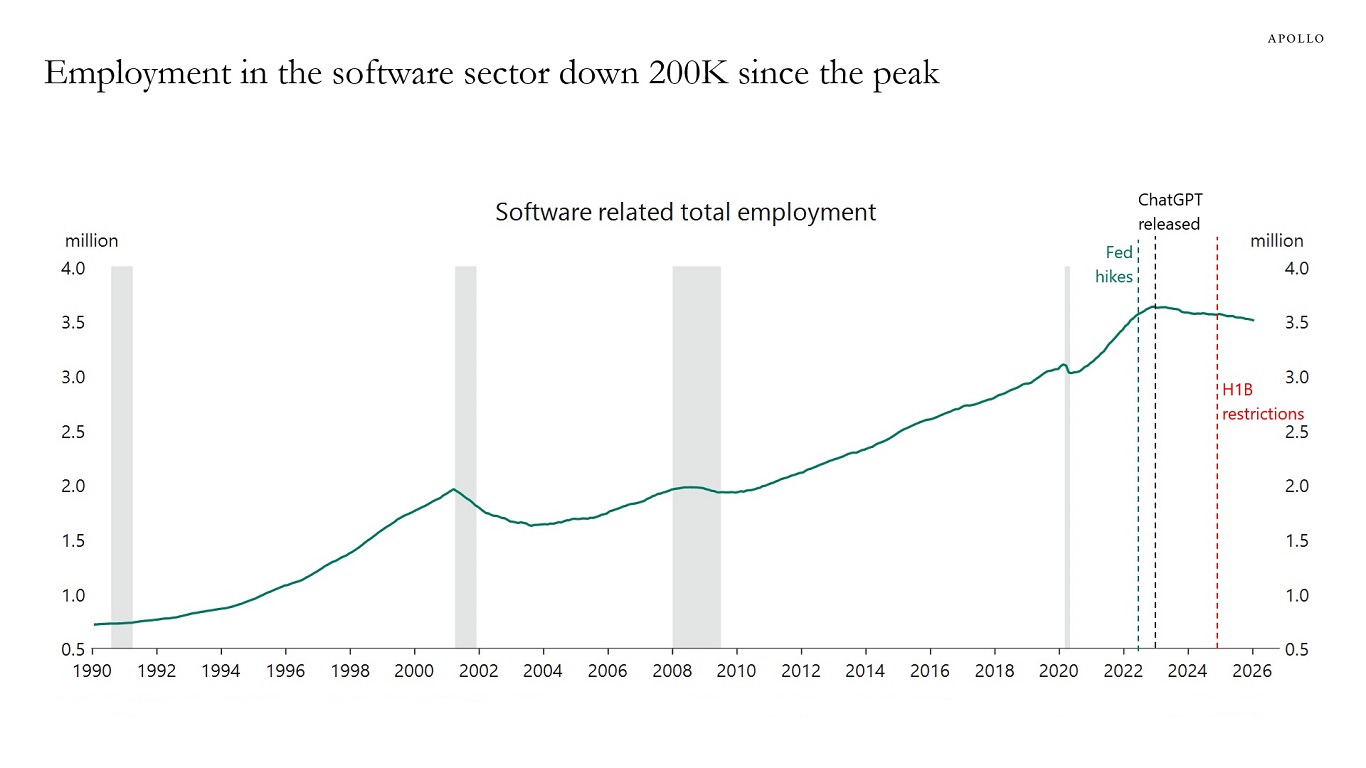
In recent years, employment in the software sector has declined by about 200,000 jobs. The factors driving this decline could include AI, Fed hikes or immigration restrictions, see the first chart below.
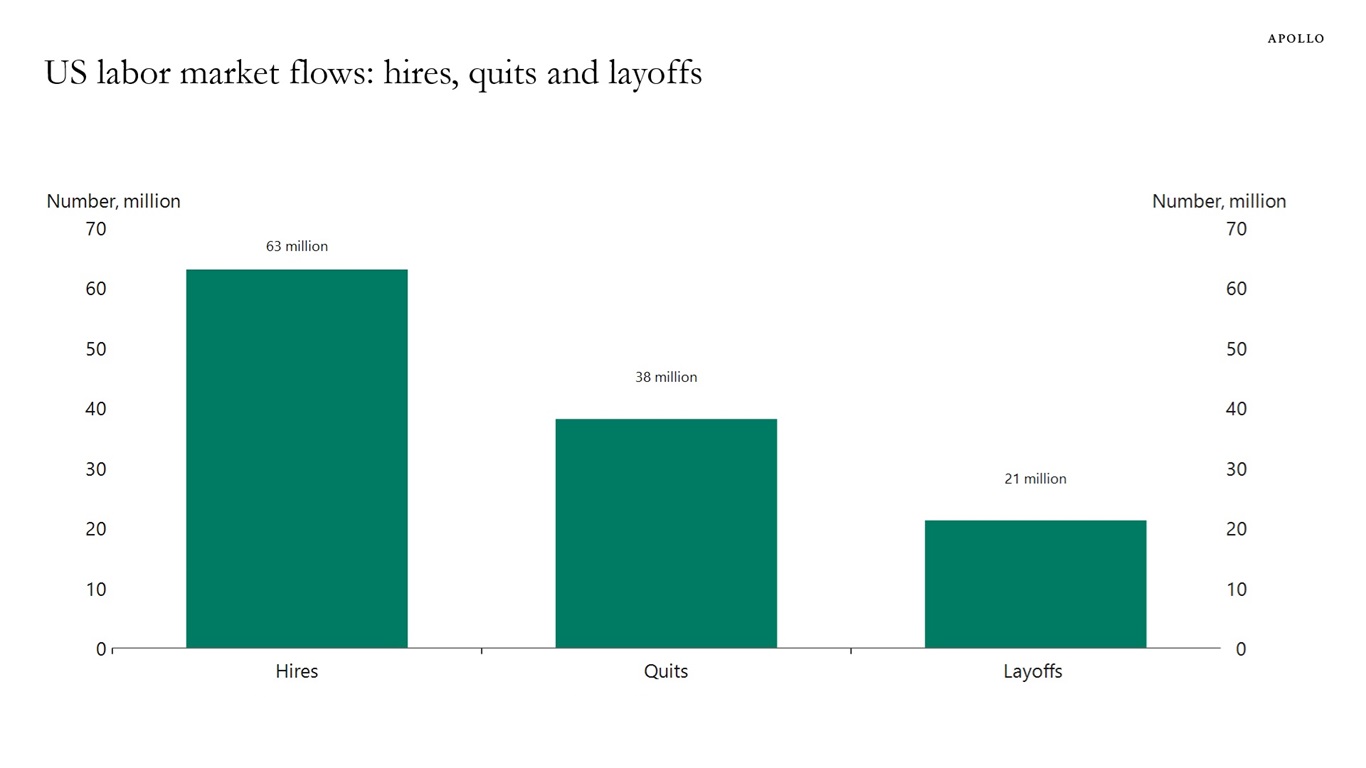
Either way, the 200,000 decline in software employment should be compared with the 63 million people who find a new job each year, the 38 million who voluntarily quit their jobs and the 21 million who are laid off, see the second chart below.
The bottom line is that, regardless of what is driving the decline in software employment, it remains insignificant compared to the broader churn in the labor market.
Note: Includes software publishers, computer system design and related services, and data processing, hosting and related services. Sources: US Bureau of Labor Statistics (BLS), Macrobond, Apollo Chief Economist
Note: Data as of 2025. Sources: US Bureau of Labor Statistics (BLS), Macrobond, Apollo Chief Economist See important disclaimers at the bottom of the page.
-
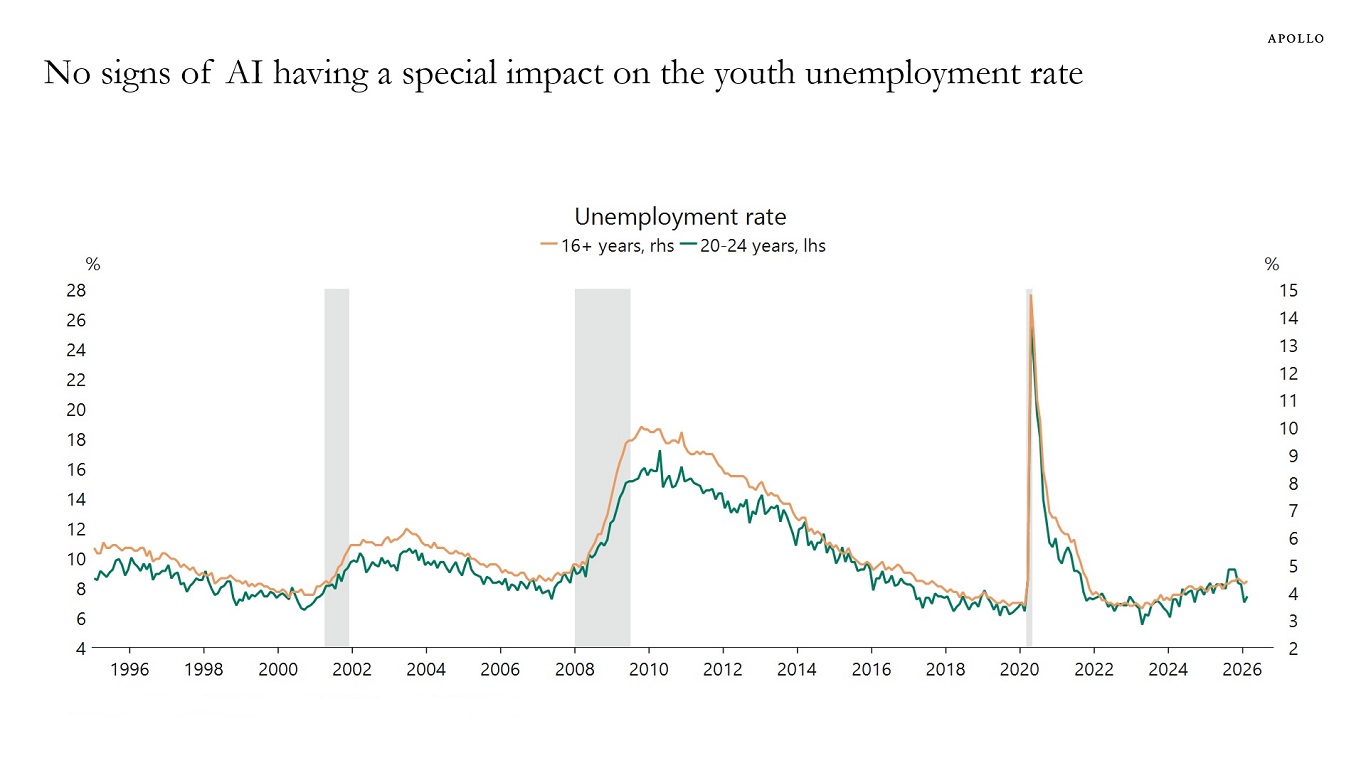
The first chart below compares the unemployment rate for the entire US population with the unemployment rate for people ages 20 to 24. It does not show any sign that unemployment among younger workers is structurally higher because of AI.
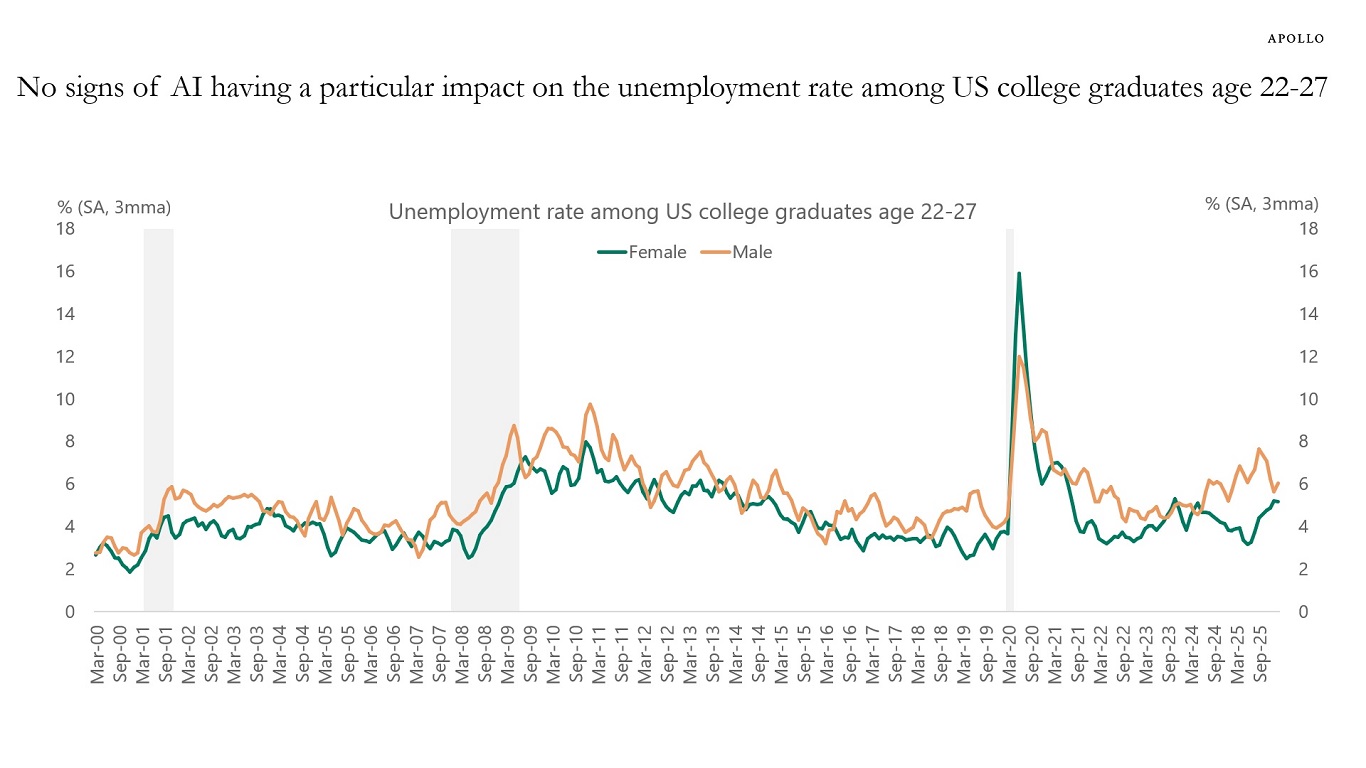
Similarly, the second chart shows the unemployment rate for US college graduates ages 22 to 27. The unemployment rate has increased for men, but it has recently converged toward the unemployment rate for women. For women, since ChatGPT was released, the unemployment rate has been moving lower, and more recently it has increased slightly again.
The bottom line is that there is no sign that AI is increasing unemployment among younger workers, and there is also no sign that young people or recent college graduates are having a harder time finding jobs at the moment than other demographics.
Sources: US Bureau of Labor Statistics (BLS), Macrobond, Apollo Chief Economist Sources: BLS, Apollo Chief Economist See important disclaimers at the bottom of the page.
-
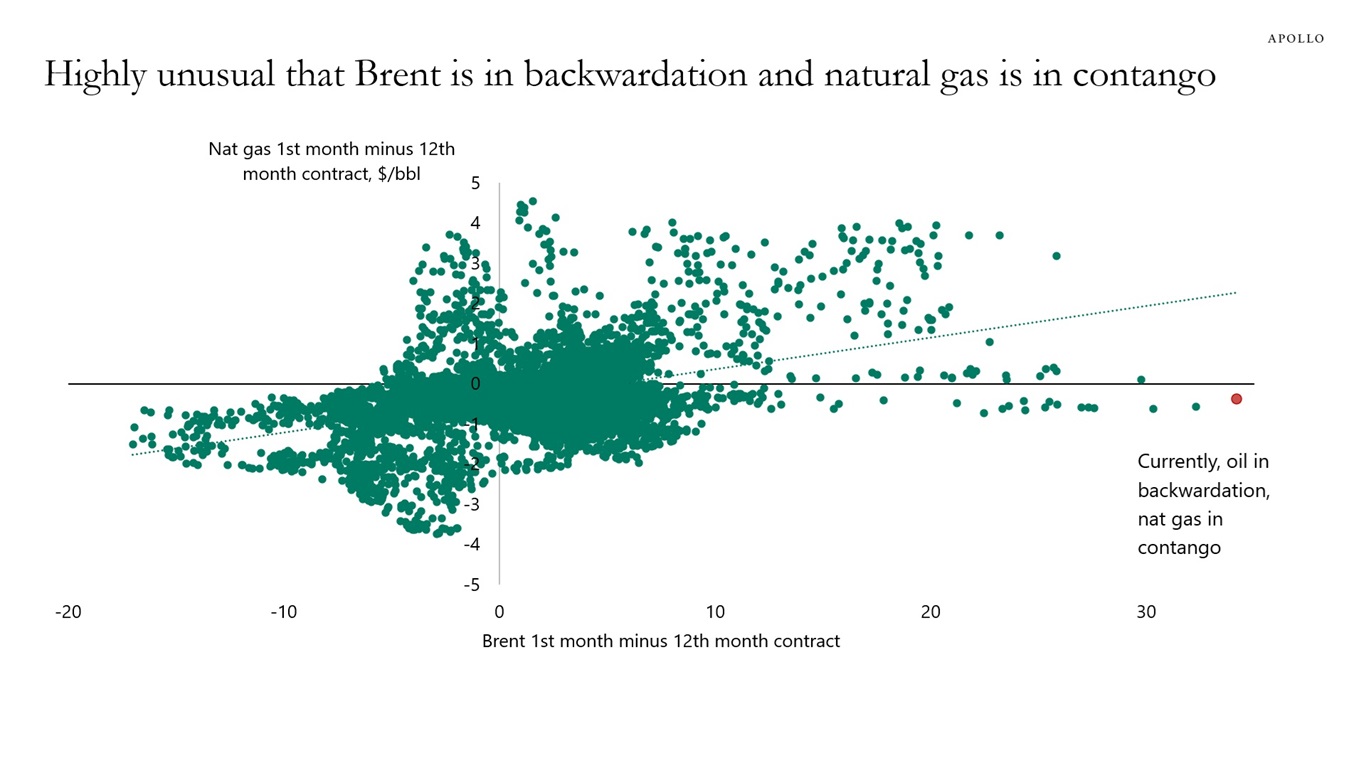
Oil markets are signaling near-term stress while natural gas markets are signaling near-term oversupply, a combination that is almost never seen, see chart below.
Our chart book looking at energy demand and supply and the Strait of Hormuz is available here.
Sources: Bloomberg, Apollo Chief Economist See important disclaimers at the bottom of the page.
-
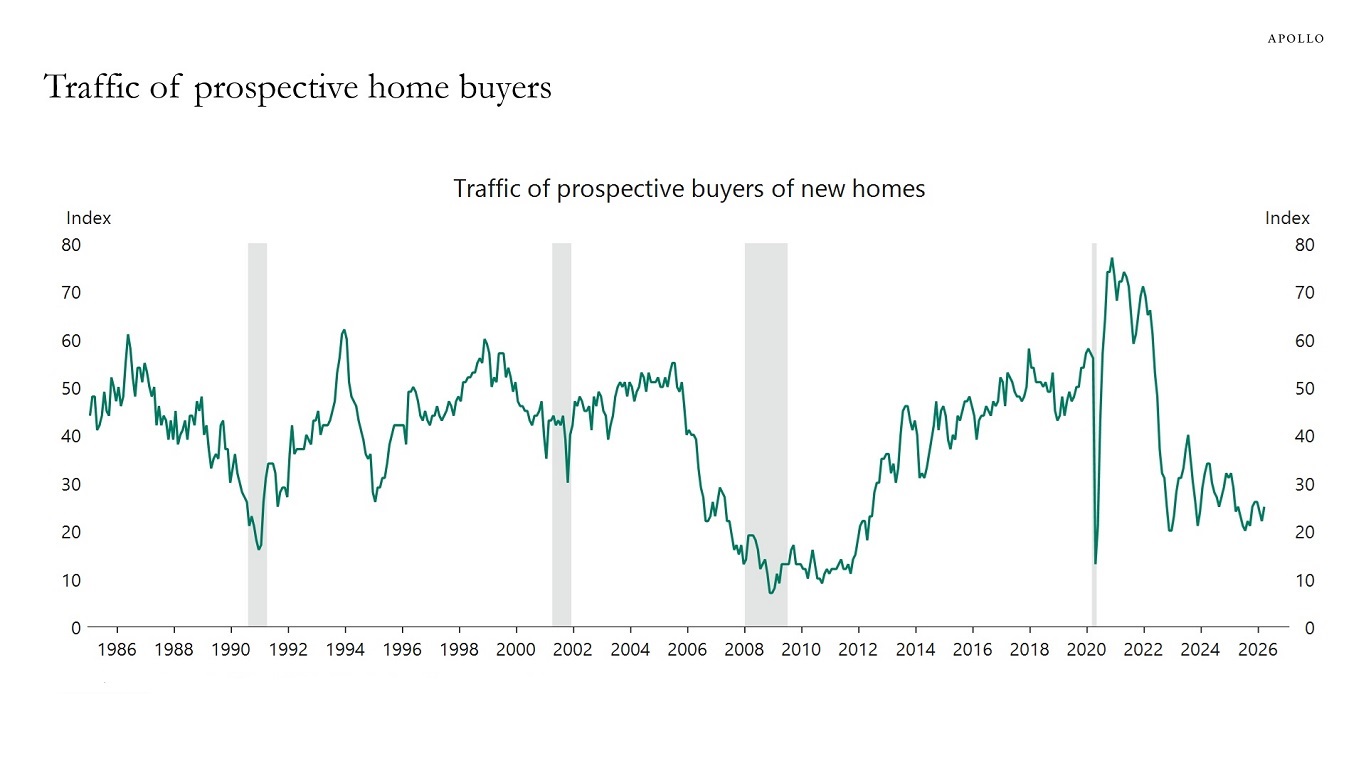
In our latest US housing outlook, available here, we look at demand and supply in the housing market.
Sources: National Association of Home Builders, Macrobond, Apollo Chief Economist See important disclaimers at the bottom of the page.
-
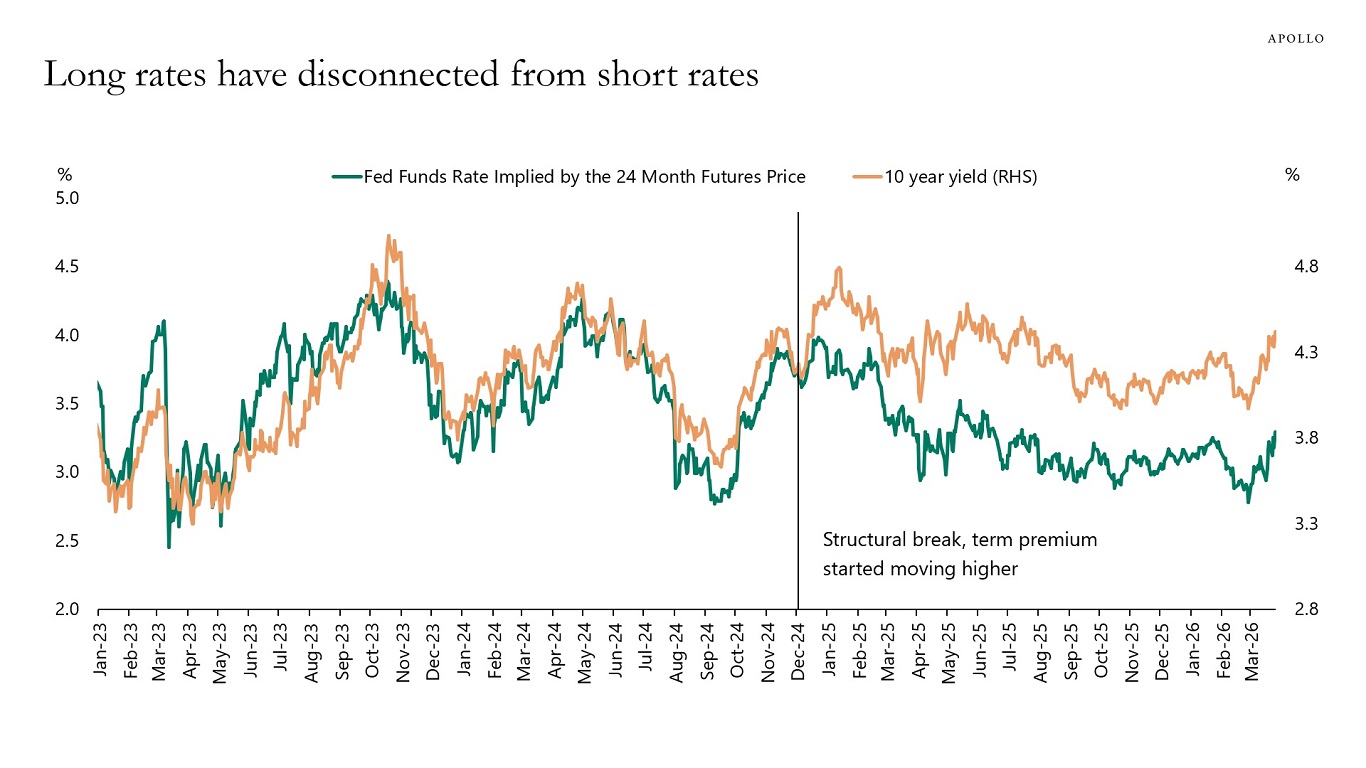
Long-term interest rates are normally driven by Fed expectations.
But a premium has emerged, and 10-year rates today should not be at 4.4%, but instead at 3.9%, see chart below.
The sources of the rise in the term premium could be fiscal worries, QT, lower foreign demand or concerns about Fed independence, including the possibility that the Fed could in the future raise the inflation target, leading to greater inflation variability.
The bottom line is that the 10-year yield is 55 bps higher than where it should be, and investors need to think about why.
For more discussion see also Fed papers here, here and here.
Sources: Haver Analytics, Apollo Chief Economist See important disclaimers at the bottom of the page.
-
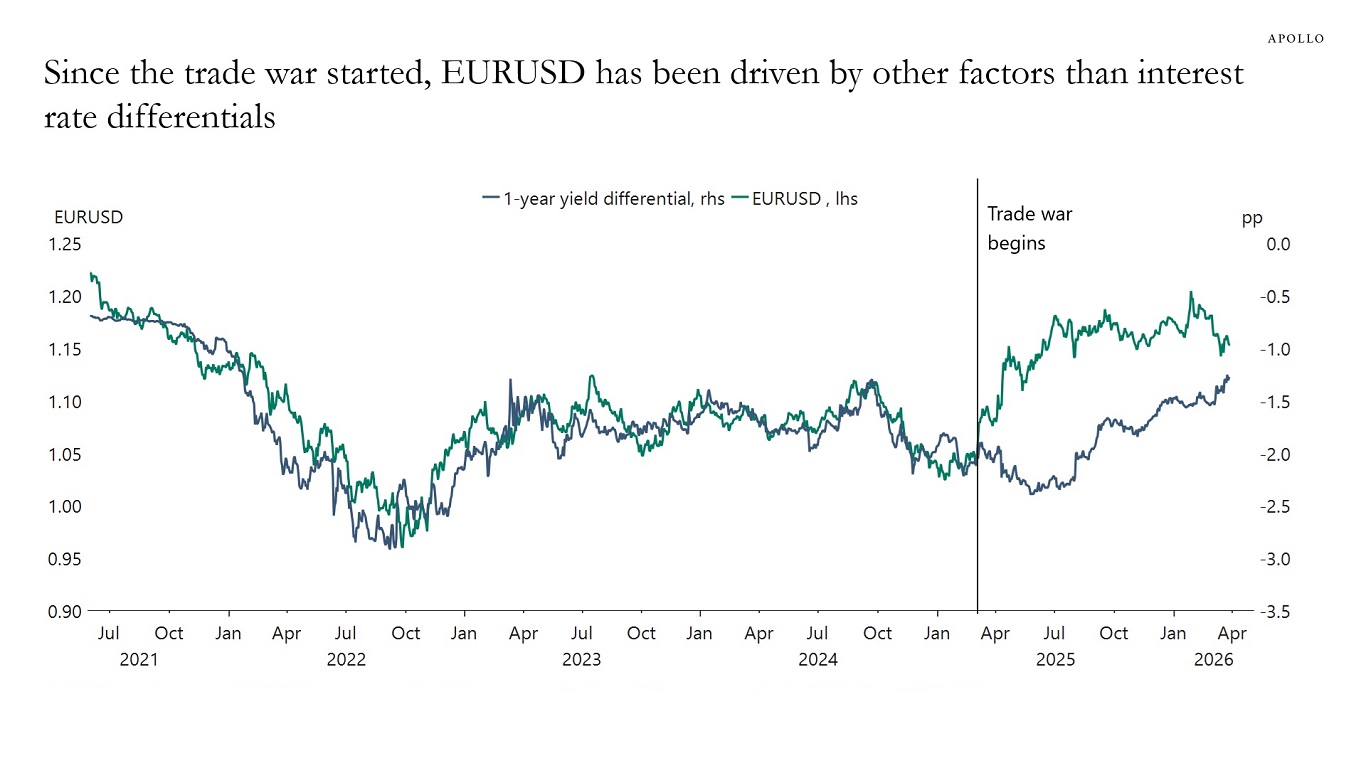
Since the trade war began, the dollar has traded weaker than interest-rate differentials would have predicted, see chart below. We expect to see convergence between FX and yield differentials as higher-for-longer rates in the US continue to attract investment from abroad and put upward pressure on the dollar.
Note: 1-year yield differential = 1-year German government bill minus 1-year US T-bill. pp = percentage points. Sources: Bloomberg, Macrobond, Apollo Chief Economist See important disclaimers at the bottom of the page.

This presentation may not be distributed, transmitted or otherwise communicated to others in whole or in part without the express consent of Apollo Global Management, Inc. (together with its subsidiaries, “Apollo”).
Apollo makes no representation or warranty, expressed or implied, with respect to the accuracy, reasonableness, or completeness of any of the statements made during this presentation, including, but not limited to, statements obtained from third parties. Opinions, estimates and projections constitute the current judgment of the speaker as of the date indicated. They do not necessarily reflect the views and opinions of Apollo and are subject to change at any time without notice. Apollo does not have any responsibility to update this presentation to account for such changes. There can be no assurance that any trends discussed during this presentation will continue.
Statements made throughout this presentation are not intended to provide, and should not be relied upon for, accounting, legal or tax advice and do not constitute an investment recommendation or investment advice. Investors should make an independent investigation of the information discussed during this presentation, including consulting their tax, legal, accounting or other advisors about such information. Apollo does not act for you and is not responsible for providing you with the protections afforded to its clients. This presentation does not constitute an offer to sell, or the solicitation of an offer to buy, any security, product or service, including interest in any investment product or fund or account managed or advised by Apollo.
Certain statements made throughout this presentation may be “forward-looking” in nature. Due to various risks and uncertainties, actual events or results may differ materially from those reflected or contemplated in such forward-looking information. As such, undue reliance should not be placed on such statements. Forward-looking statements may be identified by the use of terminology including, but not limited to, “may”, “will”, “should”, “expect”, “anticipate”, “target”, “project”, “estimate”, “intend”, “continue” or “believe” or the negatives thereof or other variations thereon or comparable terminology.