


Want it delivered daily to your inbox?
-
The chart book we used during our conference call yesterday is available here.
Source: Apollo Chief Economist See important disclaimers at the bottom of the page.
-
The table below shows our estimates of the impact on US GDP and inflation of tariffs and the decline in consumer sentiment and corporate sentiment.
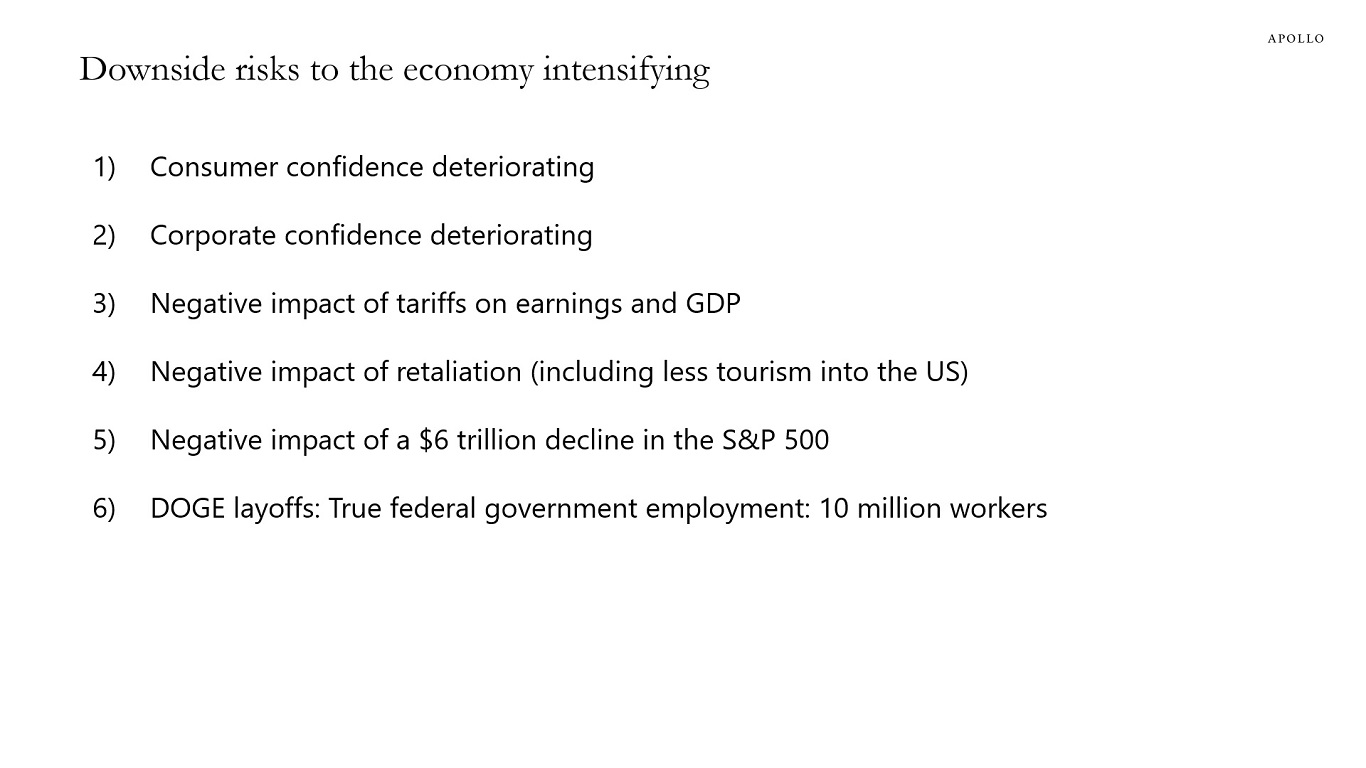
Whether we will have a recession or not depends on the duration of this shock. If these levels of tariffs stay in place for several months and other countries retaliate, it will cause a recession in the US and the rest of the world.
We will be discussing the outlook for the economy and markets on a conference call today at 9 am EDT, you can register here.
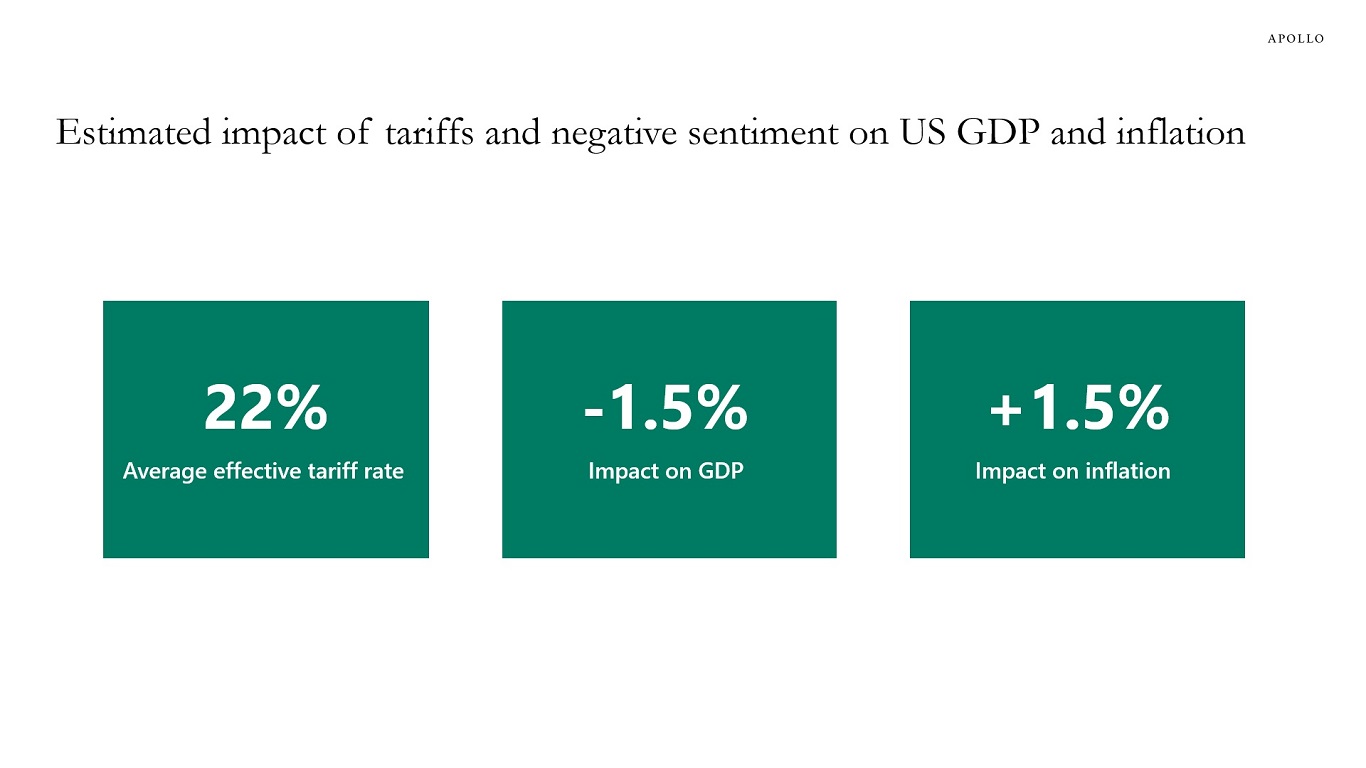
Note: Includes Chinese tariffs from February and March, Canada and Mexico non-USMCA compliant goods tariffs from March, Steel, Aluminum and Auto imports and reciprocal tariffs on all countries announced in April. Source: Apollo Chief Economist See important disclaimers at the bottom of the page.
-
When policy uncertainty went up, capital markets activity started slowing down, with a decline in loan issuance, IPO activity, and M&A activity, see charts below.
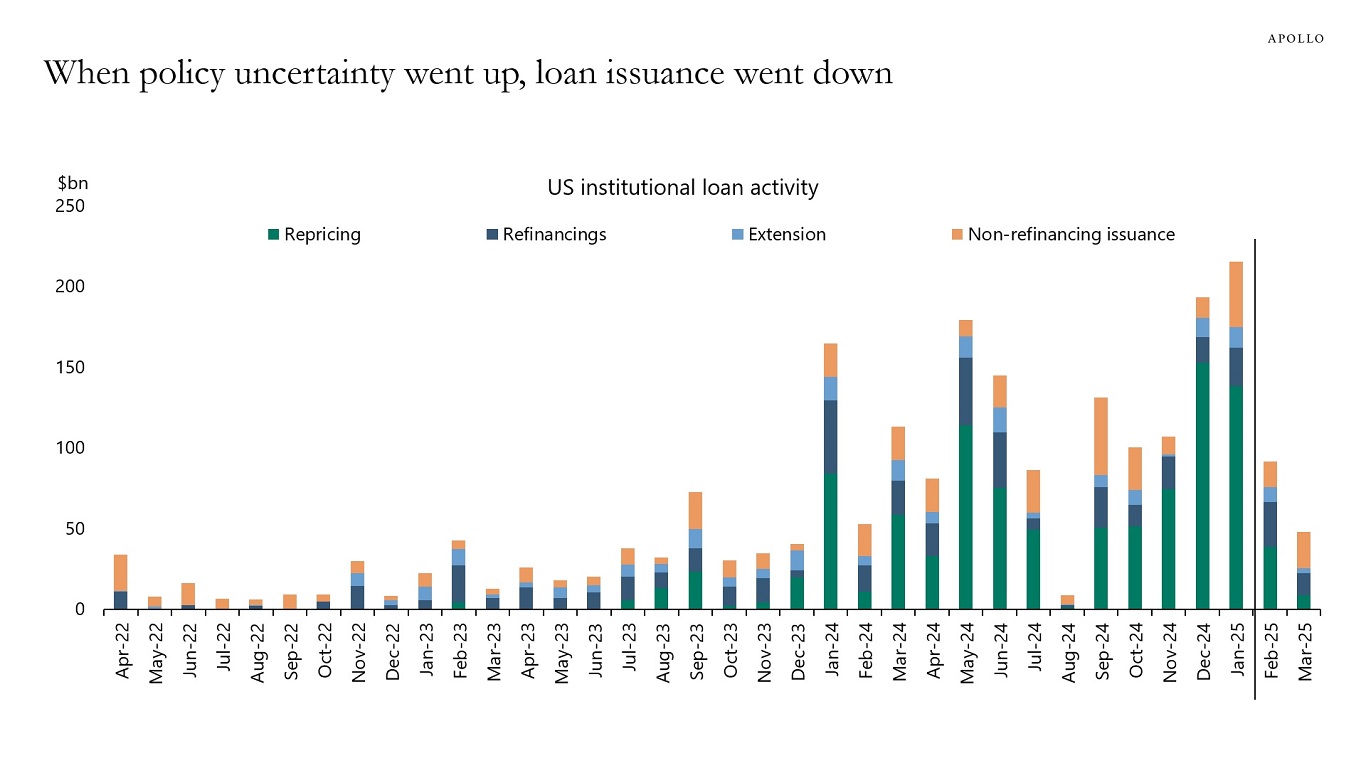
Note: Reflects repricings and extensions done via an amendment process only. Sources: PitchBook LCD, Apollo Chief Economist 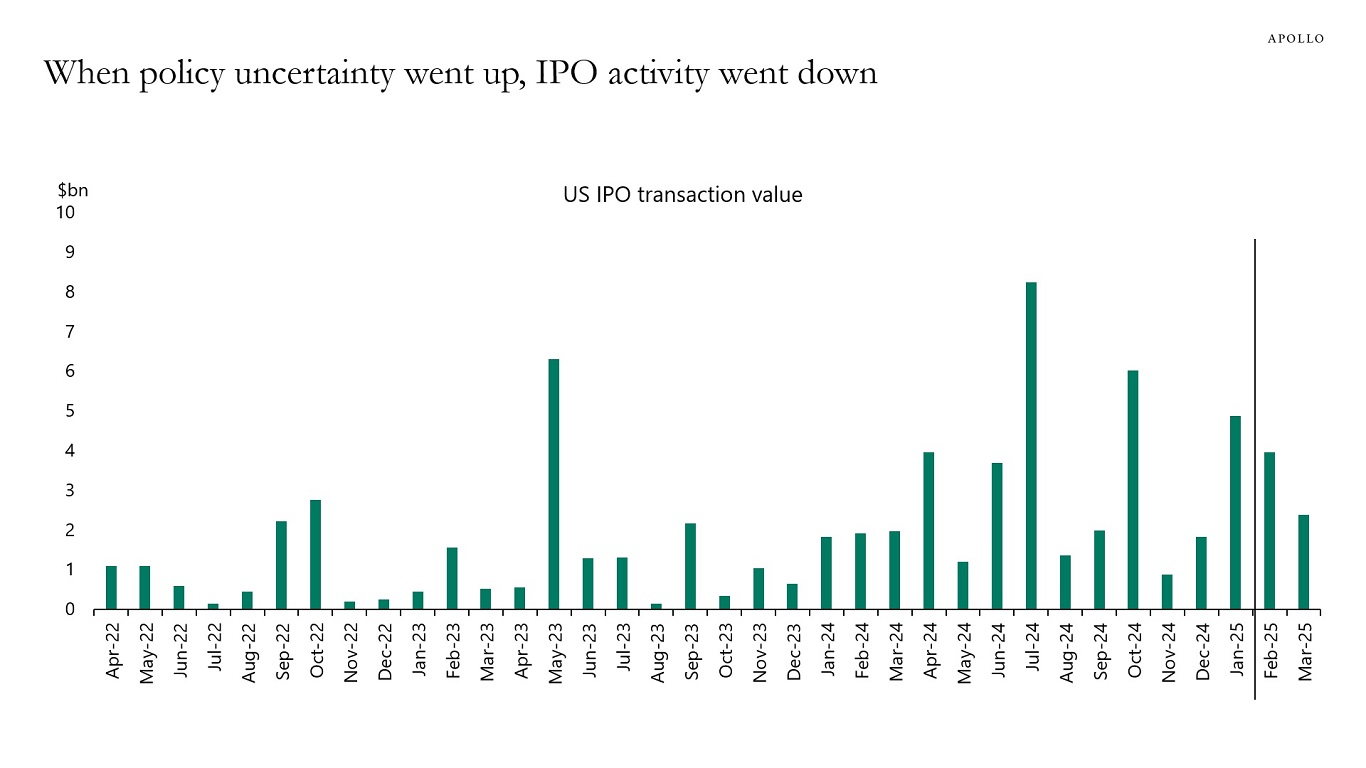
Note: Data shows completed IPO transactions. Sources: S&P Capital IQ, Apollo Chief Economist 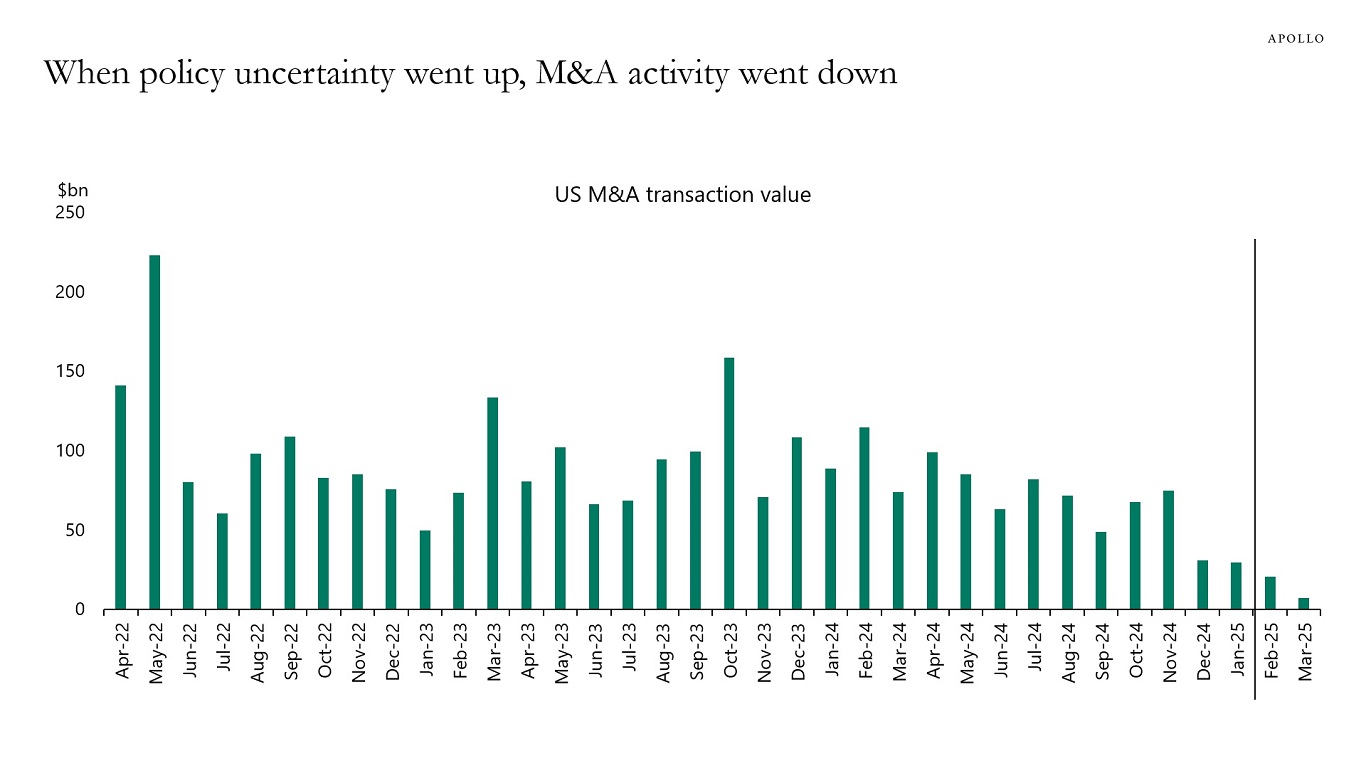
Note: Data shows completed M&A transactions. Sources: S&P Capital IQ, Apollo Chief Economist 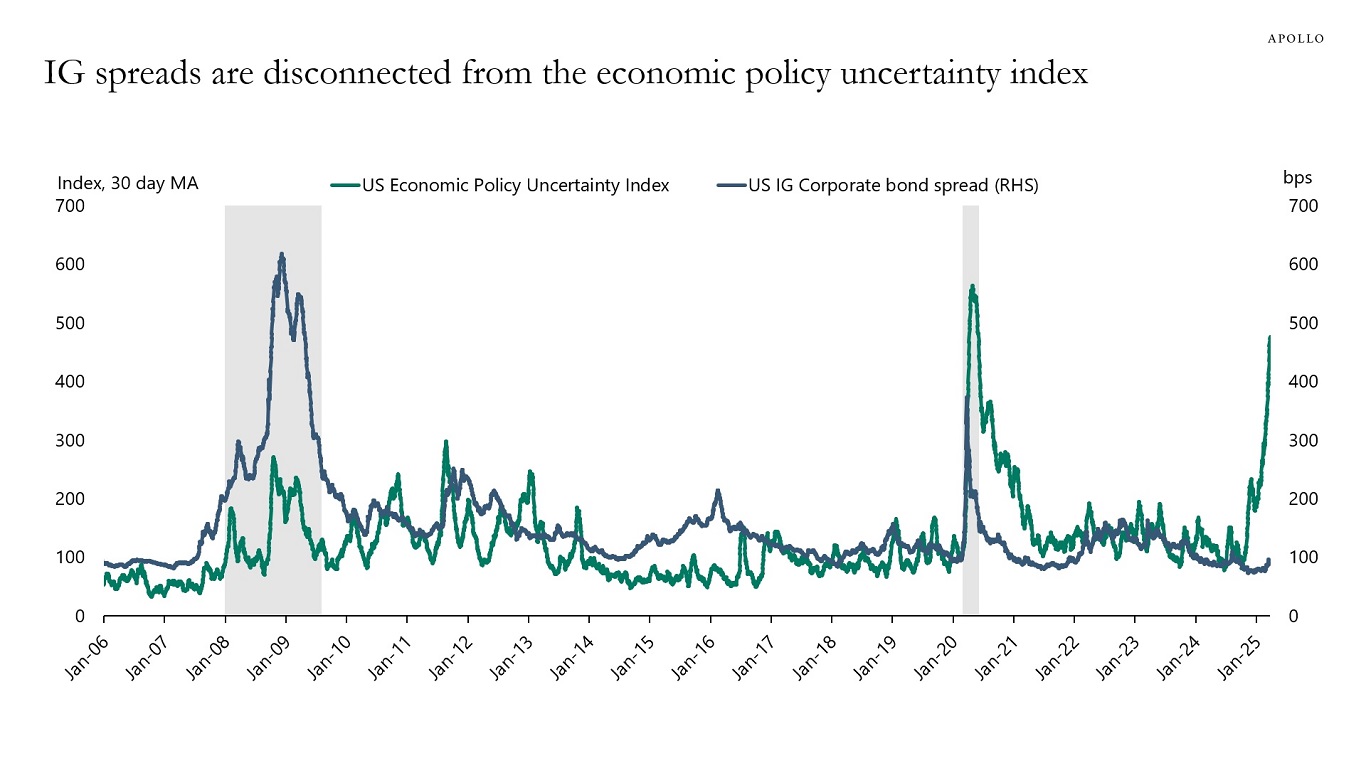
Sources: Bloomberg, Apollo Chief Economist See important disclaimers at the bottom of the page.
-
Surveys of CEOs and CFOs show that corporate confidence has declined in recent months, see charts below.
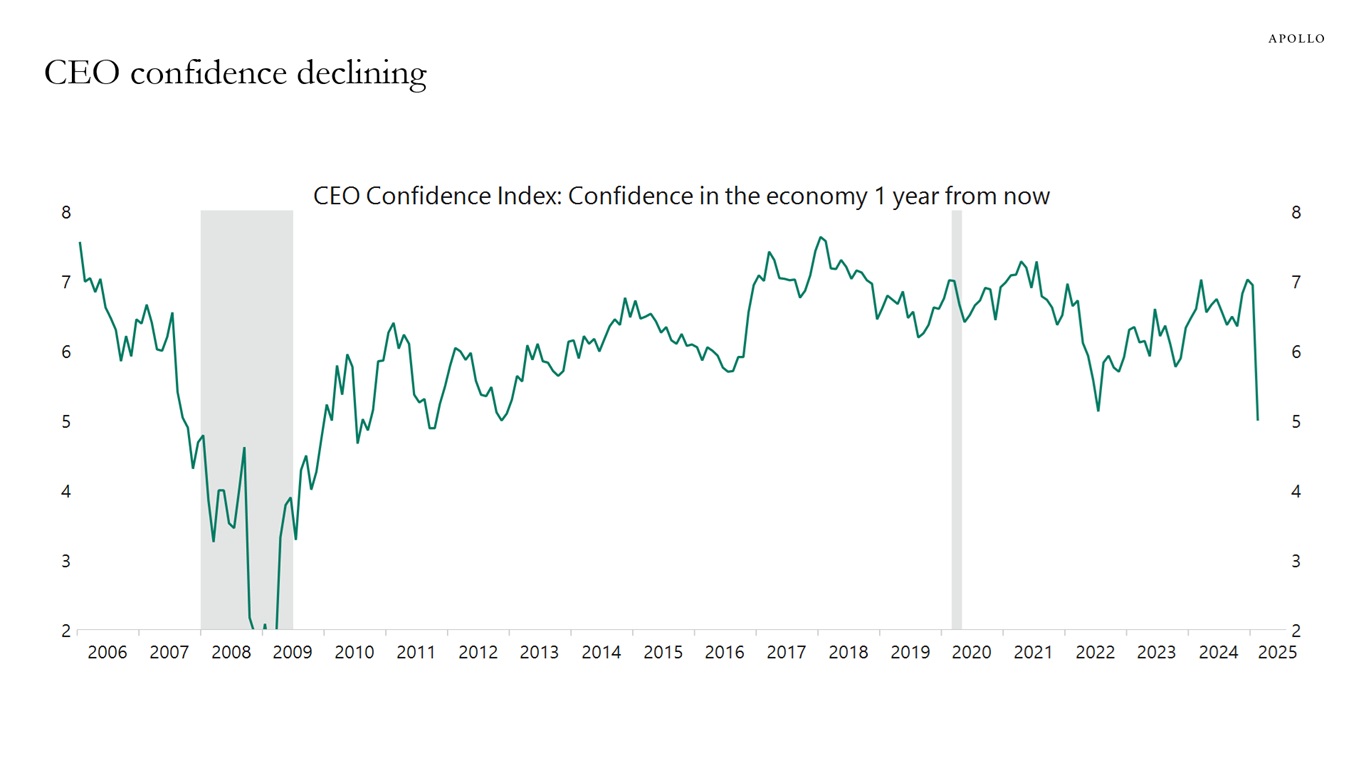
Sources: Chief Executive Magazine, Bloomberg, Macrobond, Apollo Chief Economist 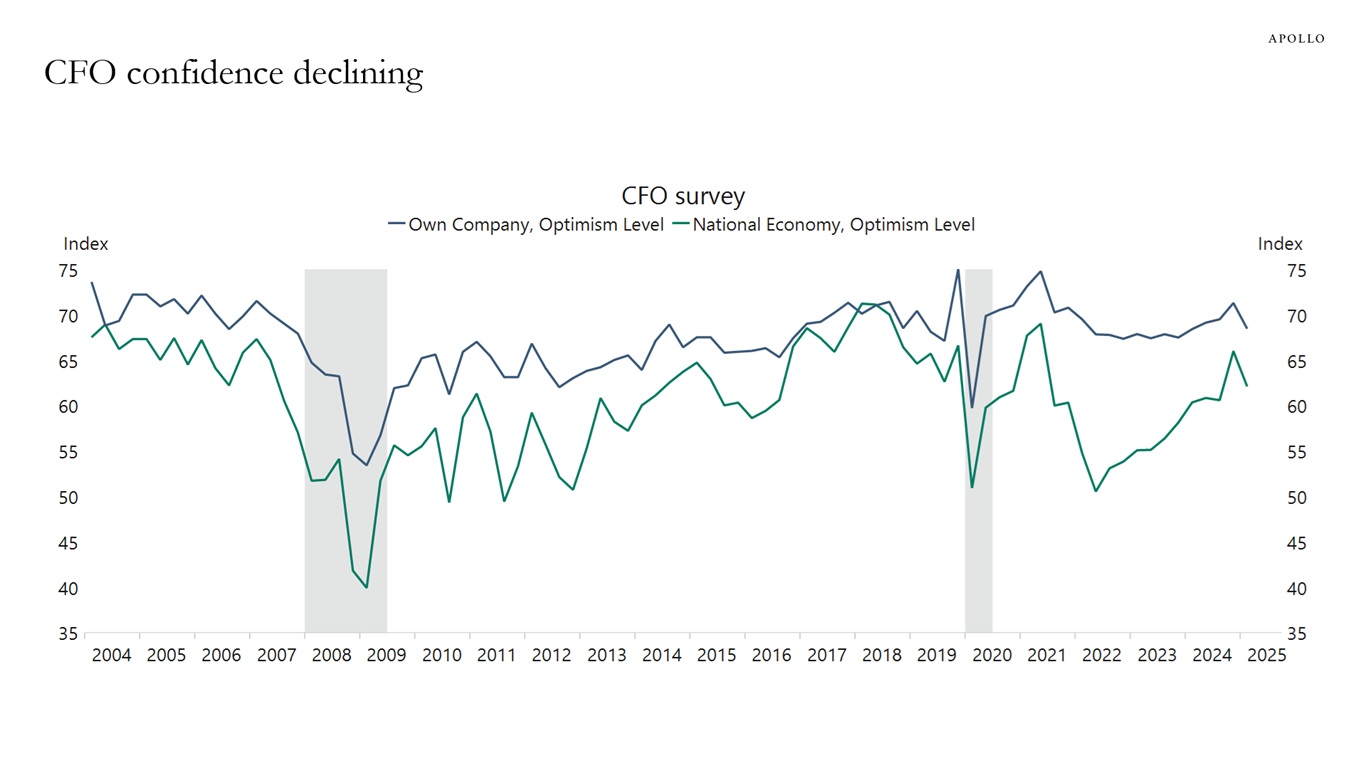
Sources: Duke University & FRB Richmond & FRB Atlanta, Macrobond, Apollo Chief Economist See important disclaimers at the bottom of the page.
-
If uncertainty stays elevated for an extended period, it will have a more negative impact on the economy, see chart below, which shows the impulse responses of a temporary and a permanent shock to economic policy uncertainty in a vector autoregression model with GDP and economic policy uncertainty.

Note: Impulse response from the VAR model with variables log (Real GDP) and log (Economic Policy uncertainty index). A one standard deviation shock to economic policy uncertainty leads to a -0.2% point decline in Real GDP. Temporary shock is defined as a four standard deviation shock in Q1, and permanent shock is defined as a four standard deviation shock in Q1, three standard deviation shock in Q2, two standard deviation shock in Q3, and one standard deviation shock in Q4. Sources: Bloomberg, Apollo Chief Economist See important disclaimers at the bottom of the page.
-
Household sector leverage and banking sector leverage have declined significantly since 2008, see chart below. Over the same period, federal government leverage has increased significantly, and corporate leverage has moved sideways.
The bottom line is that the private sector in the US is in incredibly good shape.
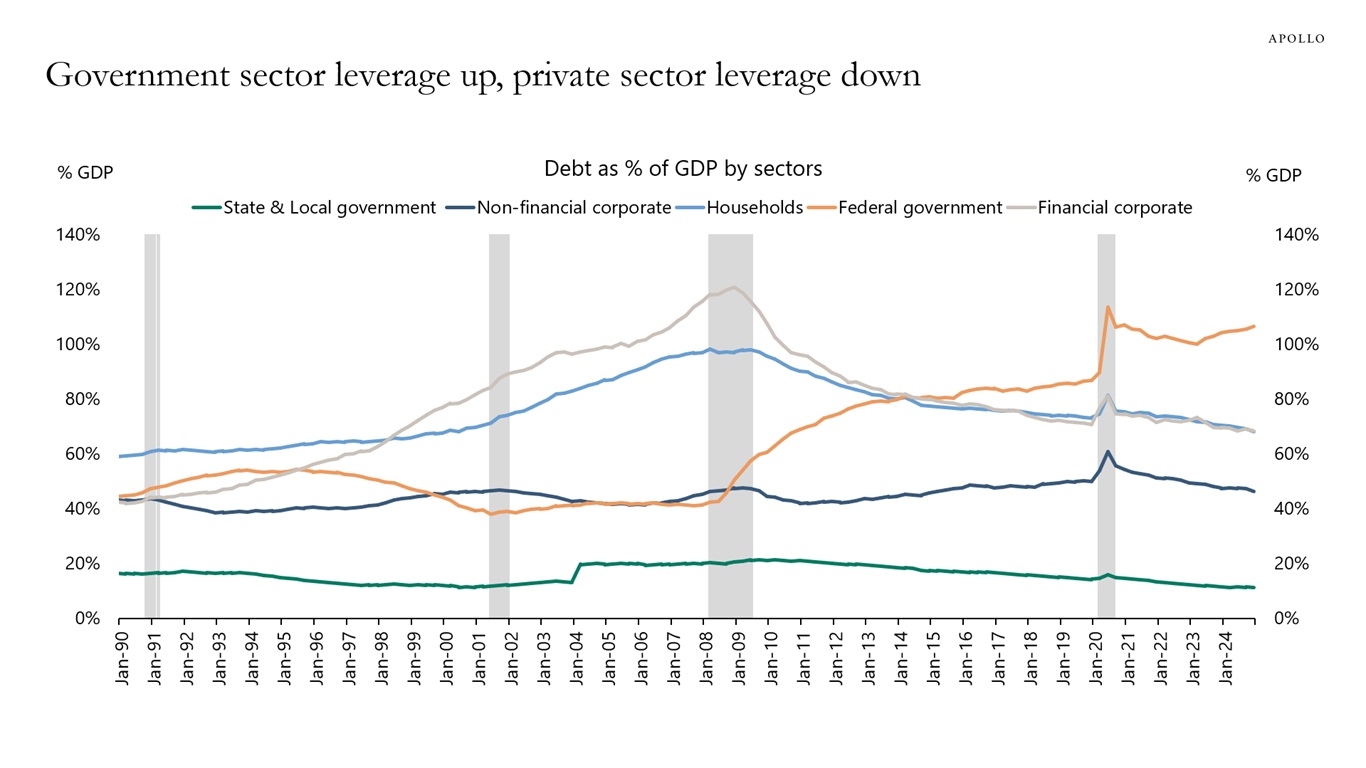
Sources: Federal Reserve Board, NBER, Haver Analytics, Apollo Chief Economist See important disclaimers at the bottom of the page.
-
The IMF is forecasting that next year, income per capita will be higher in Poland than in Japan, see chart below.
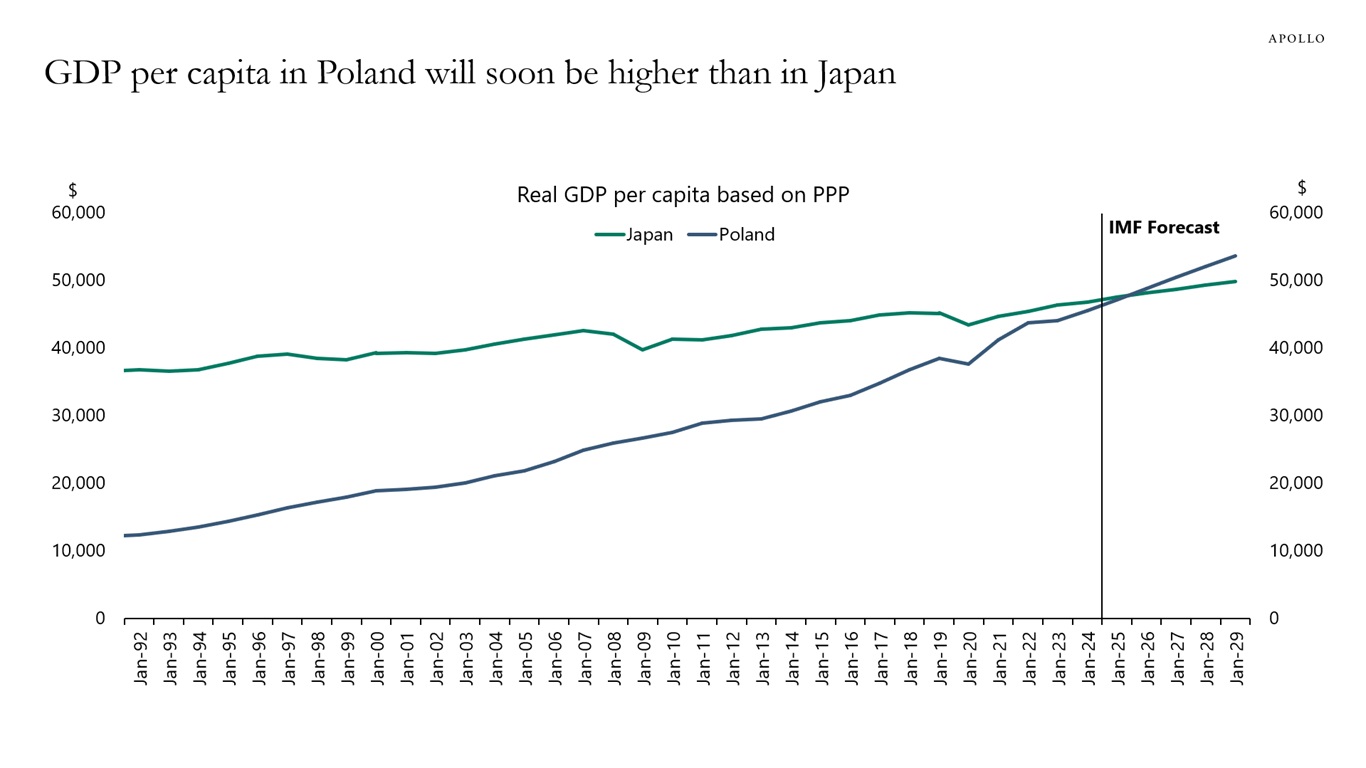
Note: PPP = Purchasing Power Parity. Sources: IMF, Bloomberg, Apollo Chief Economist See important disclaimers at the bottom of the page.
-
Twenty percent of households in their 40s and 50s have borrowed money from their 401(k) retirement account, see chart below.
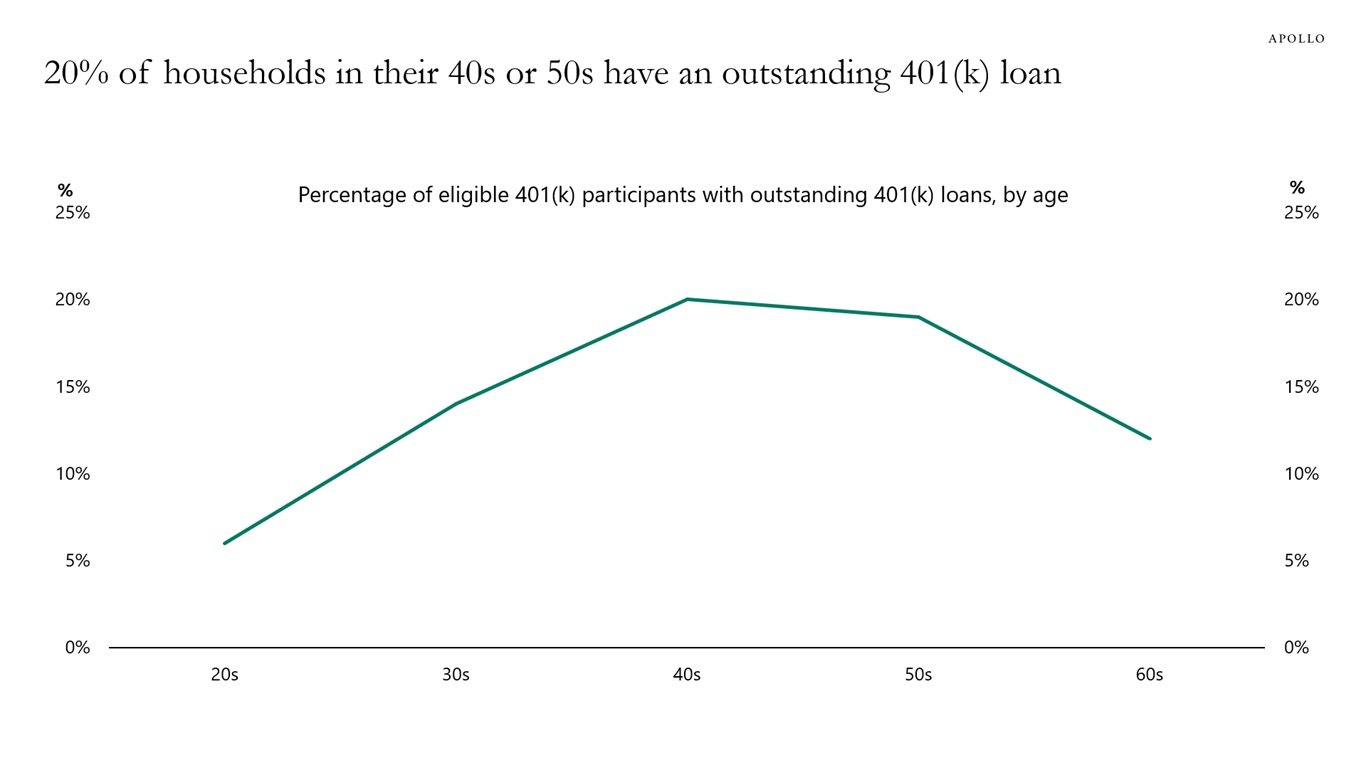
Note: Data as of 2022. Sources: EBRI/CI Participant-Directed Retirement Plan Data Collection Project, Apollo Chief Economist See important disclaimers at the bottom of the page.
-
Tariffs can be used to boost the size of the US manufacturing sector.
But tariffs, unfortunately, have two short-term negative effects on the economy:
- Elevated uncertainty has a negative impact on household and corporate spending decisions.
- Tariffs have a negative impact on corporate earnings as companies experience higher production costs.
Uncertainty may have declined modestly in recent weeks, but the next step is for tariffs to begin to have a negative impact on corporate earnings over the coming quarters. Combined with the risk of retaliation, this is negative for the S&P 500.
The bottom line is that the incoming data remains solid, but the soft data is deteriorating. With tariffs not going away, the observed weakness in the soft data should be expected to spill over to weakness in the hard data over the coming months. The next important data point is the March employment report, which will be released on Friday, April 4. The survey week for the employment report was the week of March 12, when tariff uncertainty was very elevated.
The performance of the S&P 500 will depend on the size of the adjustment costs as companies adjust to a new situation with permanently higher tariffs, see chart below.
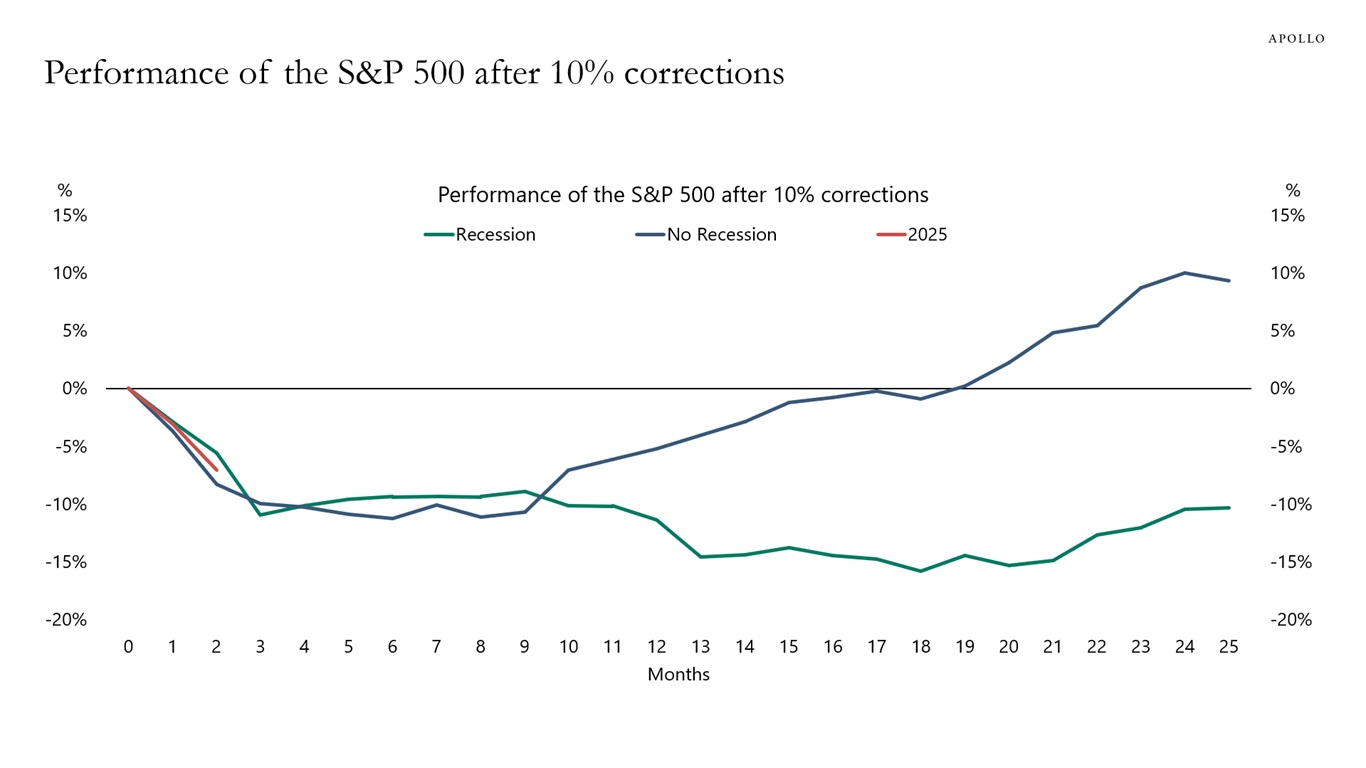
Note: Using periods with 10% correction and categorizing them if they were followed by a recession. Sources: Bloomberg, Apollo Chief Economist See important disclaimers at the bottom of the page.
-
The recent decline in semiconductor stocks points to a coming slowdown in semiconductor sales, see chart below.
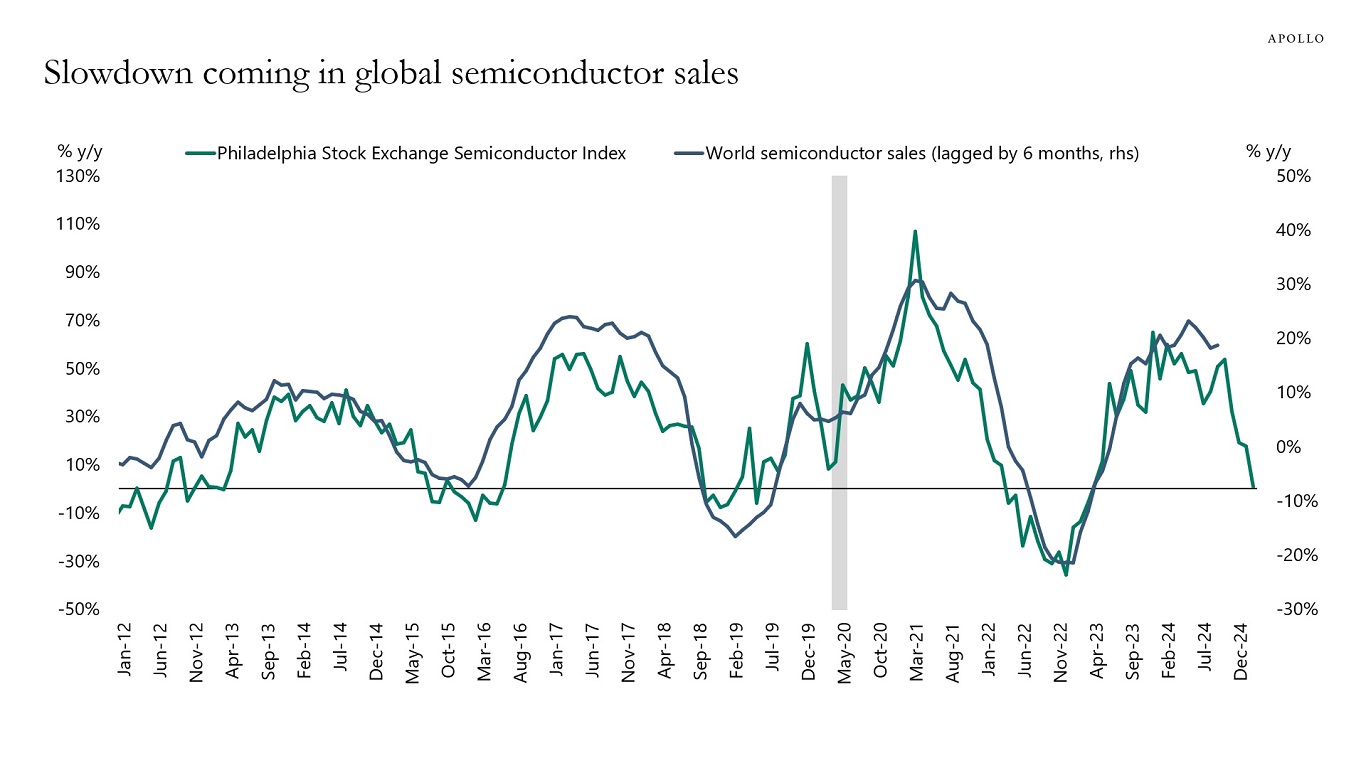
Sources: Bloomberg, Apollo Chief Economist See important disclaimers at the bottom of the page.

This presentation may not be distributed, transmitted or otherwise communicated to others in whole or in part without the express consent of Apollo Global Management, Inc. (together with its subsidiaries, “Apollo”).
Apollo makes no representation or warranty, expressed or implied, with respect to the accuracy, reasonableness, or completeness of any of the statements made during this presentation, including, but not limited to, statements obtained from third parties. Opinions, estimates and projections constitute the current judgment of the speaker as of the date indicated. They do not necessarily reflect the views and opinions of Apollo and are subject to change at any time without notice. Apollo does not have any responsibility to update this presentation to account for such changes. There can be no assurance that any trends discussed during this presentation will continue.
Statements made throughout this presentation are not intended to provide, and should not be relied upon for, accounting, legal or tax advice and do not constitute an investment recommendation or investment advice. Investors should make an independent investigation of the information discussed during this presentation, including consulting their tax, legal, accounting or other advisors about such information. Apollo does not act for you and is not responsible for providing you with the protections afforded to its clients. This presentation does not constitute an offer to sell, or the solicitation of an offer to buy, any security, product or service, including interest in any investment product or fund or account managed or advised by Apollo.
Certain statements made throughout this presentation may be “forward-looking” in nature. Due to various risks and uncertainties, actual events or results may differ materially from those reflected or contemplated in such forward-looking information. As such, undue reliance should not be placed on such statements. Forward-looking statements may be identified by the use of terminology including, but not limited to, “may”, “will”, “should”, “expect”, “anticipate”, “target”, “project”, “estimate”, “intend”, “continue” or “believe” or the negatives thereof or other variations thereon or comparable terminology.