


Want it delivered daily to your inbox?
-
The rise of passive investing has had a significant impact on financial markets in the last three decades, especially on its contribution to higher asset-price volatility, reduced liquidity, and possible contribution to heightened market concentration. By analyzing the substantial shift of assets from active to passive strategies—particularly through the growth of ETFs and retirement-savings plans, such as a 401(k)—this paper illustrates how passive investors, who primarily track major indices, have contributed to reduced price elasticity and market responsiveness, which, in turn, have led to amplified price movements, decreased liquidity, potential macroeconomic inefficiencies, and a disproportionate concentration of market influence in a few dominant stocks, such as the Magnificent Seven.
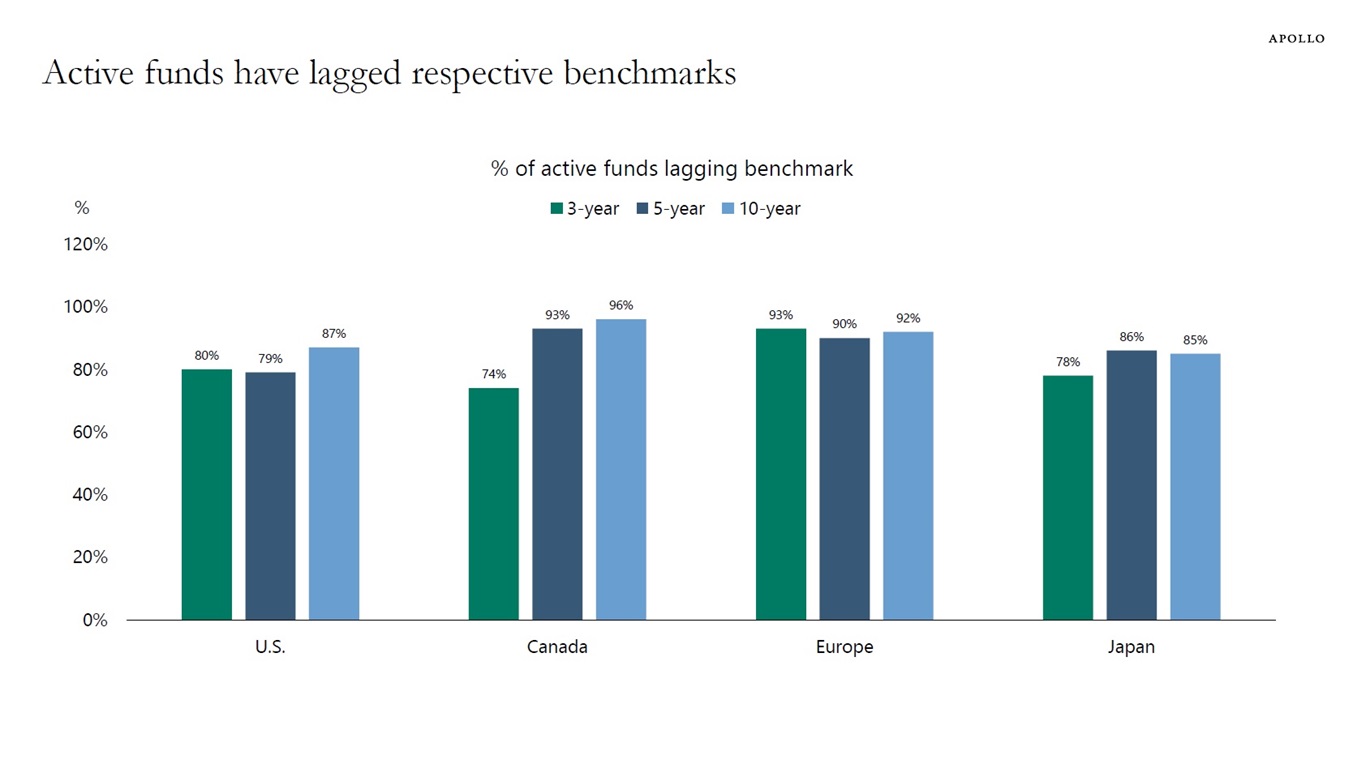
Source: Morningstar, Apollo Chief Economist See important disclaimers at the bottom of the page.
-
Fed cuts, tight credit spreads, and higher animal spirits will boost M&A and IPO activity over the coming quarters, see charts below.
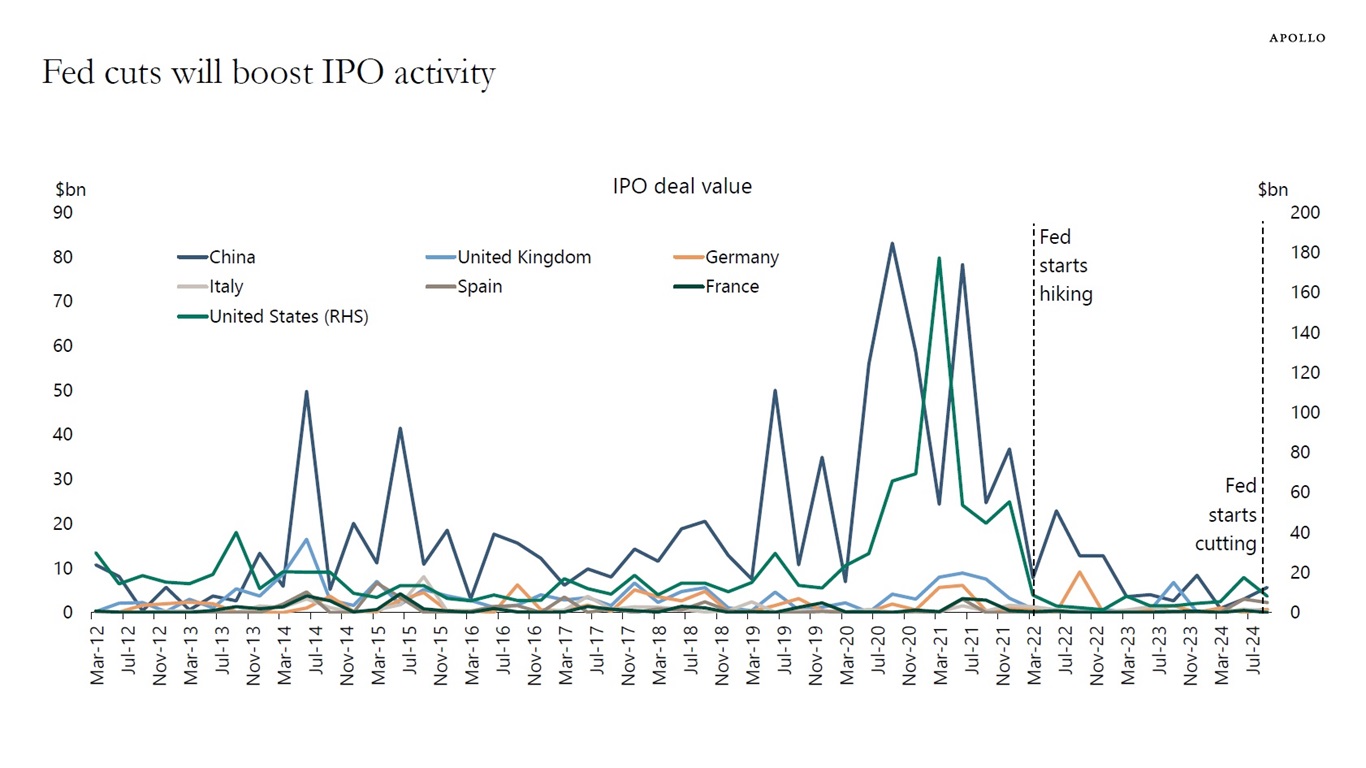
Note: IPO as of announced date. Source: Bloomberg, Apollo Chief Economist 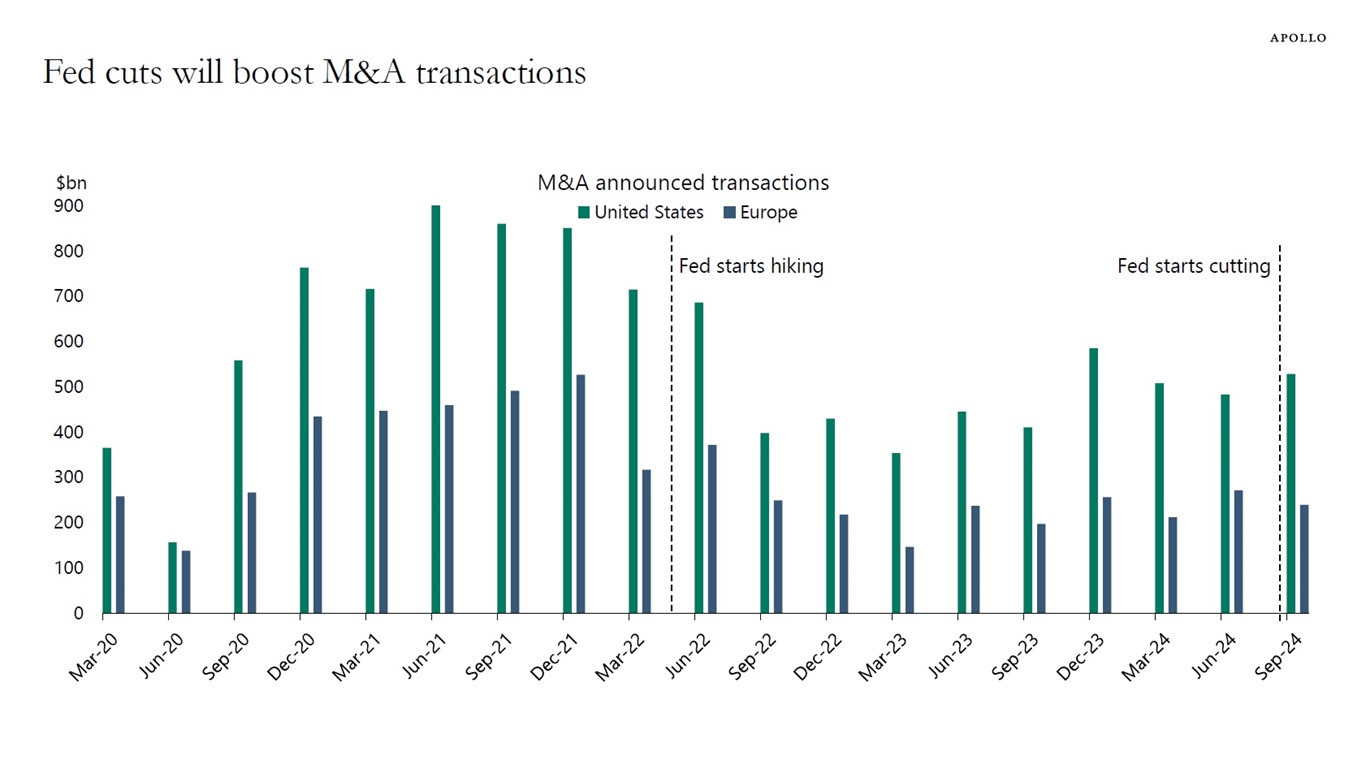
Note: M&A announced transactions, US/Europe, is the daily sum of mergers, acquisitions, divestitures, self-tenders and spin-offs announced involving either a US/Europe target or acquirer. Source: Bloomberg, Apollo Chief Economist See important disclaimers at the bottom of the page.
-
The distribution of interest coverage ratios for leveraged loan deals has remained remarkably stable during the Fed hiking cycle, see chart below. For more discussion, see here.
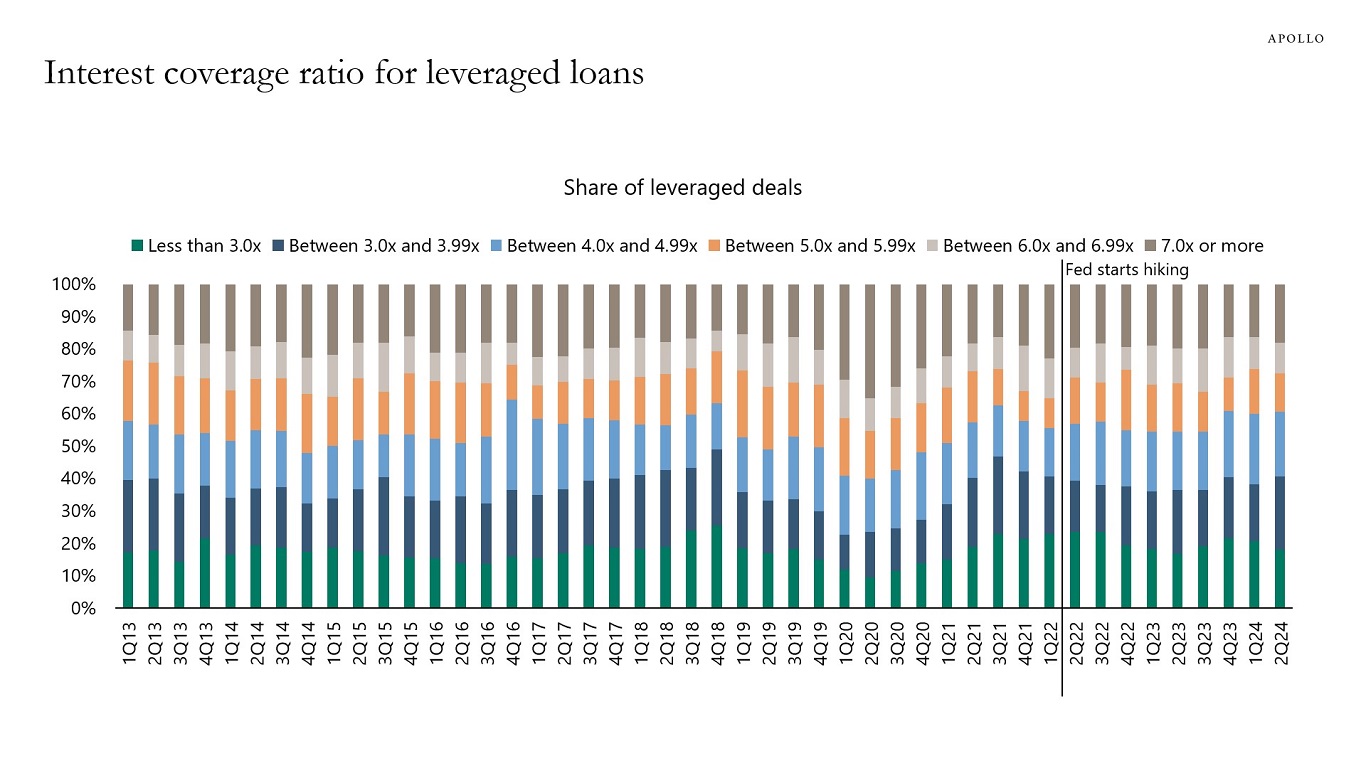
Source: PitchBook LCD, Apollo Chief Economist See important disclaimers at the bottom of the page.
-
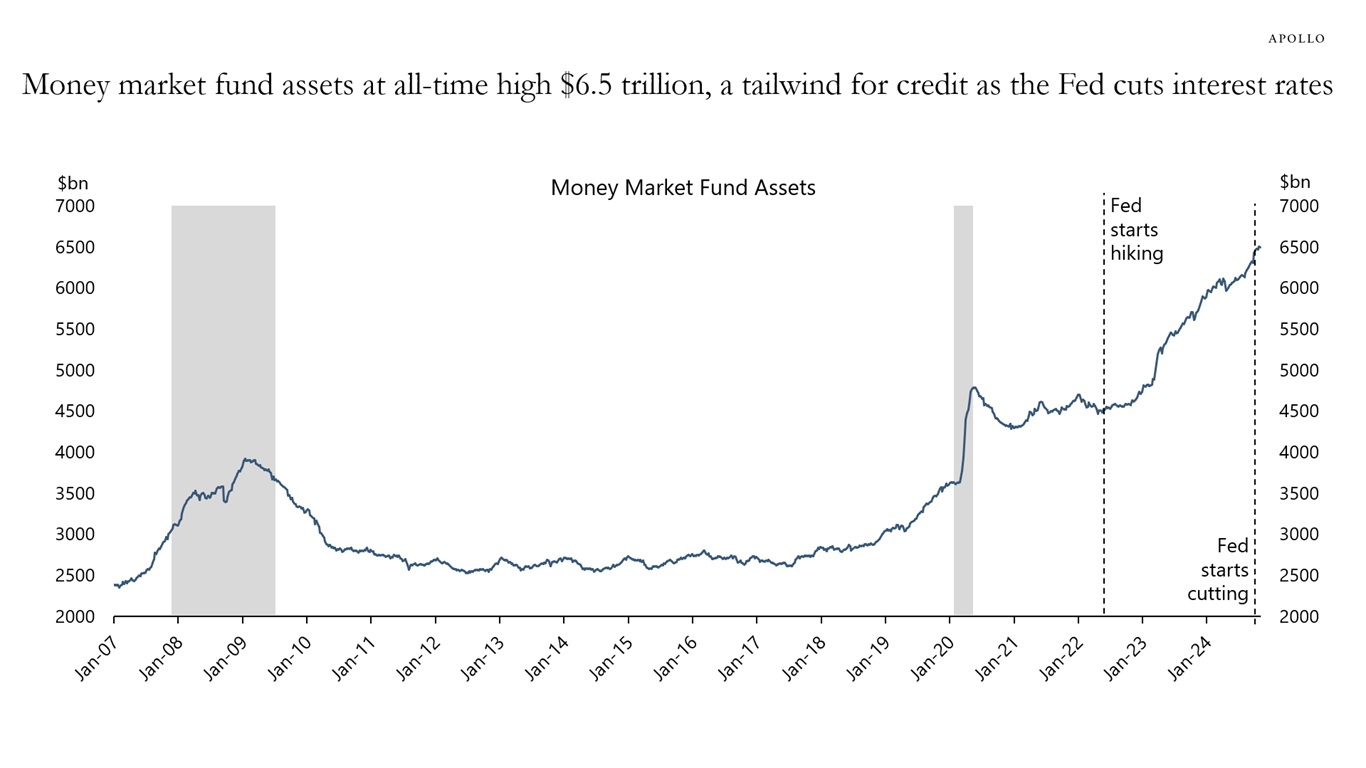
When the Fed was raising interest rates from March 2022 to September 2024, the amount of money in money market accounts increased $2 trillion as investors liked the higher level of yields, see chart below.
So what will happen with the money in money market accounts now that the Fed has started cutting interest rates? In other words, where will the $2 trillion added to money market accounts go now that the Fed is cutting?
The most likely scenario is that money will leave money market accounts and flow into higher-yielding assets such as credit, including investment grade private credit.
For more discussion, see our latest credit outlook here.
Source: Bloomberg, Apollo Chief Economist See important disclaimers at the bottom of the page.
-
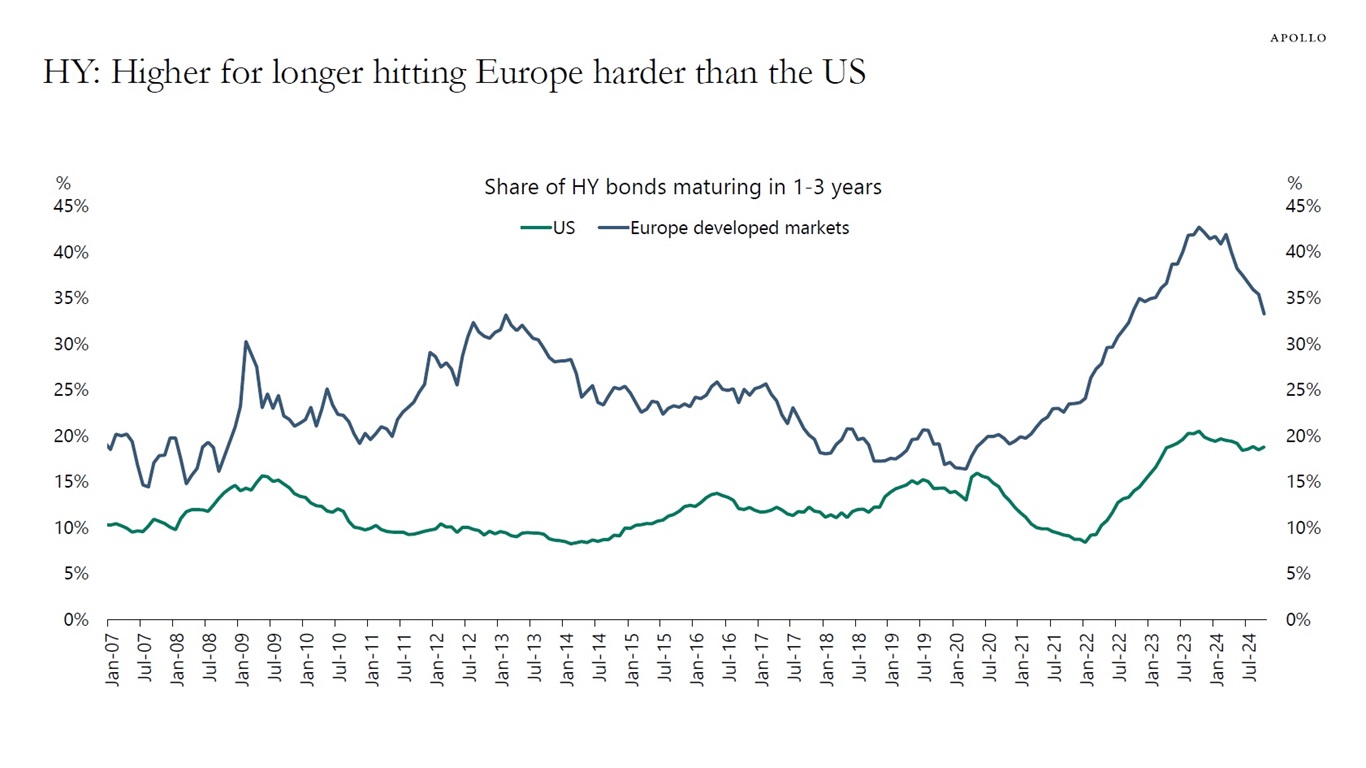
For high yield, more companies in Europe need to refinance over the coming years compared with the US, see chart below.
Put differently, if interest rates stay higher for longer, it will have a more negative impact on the European economy, indicating a bigger need for the ECB to lower interest rates.
For more discussion, see here.
Source: ICE BofA, Bloomberg, Apollo Chief Economist See important disclaimers at the bottom of the page.
-
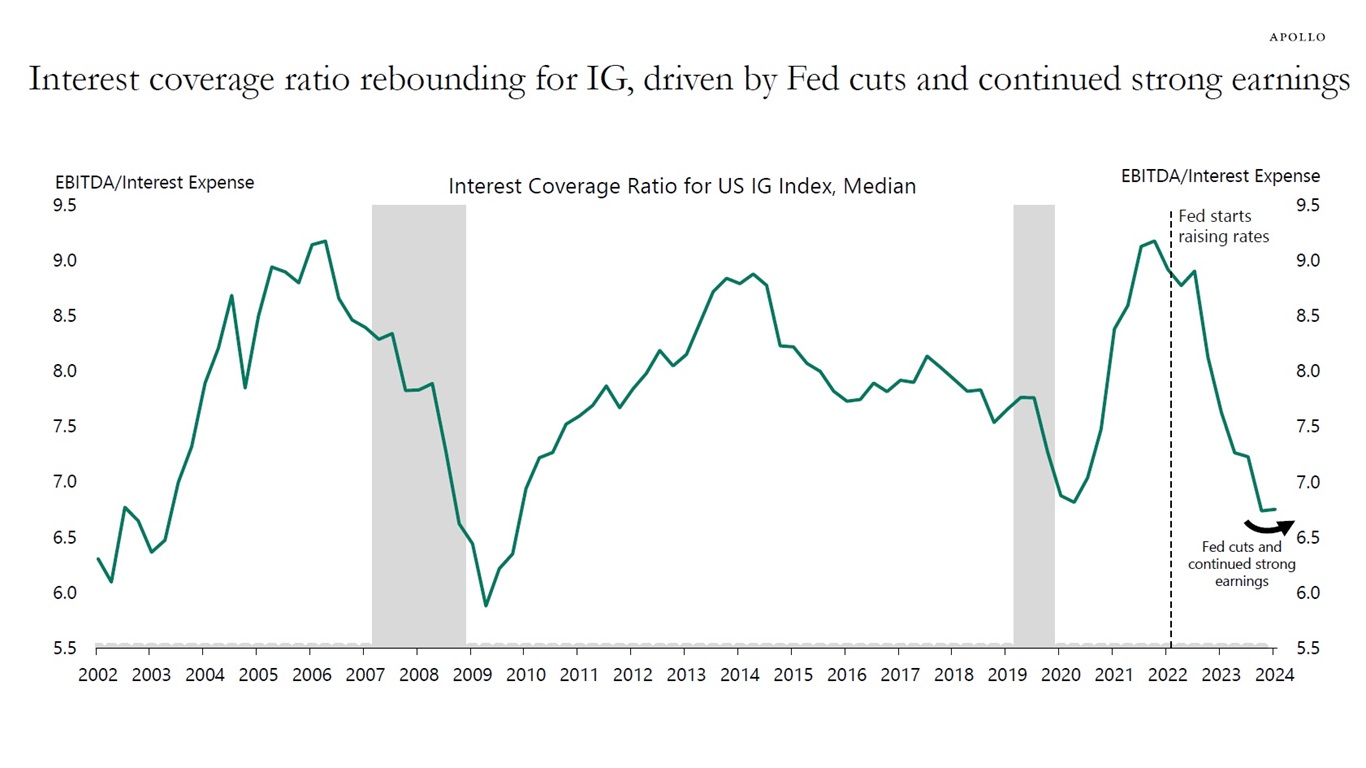
The median interest coverage ratio for the investment grade credit index is just below 7, and for high yield, it is just below 4. Lower-rated credits are more vulnerable to interest rates staying higher for longer because lower-rated credits, by definition, have higher debt-servicing costs.
Recent developments in interest coverage ratios show that Fed cuts and continued strong earnings are starting to help investment grade companies, see charts below. Meanwhile, high yield companies are still seeing a downtrend in coverage ratios driven by higher debt-servicing costs.
The Fed cutting interest rates and continued strong earnings will be helpful for both investment grade credit and high yield credit. But as interest rates stay elevated, debt-servicing costs will weigh more heavily on high yield companies, and investment grade credits with lower debt-servicing costs will be more attractive.
This happens to be exactly how monetary policy works: Companies with higher debt-servicing costs and lower coverage ratios are hit harder by Fed hikes and interest rates staying higher for longer.
For more discussion, see here.
Source: Bloomberg, Apollo Chief Economist 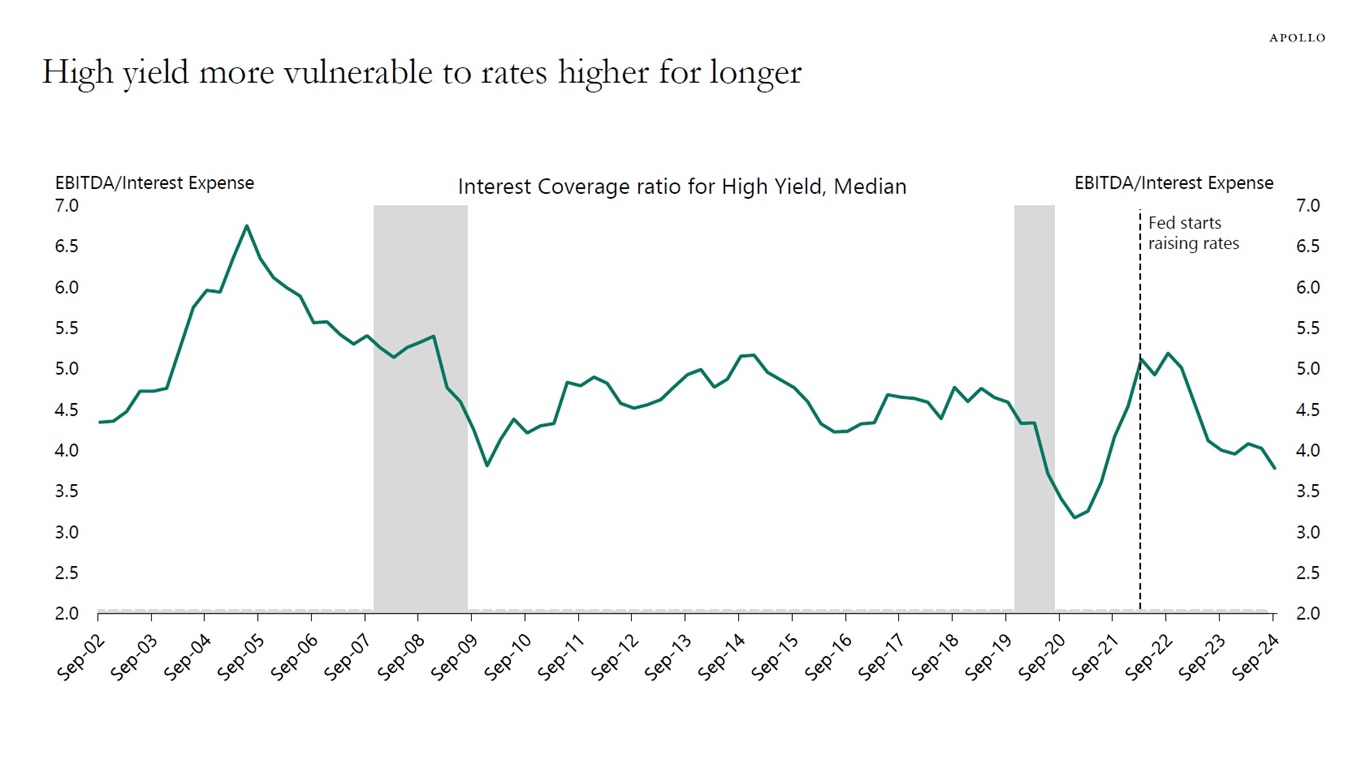
Source: Bloomberg, Apollo Chief Economist See important disclaimers at the bottom of the page.
-
This week, we got higher CPI, PPI, and retail sales, and the incoming data continues to be strong.
Combined with the observed acceleration in average hourly earnings in recent months, the risks are rising that inflation could begin to move higher again, see charts below and our weekly chart book.
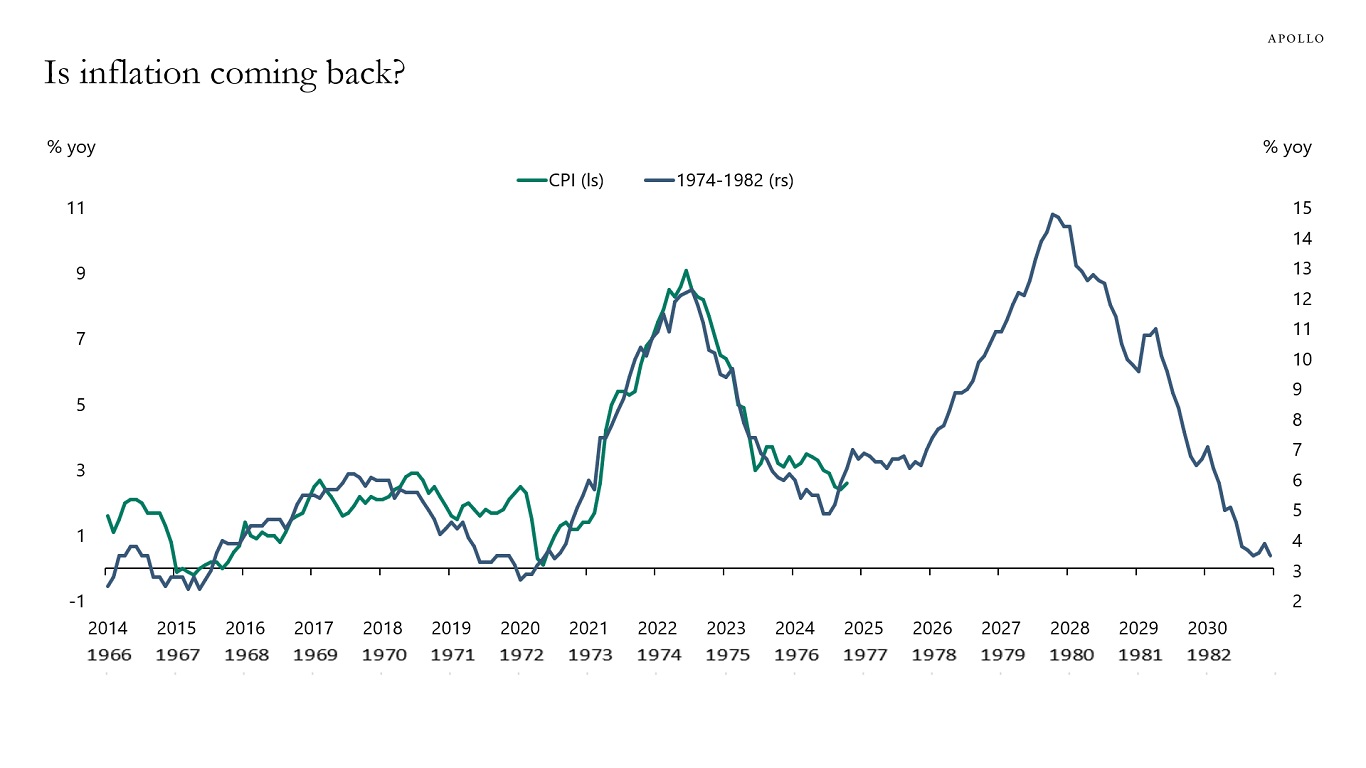
Source: BLS, Apollo Chief Economist 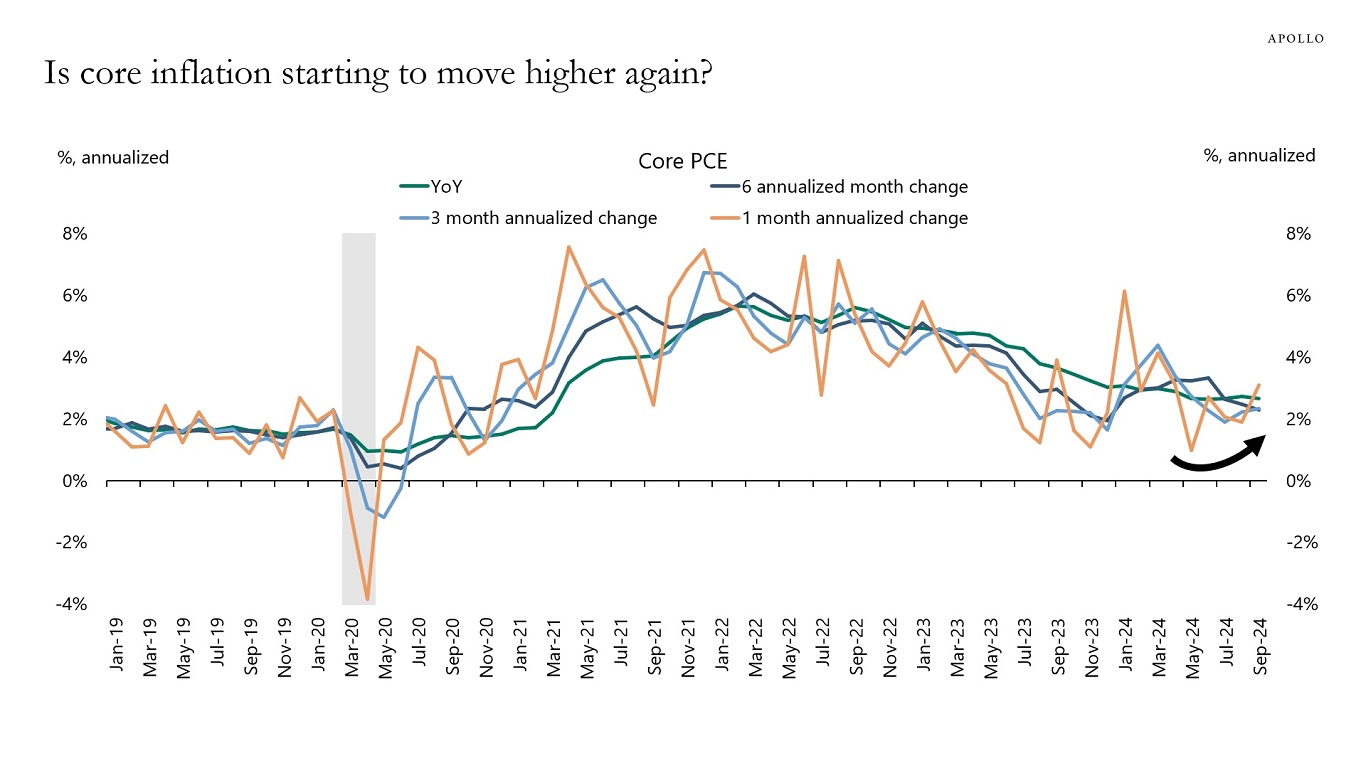
Source: BEA, Haver Analytics, Apollo Chief Economist 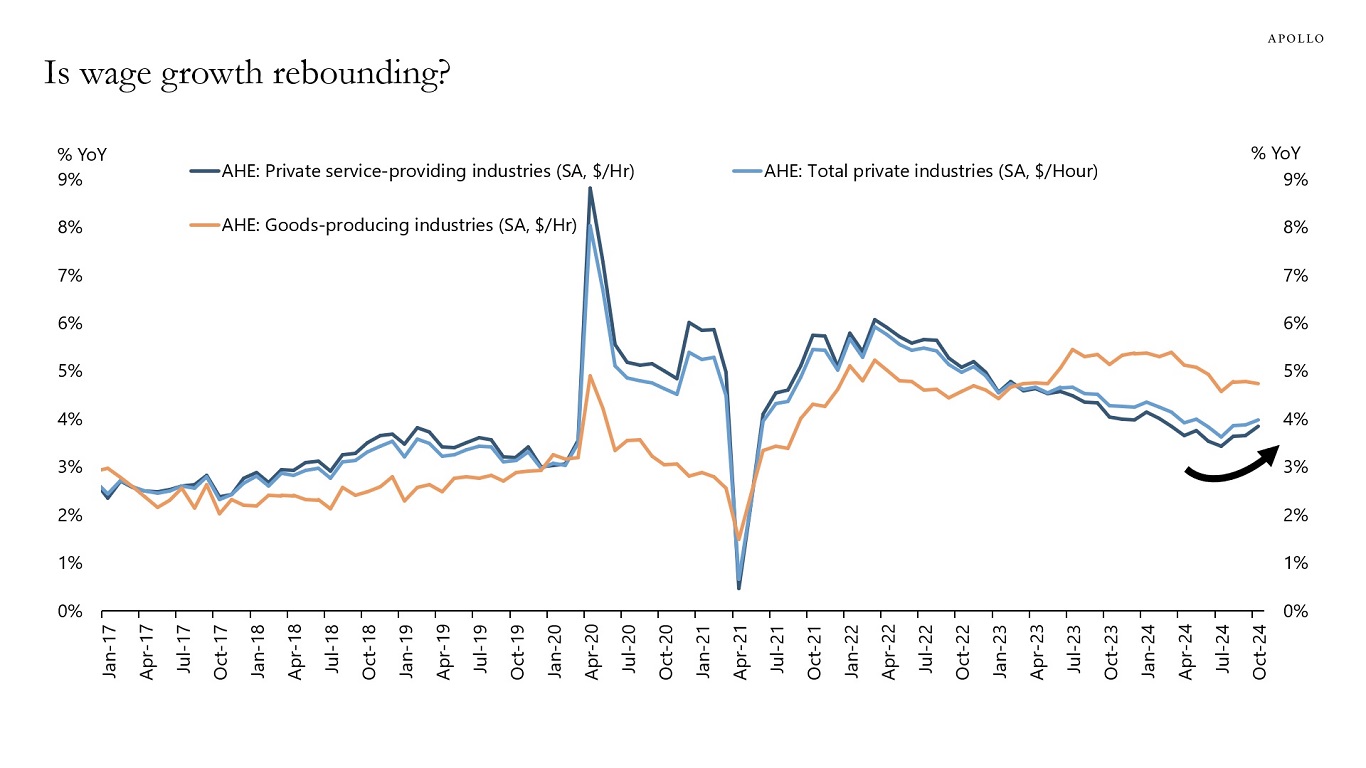
Source: BLS, Haver Analytics, Apollo Chief Economist 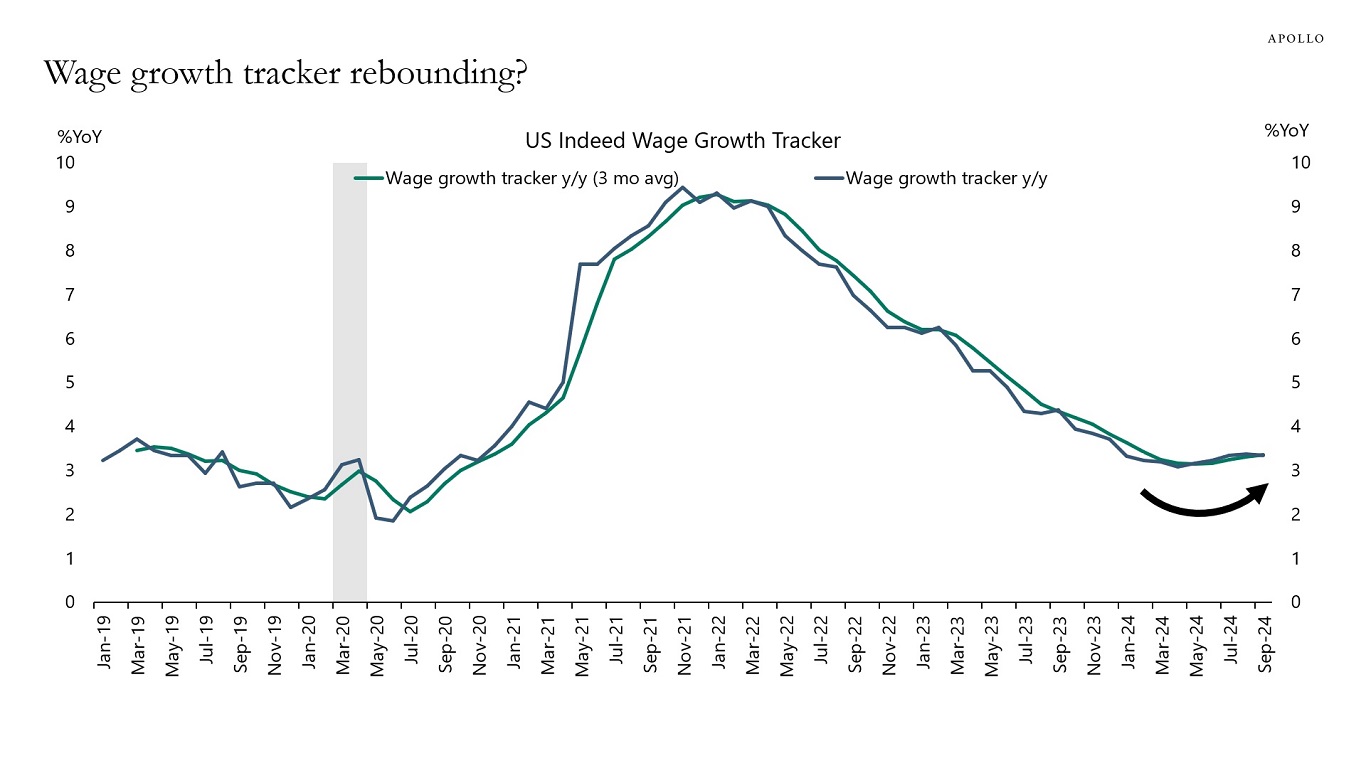
Source: Indeed Wage Tracker, Haver Analytics, Apollo Chief Economist 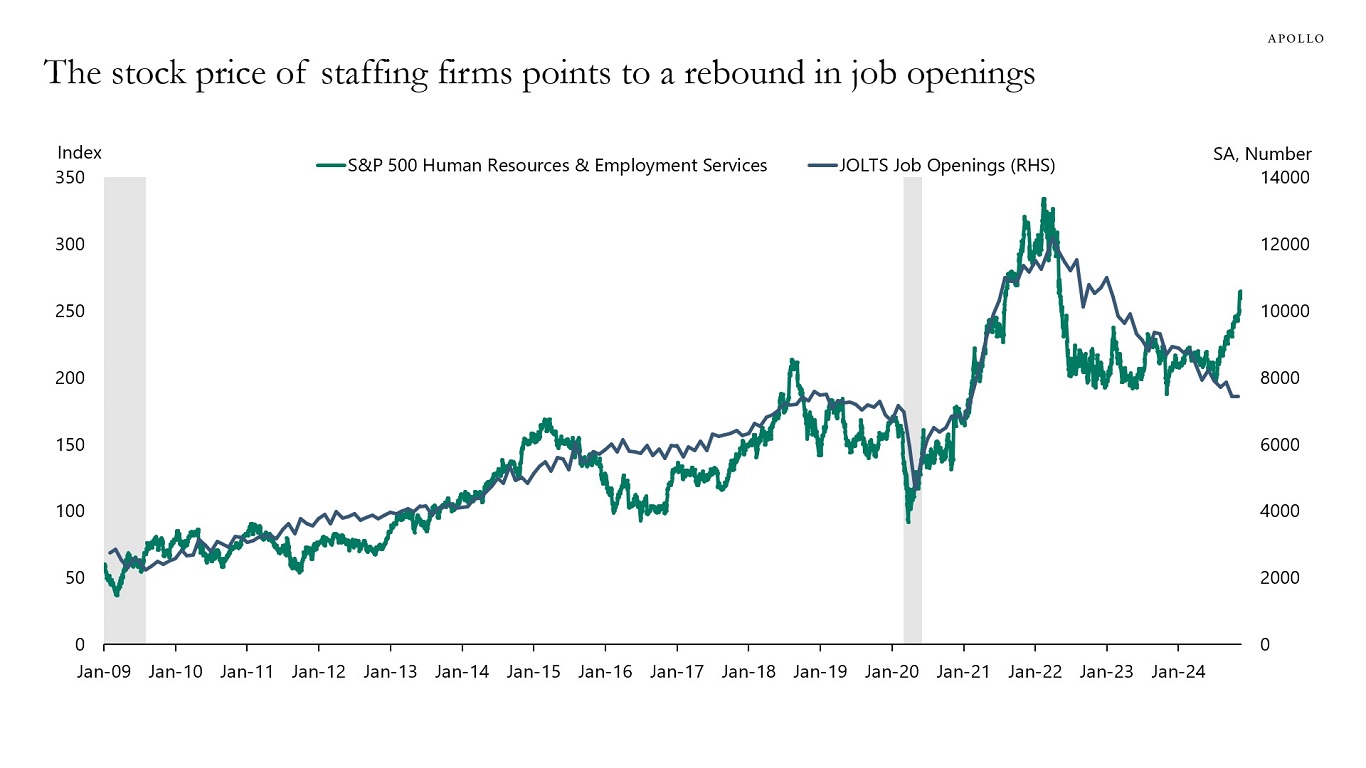
Source: Bloomberg, BLS, Apollo Chief Economist See important disclaimers at the bottom of the page.
-
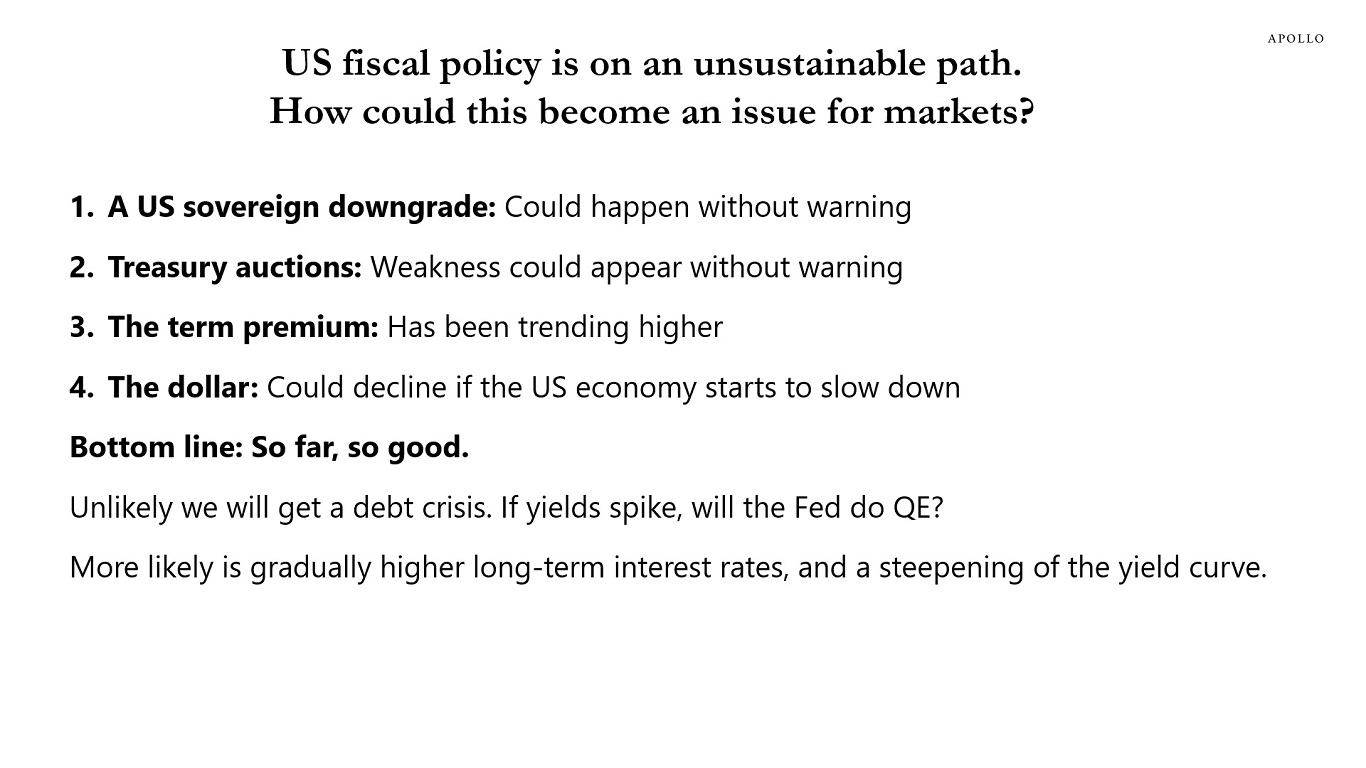
In this chart book, we take a data-driven look at the US fiscal situation. We also discuss where in financial markets the first signs might appear that US fiscal policy is unsustainable.
Source: Apollo Chief Economist 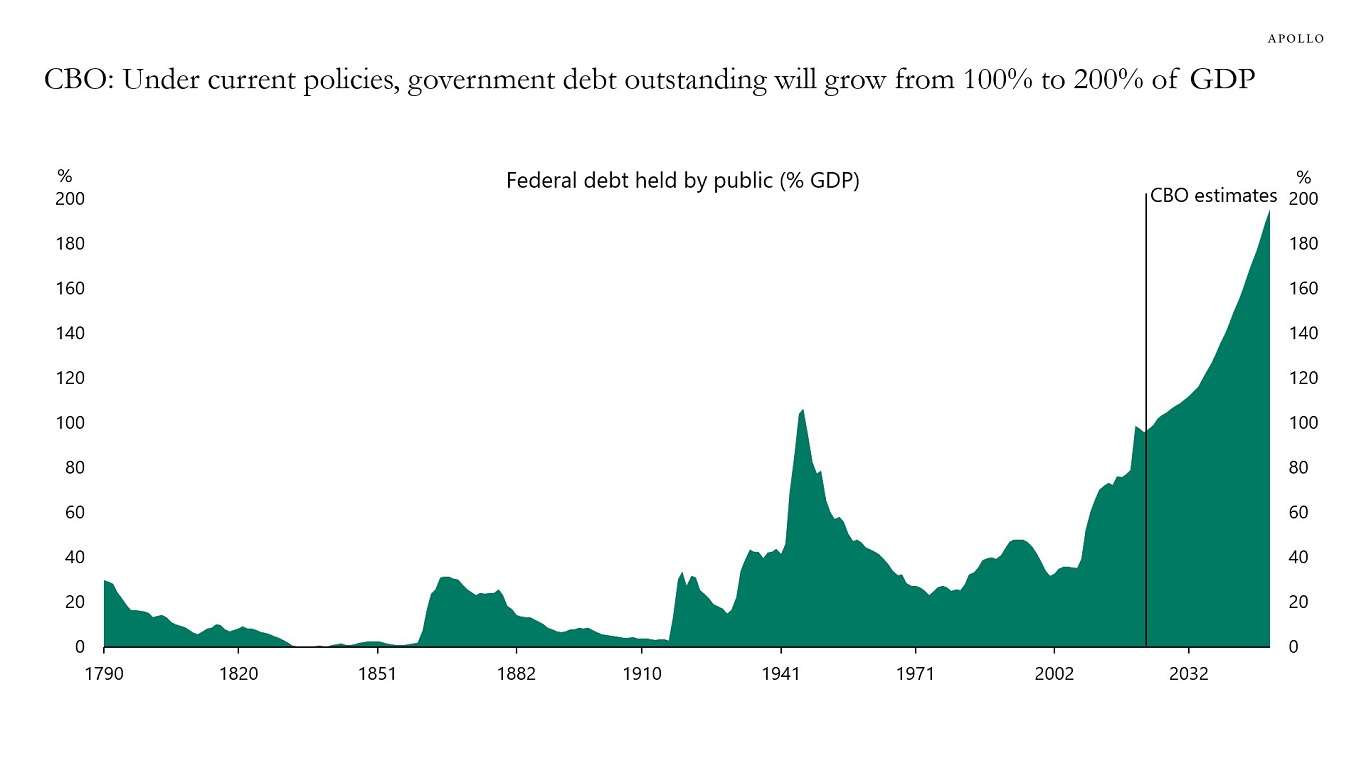
Source: CBO, Haver Analytics, Apollo Chief Economist See important disclaimers at the bottom of the page.
-
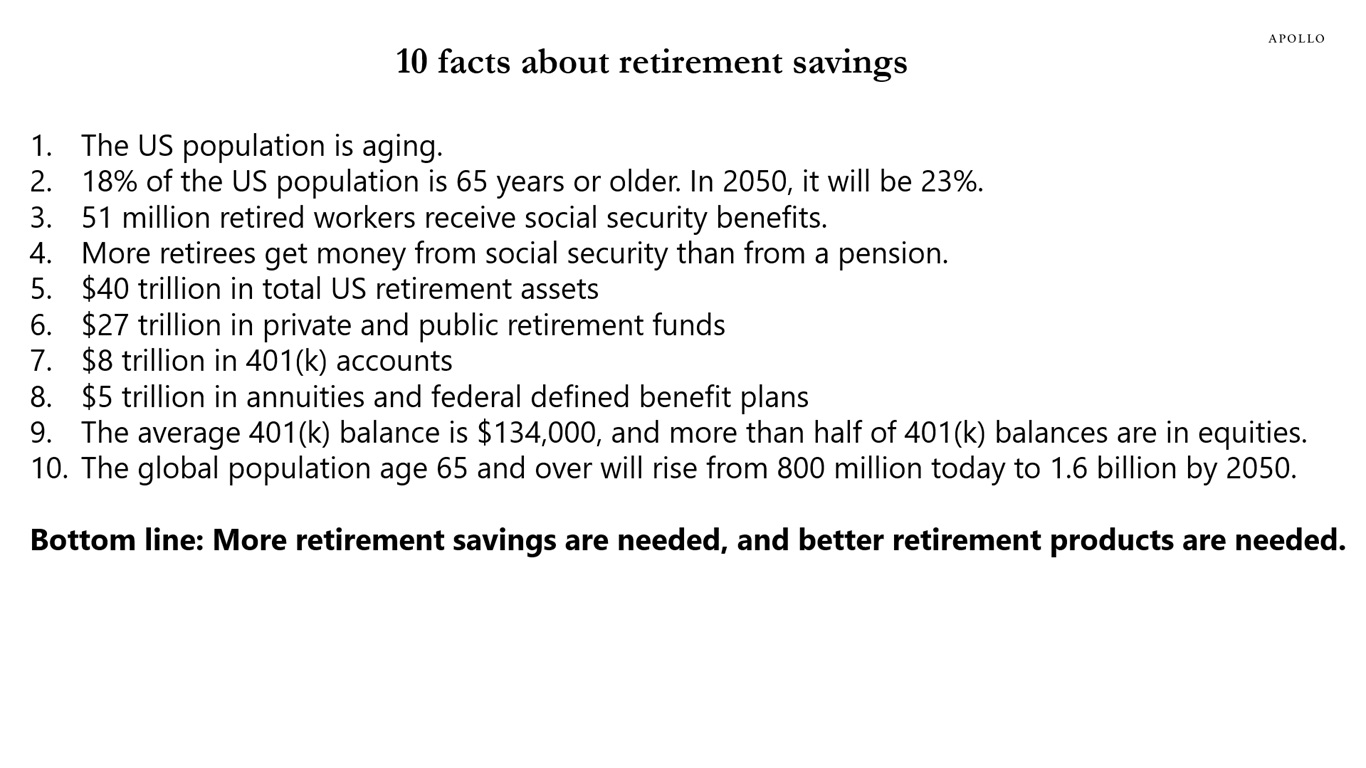
The population is aging, there is not enough retirement savings, and retirement asset allocation is distorted with too much money in daily liquid equities highly concentrated in the Magnificent Seven. The bottom line is that more retirement savings are needed and better retirement products are needed. Our chart book, available here, looks at the growing retirement savings challenge.
Source: Apollo Chief Economist 
Unless otherwise noted, information as of November 2024
Proprietary – Not for distribution, in whole or in part, without the express written consent of Apollo Global Management, Inc.See important disclaimers at the bottom of the page.
-
Modified duration measures the expected change in a bond’s price to a 1% change in interest rates. The charts below show that since the Fed started raising rates, index duration has declined both for high yield and investment grade, with high yield duration currently standing at 3.5% and investment grade duration at close to 7%.
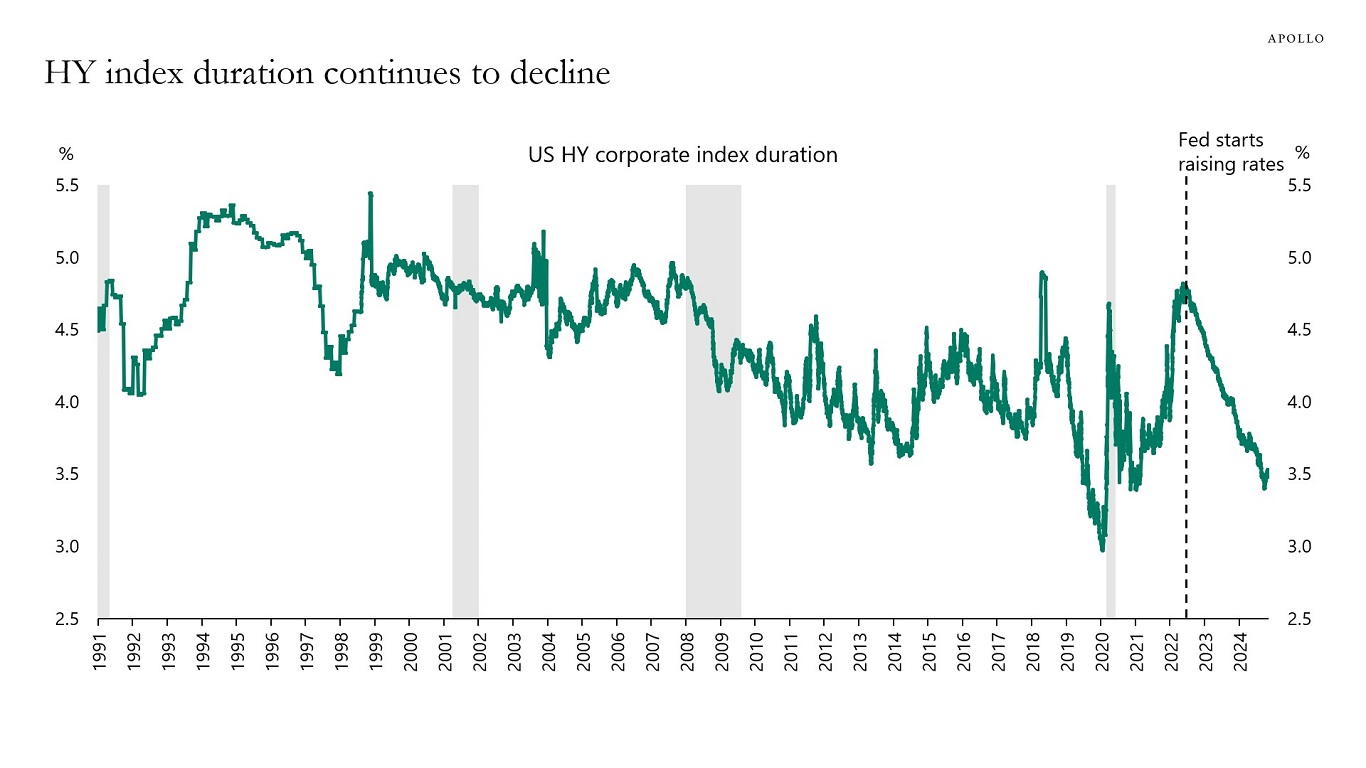
Note: The measure used is modified duration, which measures the expected change in a bond’s price to a 1% change in interest rates. Source: Bloomberg, Apollo Chief Economist 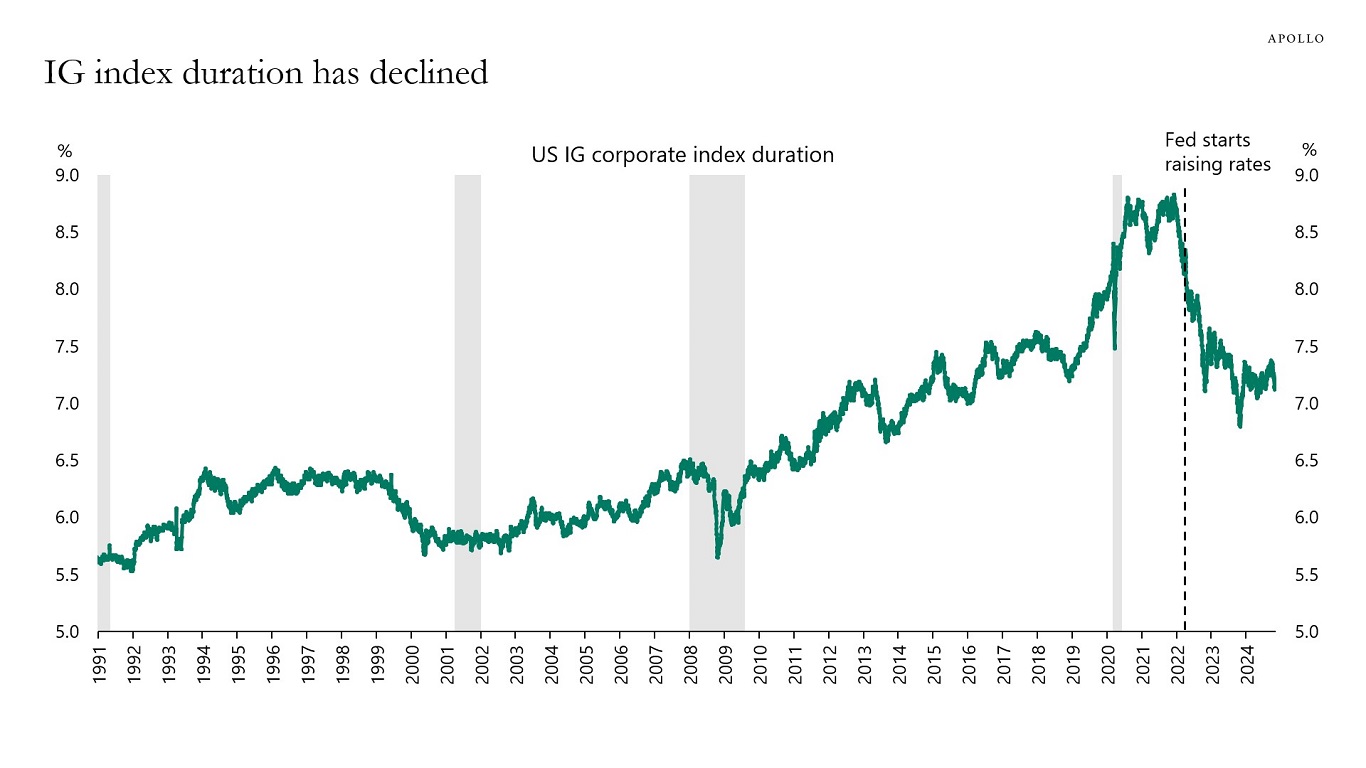
Note: The measure used is modified duration, which measures the expected change in a bond’s price to a 1% change in interest rates. Source: Bloomberg, Apollo Chief Economist See important disclaimers at the bottom of the page.

This presentation may not be distributed, transmitted or otherwise communicated to others in whole or in part without the express consent of Apollo Global Management, Inc. (together with its subsidiaries, “Apollo”).
Apollo makes no representation or warranty, expressed or implied, with respect to the accuracy, reasonableness, or completeness of any of the statements made during this presentation, including, but not limited to, statements obtained from third parties. Opinions, estimates and projections constitute the current judgment of the speaker as of the date indicated. They do not necessarily reflect the views and opinions of Apollo and are subject to change at any time without notice. Apollo does not have any responsibility to update this presentation to account for such changes. There can be no assurance that any trends discussed during this presentation will continue.
Statements made throughout this presentation are not intended to provide, and should not be relied upon for, accounting, legal or tax advice and do not constitute an investment recommendation or investment advice. Investors should make an independent investigation of the information discussed during this presentation, including consulting their tax, legal, accounting or other advisors about such information. Apollo does not act for you and is not responsible for providing you with the protections afforded to its clients. This presentation does not constitute an offer to sell, or the solicitation of an offer to buy, any security, product or service, including interest in any investment product or fund or account managed or advised by Apollo.
Certain statements made throughout this presentation may be “forward-looking” in nature. Due to various risks and uncertainties, actual events or results may differ materially from those reflected or contemplated in such forward-looking information. As such, undue reliance should not be placed on such statements. Forward-looking statements may be identified by the use of terminology including, but not limited to, “may”, “will”, “should”, “expect”, “anticipate”, “target”, “project”, “estimate”, “intend”, “continue” or “believe” or the negatives thereof or other variations thereon or comparable terminology.