


Want it delivered daily to your inbox?
-
The economy is strong, and there are upside risks to inflation. Markets are pricing in too many Fed cuts, see chart below.

Source: Bloomberg, FOMC, Apollo Chief Economist See important disclaimers at the bottom of the page.
-
The narrative that the labor market is cooling is inconsistent with the continued strength seen in the incoming data for above-trend GDP growth, strong retail sales, strong durable goods, low jobless claims, and rising average hourly earnings.
In addition, default rates continue to decline, corporate profits are at all-time highs, weekly forward profit margins are at record highs, and US household balance sheets are in excellent shape, see charts below.
In short, the US economy remains incredibly strong.
Combined with tailwinds to growth from record-high stock prices, tight credit spreads, M&A/issuance markets rebounding, the AI/data center boom, the Chips Act, the IRA, the Infrastructure Act, and lower taxes for domestic manufacturers and deregulation likely coming, the bottom line is that we could see a dramatic increase in job growth in November, including a reversal of the weather and strike effects that were pushing down nonfarm payrolls in October.
Our chart book with daily and weekly indicators for the US economy is available here.
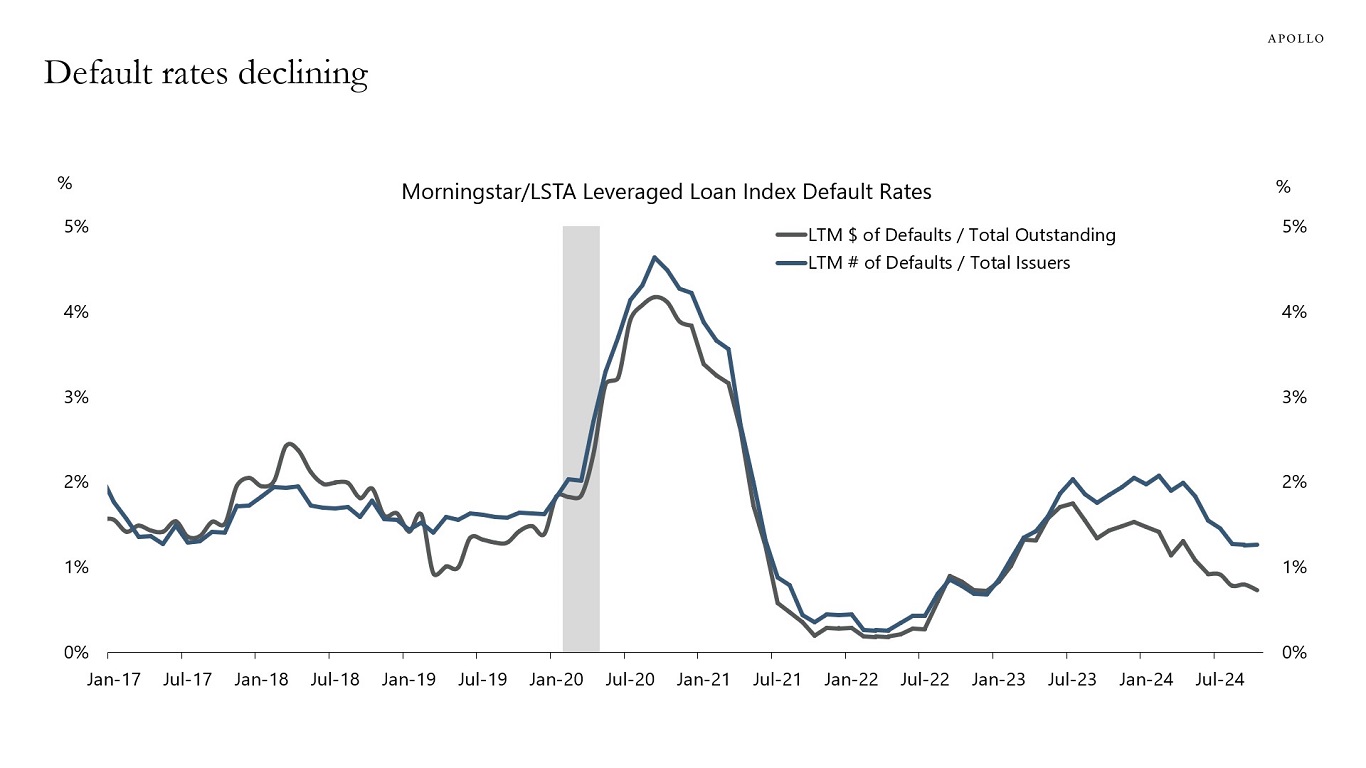
Source: PitchBook LCD, Apollo Chief Economist 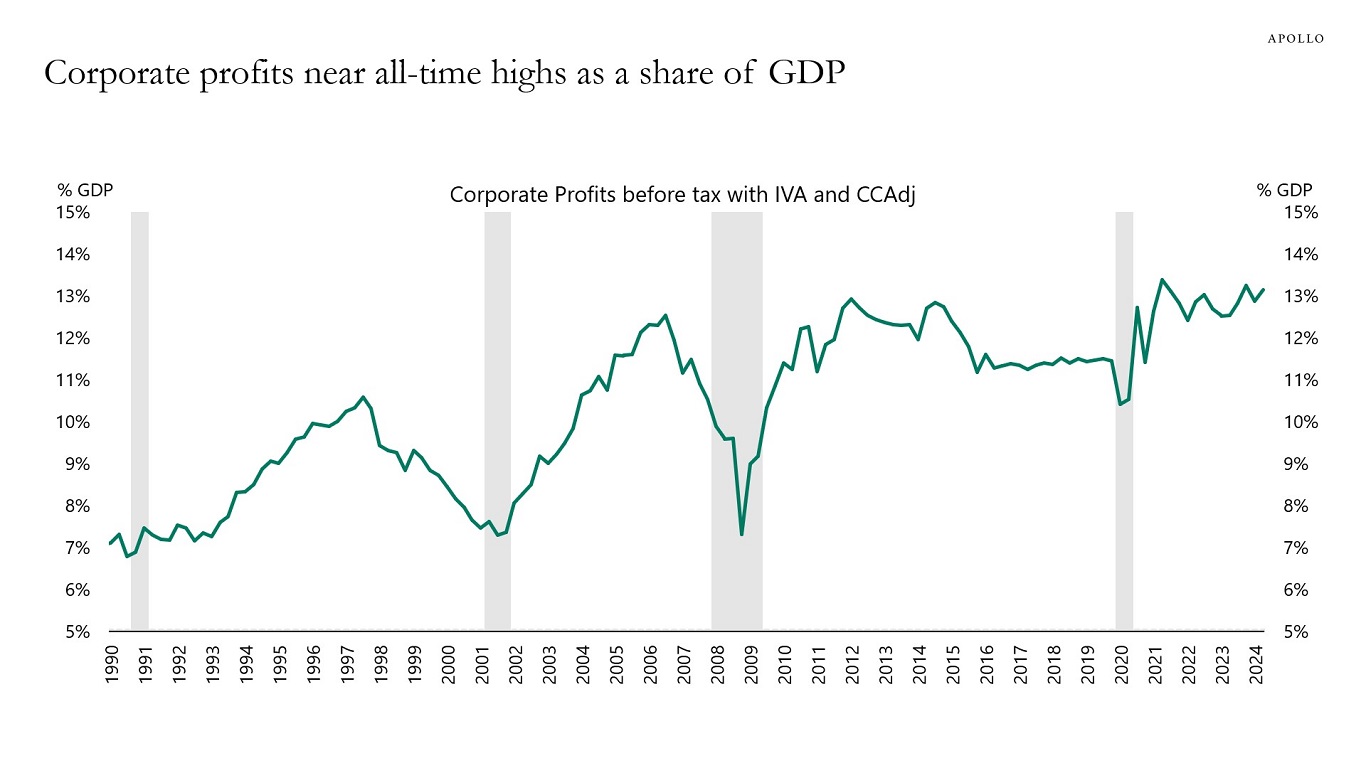
Source: BEA, Haver Analytics, Apollo Chief Economist 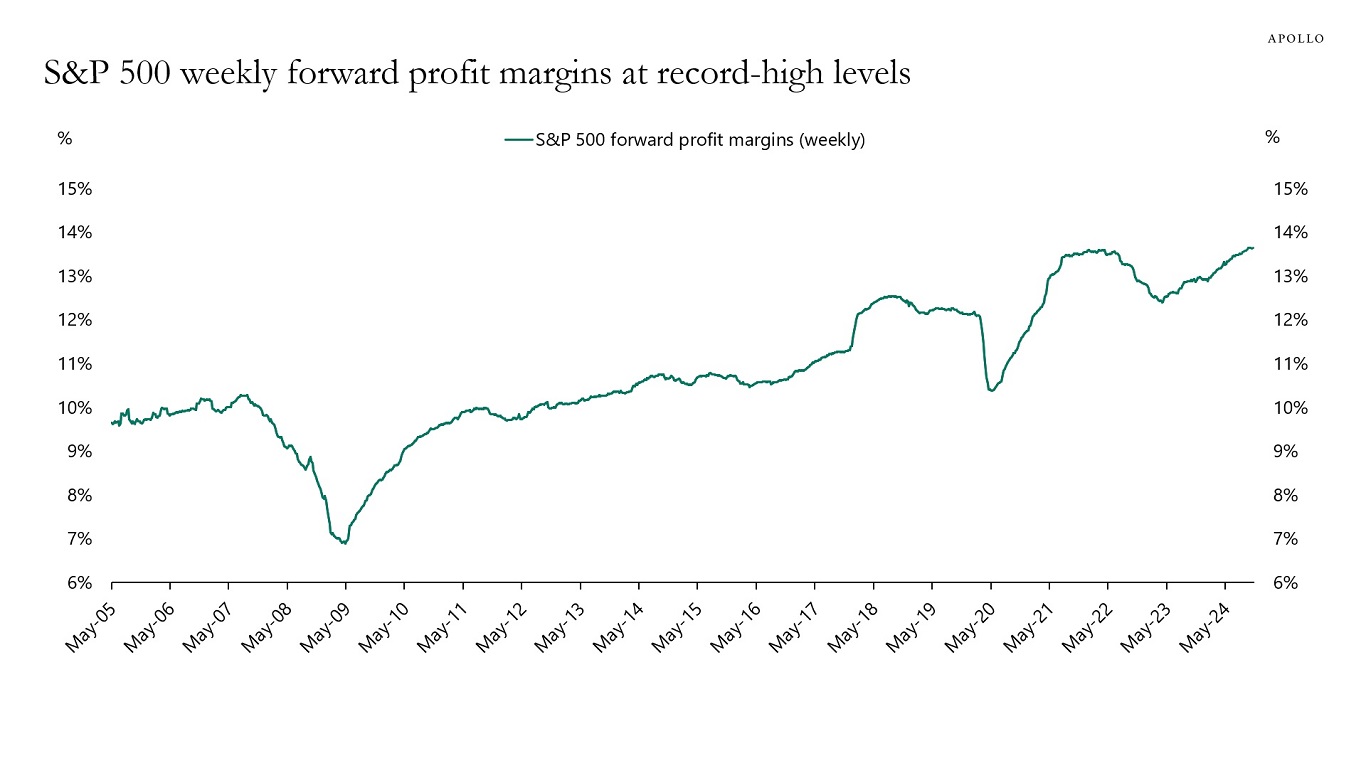
Note: The 12-month forward profit margins are calculated by using the weighted average of 1FY (current year estimate) and 2FY (next year estimate) to smooth out fiscal year transitions. Source: Bloomberg, Apollo Chief Economist 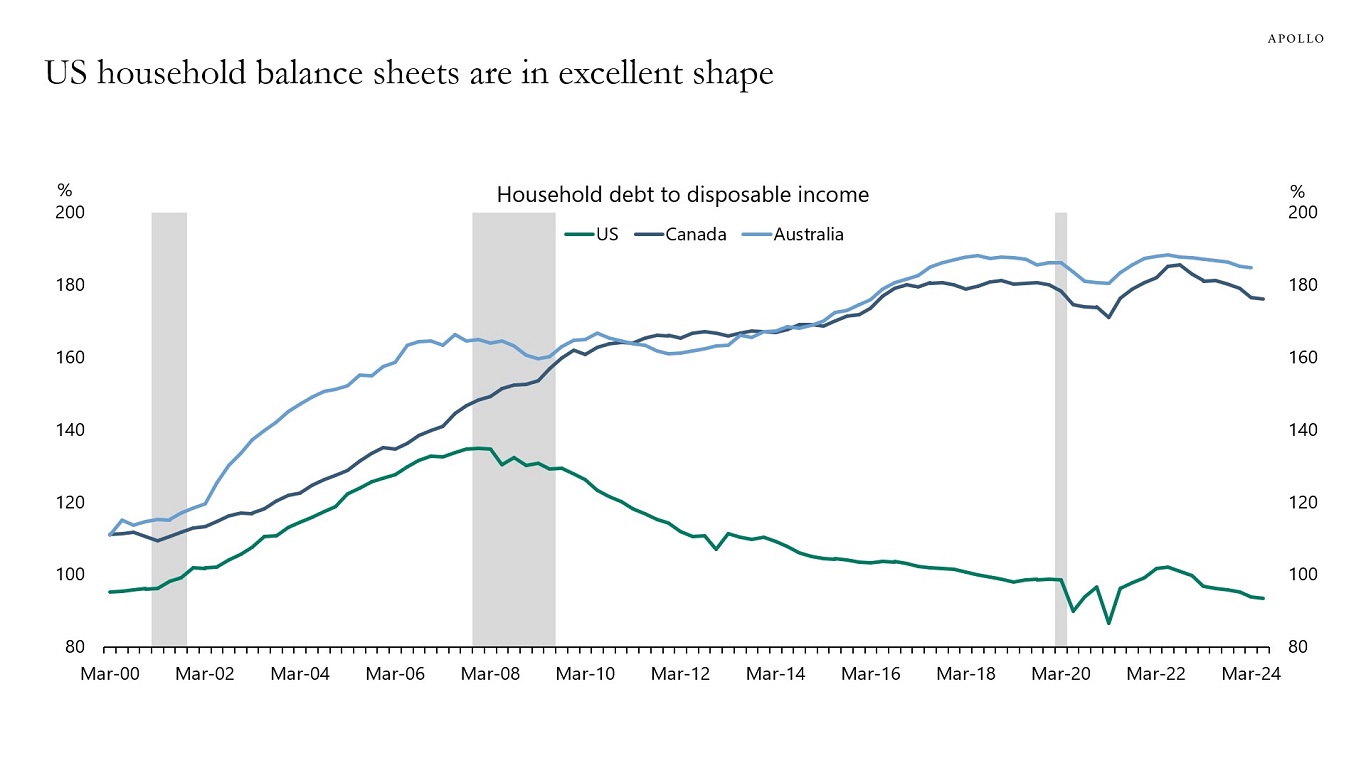
Source: Statistics Canada, Reserve Bank of Australia, Bloomberg, Apollo Chief Economist See important disclaimers at the bottom of the page.
-
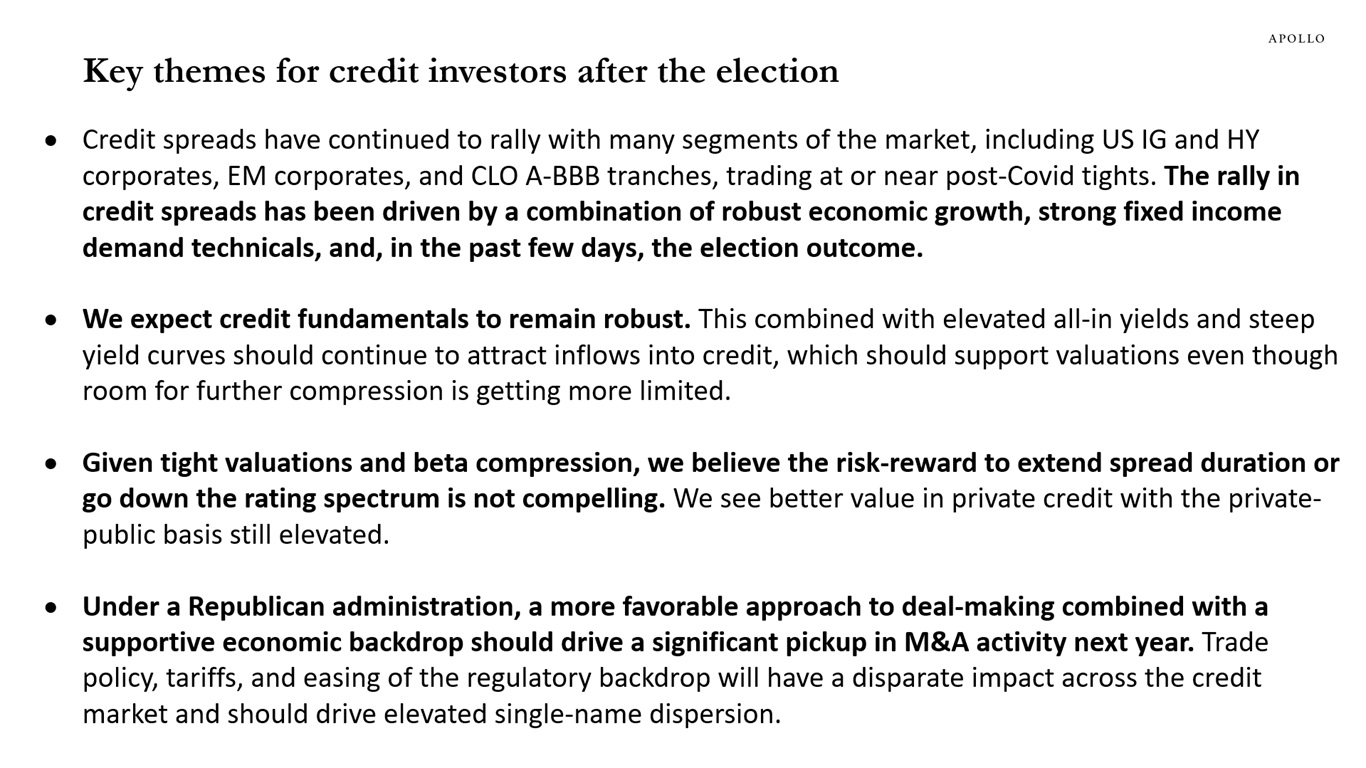
Our latest credit market chart book is available here, and it is your one-stop guide to the outlook for credit markets after the election.
Source: Bloomberg, Apollo Chief Economist See important disclaimers at the bottom of the page.
-
A strong economy usually means higher tax revenues for the government and lower expenditures on unemployment benefits, which in turn means better government finances.
Despite the US being in a solid cyclical position, the US budget deficit is the biggest among OECD countries, see chart below.
If growth slows and the unemployment rate rises, the US fiscal position will deteriorate even further.
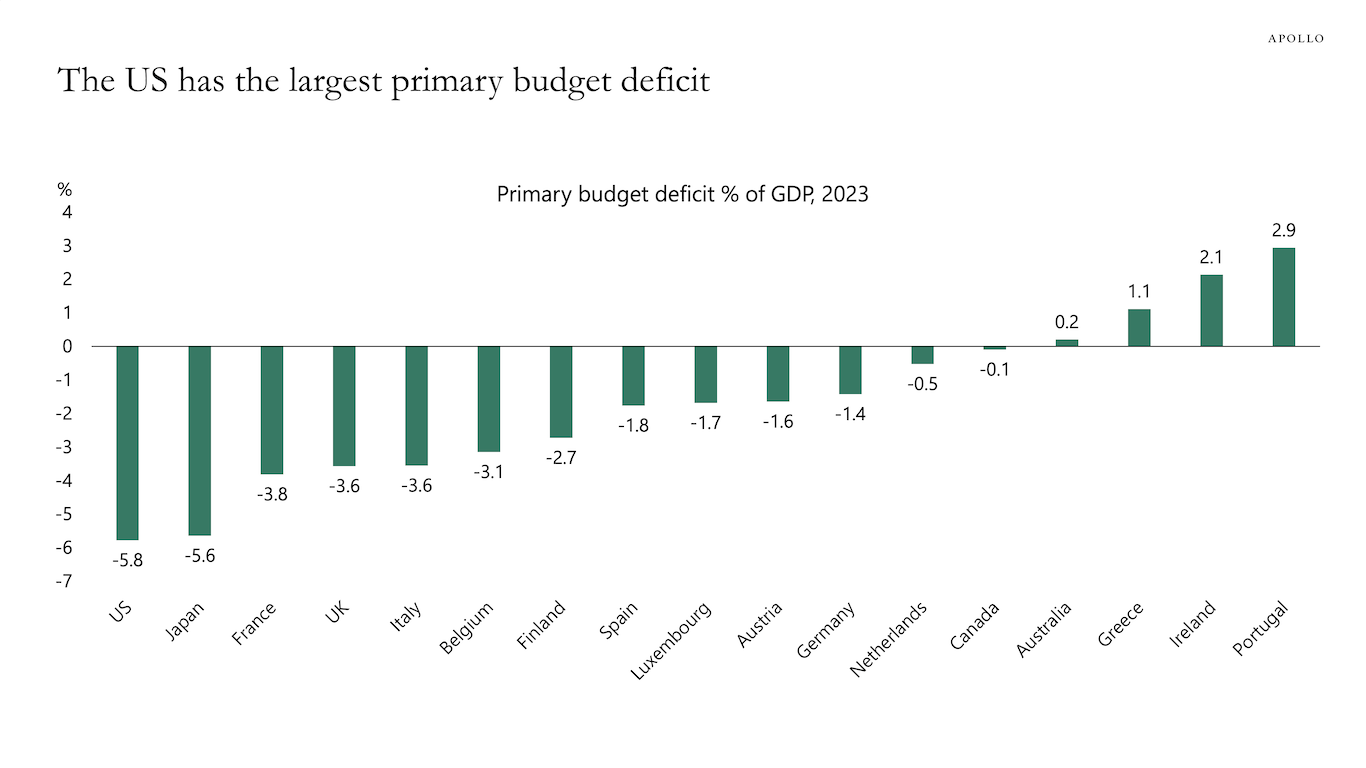
Note: Primary budget deficit = budget deficit excluding interest payments. Source: IMF, Apollo Chief Economist See important disclaimers at the bottom of the page.
-
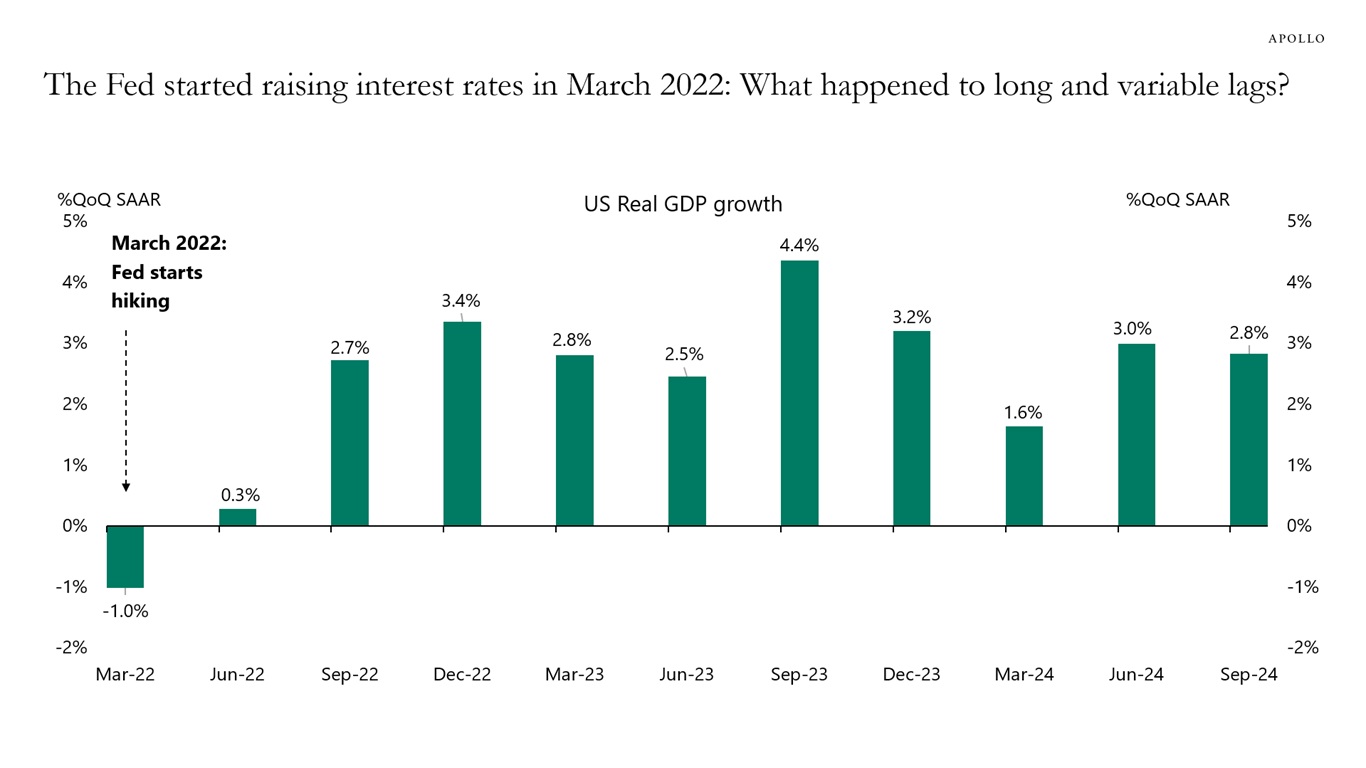
Since the Fed began to raise interest rates in March 2022, the FOMC has constantly expected the economy to slow down, see chart below. But it still hasn’t happened. In this Daily Spark, we discuss why.
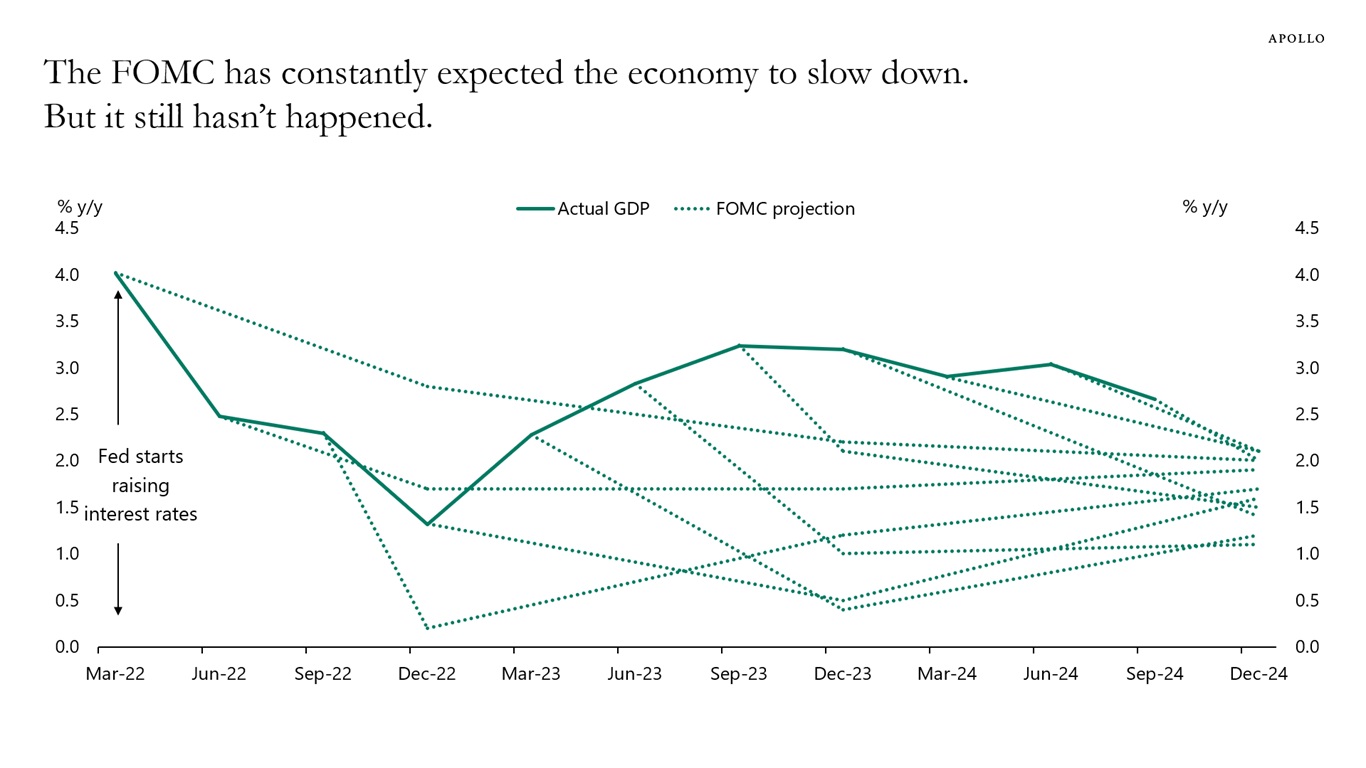
Source: Federal Reserve Board, Bureau of Economic Analysis, Haver Analytics, Apollo Chief Economist See important disclaimers at the bottom of the page.
-
The average P/E ratio of the top 10 biggest companies in the S&P 500 is almost 50, see chart below. Let’s hope we don’t have a recession anytime soon.
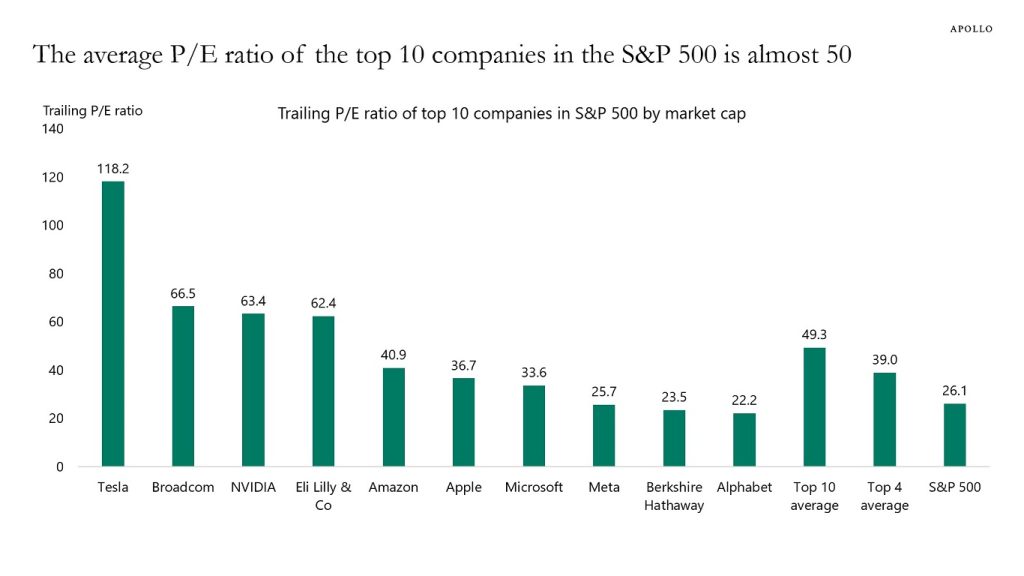
Note: Data as of November 4, 2024. Source: Bloomberg, Apollo Chief Economist See important disclaimers at the bottom of the page.
-
The decline in house prices in China continues, with used home prices falling 9% and new home prices falling 6%, see chart below.
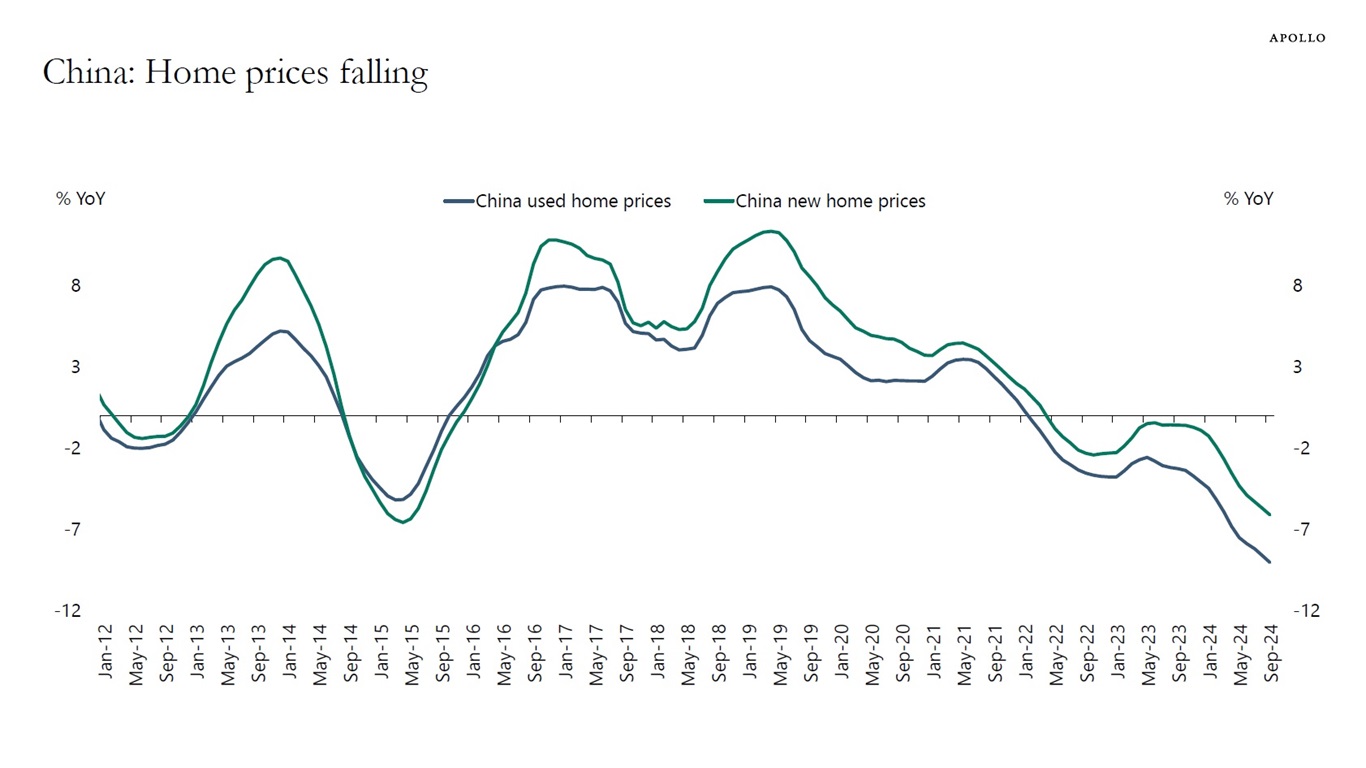
Source: Bloomberg, Apollo Chief Economist See important disclaimers at the bottom of the page.
-
A new study from S&P shows that roughly 90% of active public equity fund managers underperform their index, and 81% of active public fixed income managers underperform their index on a 10-year horizon, see chart below. For more see here.
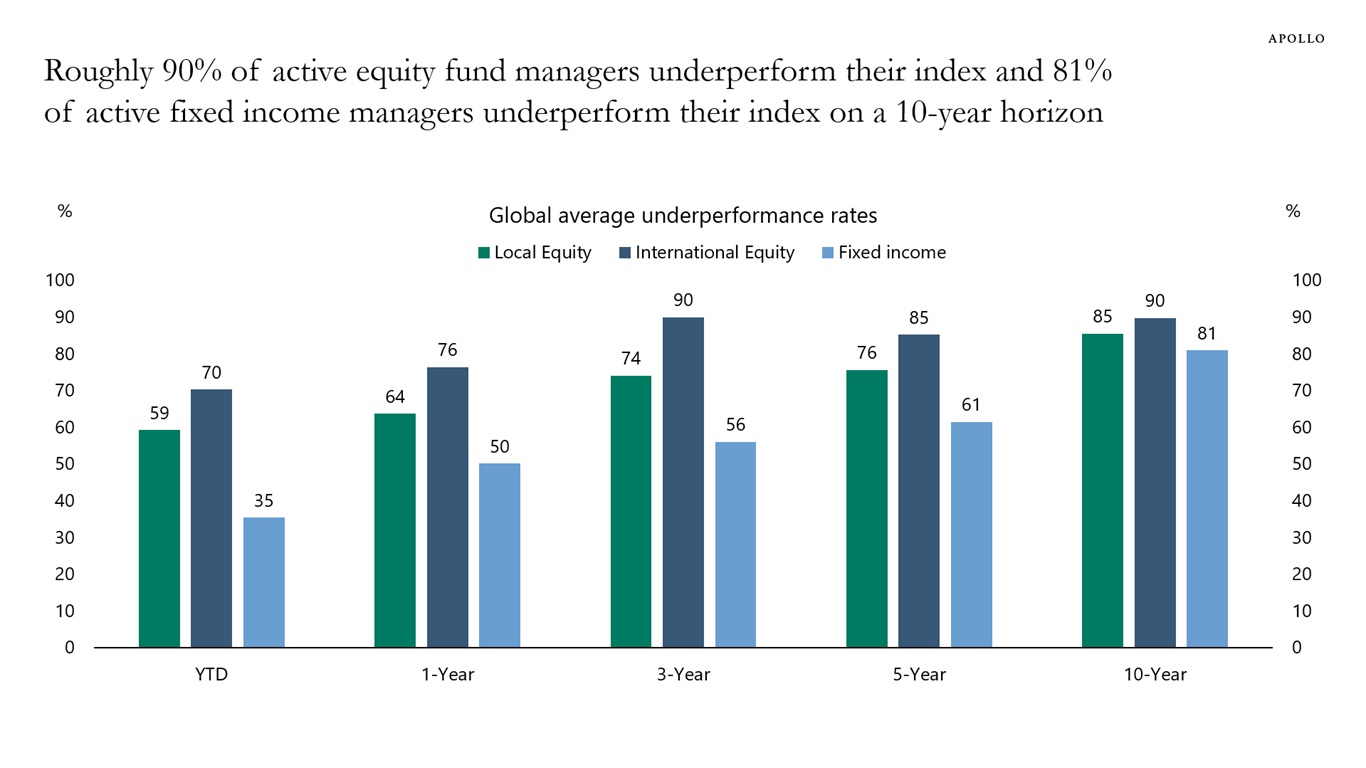
Note: Data as of June 30, 2024. Calculated as average of underperformance for each category for regions/countries: US, Europe, Canada, Australia, MENA, Brazil, Chile, South Africa, India, and Japan. Source: SPIVA Global Scorecard, Apollo Chief Economist See important disclaimers at the bottom of the page.
-
When the Fed started raising interest rates in March 2022, a lot of Fed speeches and market conversations focused on the long and variable lags of monetary policy, i.e., the time it takes before Fed hikes begin to slow down the economy.
Traditional impulse-response functions in VAR models and the Fed’s own model of the US economy, FRBUS, suggest that it should take 12 to 18 months before tighter monetary policy begins to slow the economy down.
However, it has been 30 months since the Fed started raising interest rates, and we have still not seen any sign of a slowdown. This week, we got GDP growth for the third quarter, and it came in at 2.8%. And the Atlanta Fed’s GDP estimate for fourth quarter GDP is 2.3%, above the CBO’s 2% estimate for long-run growth.
This is the key issue across the S&P 500, credit, FX, and private markets: What happened to long and variable lags? Why is GDP growth still above potential, and why did Fed hikes not slow down consumer spending and capex spending the way the textbook would have predicted?
There are three reasons:
First, the US economy has been less sensitive to interest rate increases because consumers and firms locked in low interest rates during the pandemic.
Second, the US economy continues to experience a big structural boom in AI and data centers.
Third, fiscal policy is easy with a 6% budget deficit, driven by the CHIPS Act, the IRA, the Infrastructure Act, and defense spending.
These tailwinds combined have offset the mildly negative impact of Fed hikes on highly leveraged consumers and firms.
In addition, these three tailwinds are unique to the US, which is why the business cycle is strong in the US and weak in the rest of the world.
With the Fed now cutting rates and these three tailwinds still in place, the outlook for the US economy continues to be positive.
Our latest chart book with daily and weekly indicators for the US economy is available here.
Source: BEA, Haver Analytics, Apollo Chief Economist 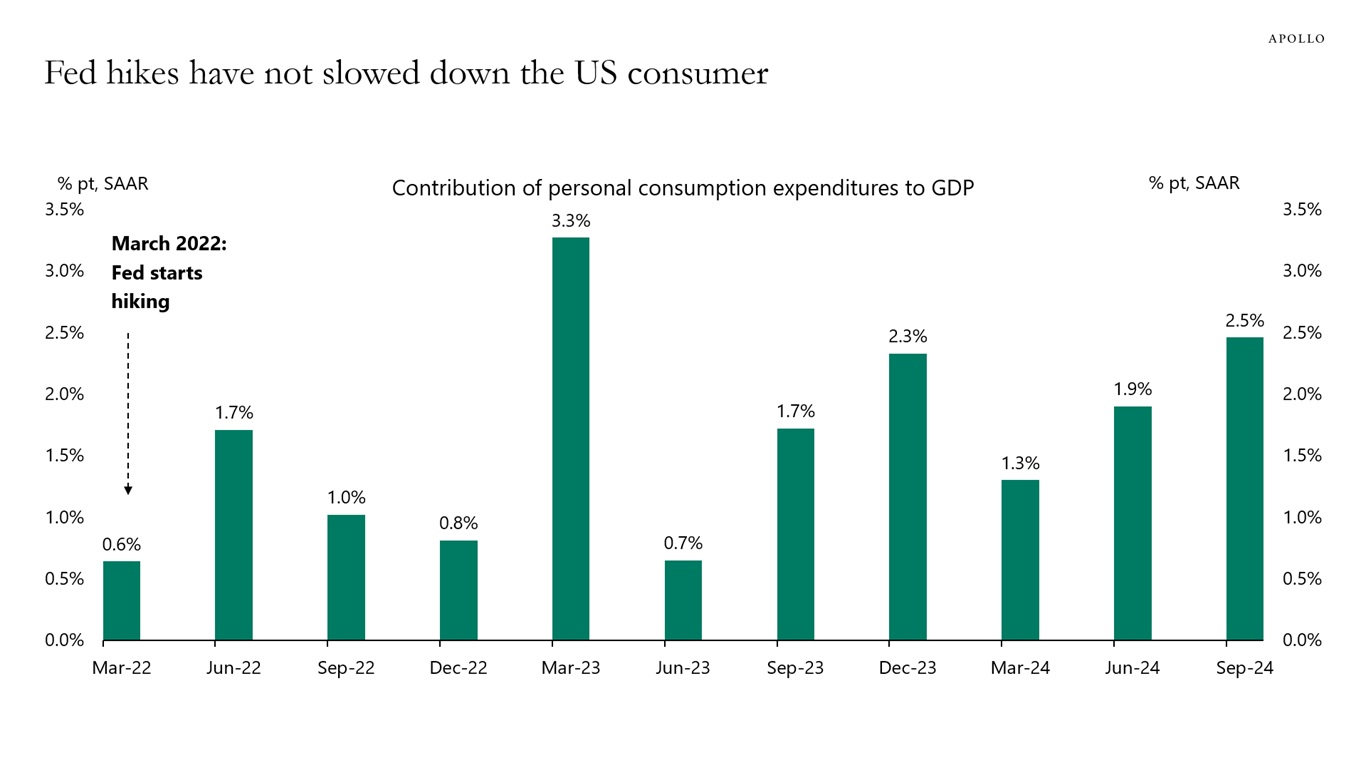
Source: BEA, Haver Analytics, Apollo Chief Economist See important disclaimers at the bottom of the page.
-
The financial system is changing, and our chart book shows that:
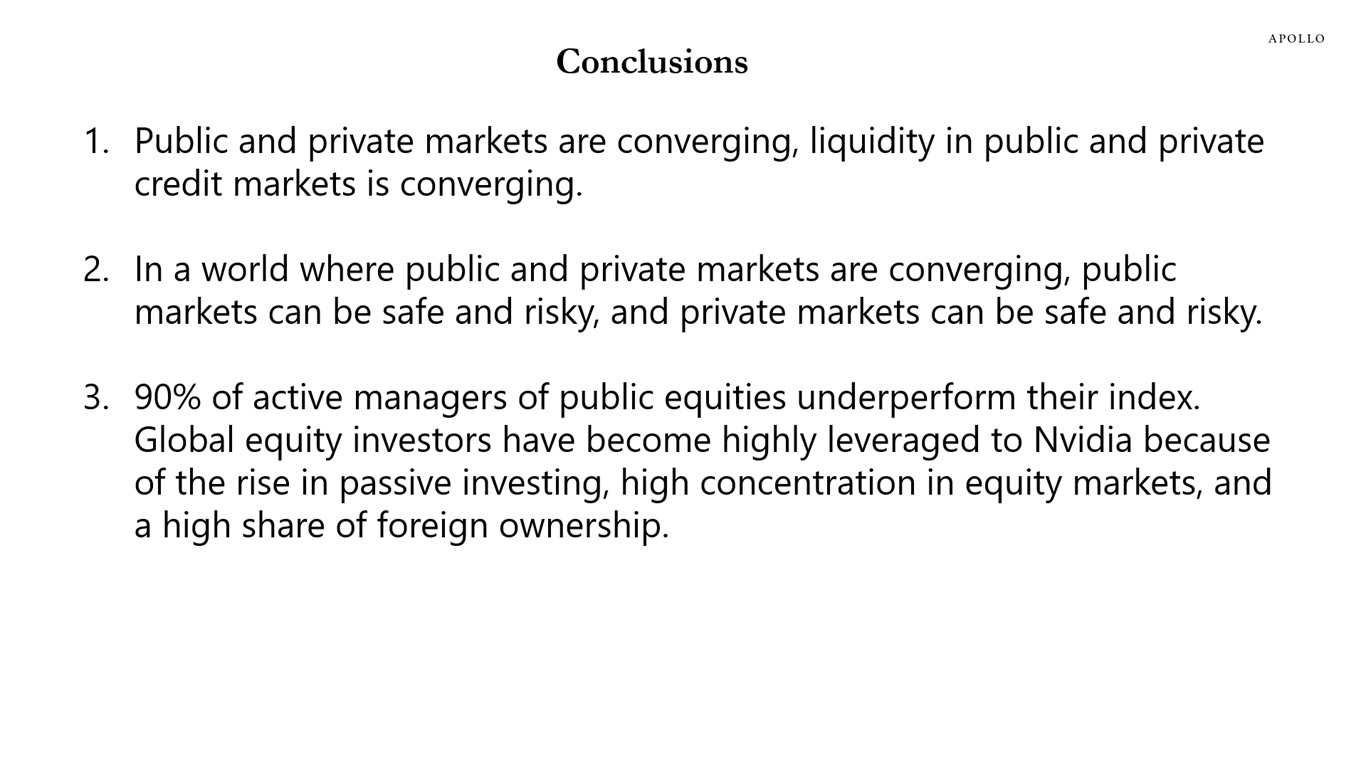
1) Public and private markets are converging,
2) Public markets can be safe and risky, and private markets can be safe and risky, and
3) Roughly 90% of active managers of public equity and public fixed income underperform their benchmark indexes.
Source: Apollo Chief Economist 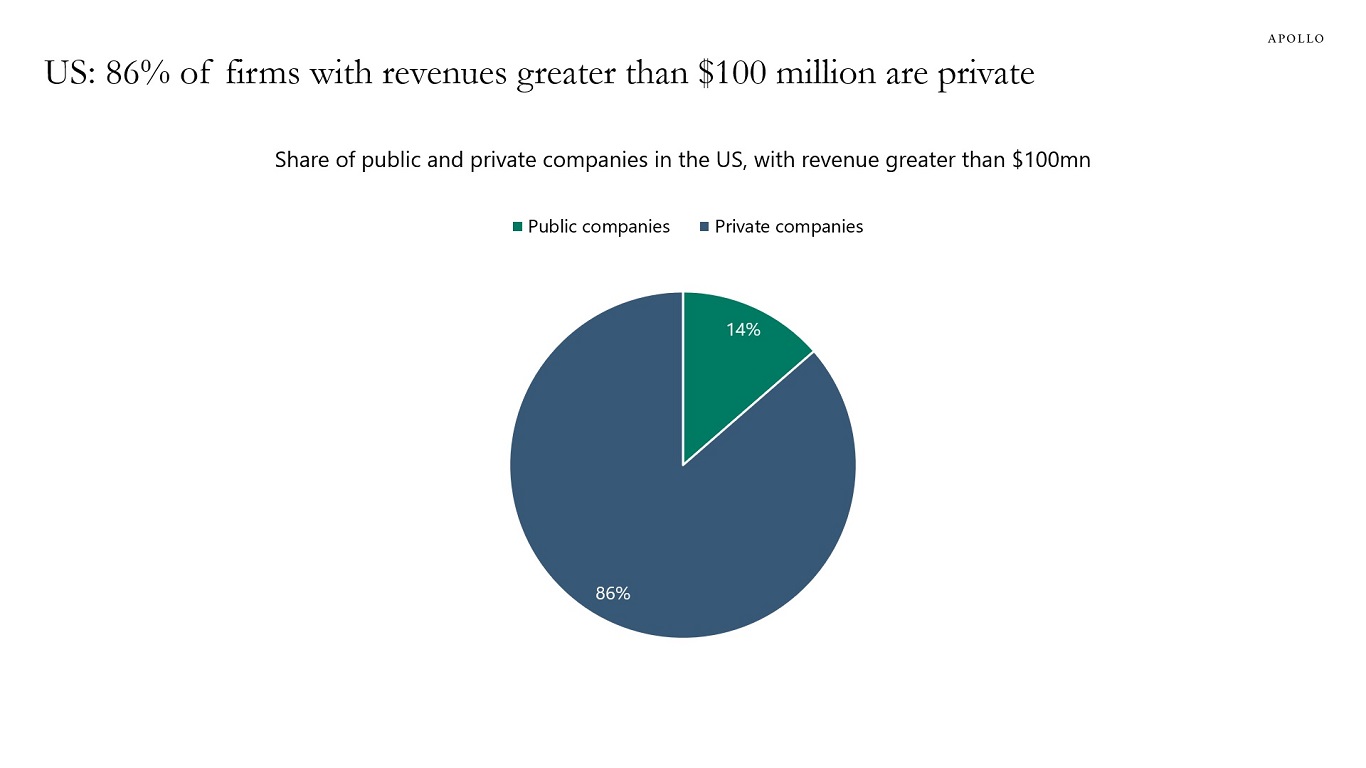
Note: For companies with last 12-month revenue greater than $100mn by count. Source: S&P Capital IQ, Apollo Chief Economist 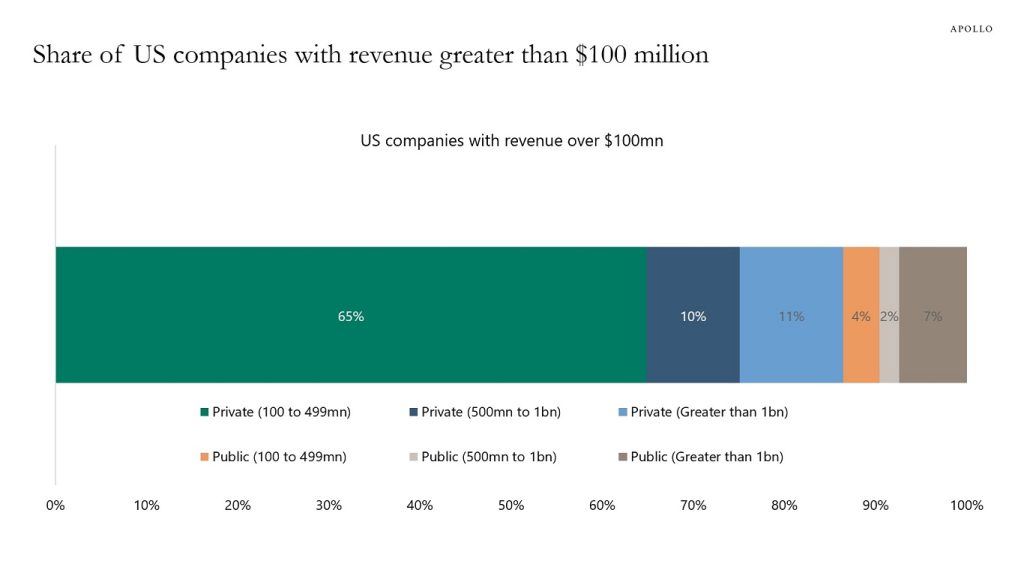
Source: S&P Capital IQ, Apollo Chief Economist 
Source: Bloomberg, Apollo Chief Economist 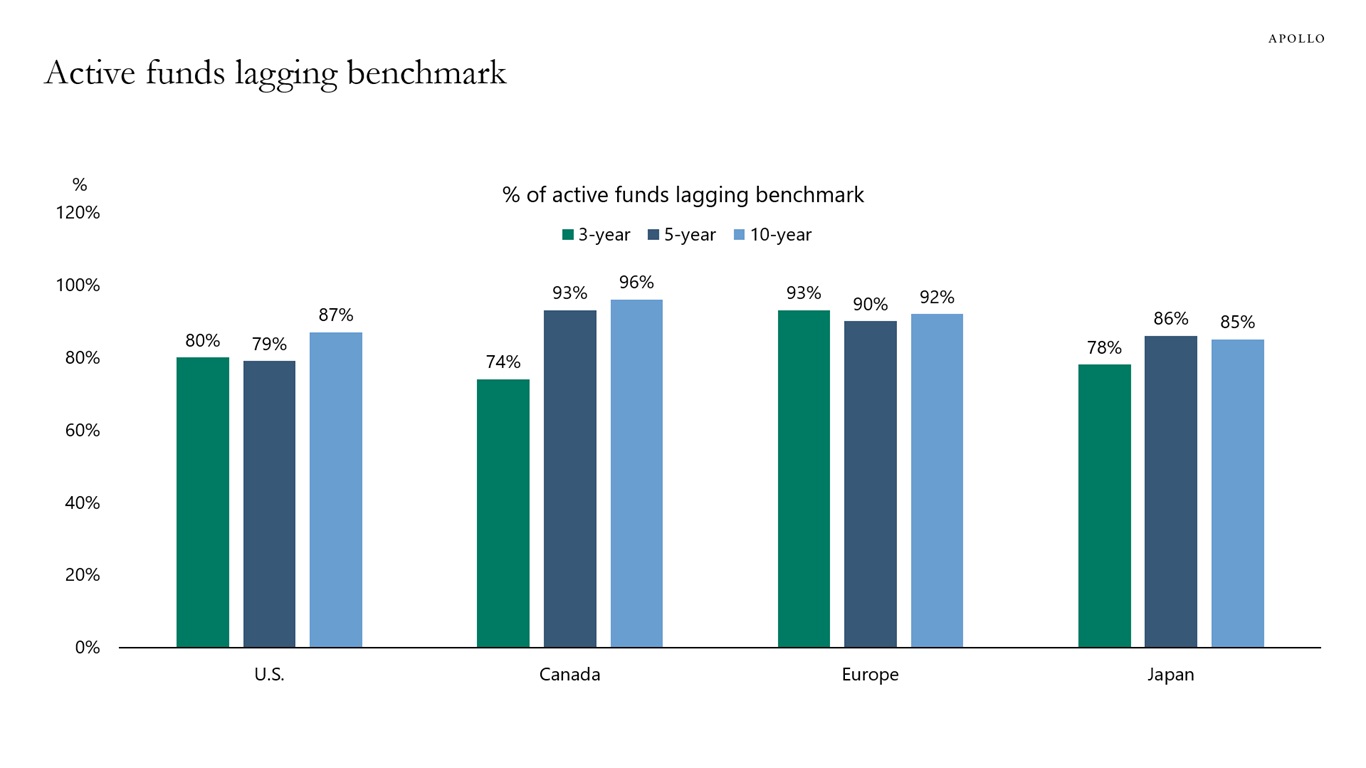
Source: Bloomberg, S&P SPIVA, Apollo Chief Economist See important disclaimers at the bottom of the page.

This presentation may not be distributed, transmitted or otherwise communicated to others in whole or in part without the express consent of Apollo Global Management, Inc. (together with its subsidiaries, “Apollo”).
Apollo makes no representation or warranty, expressed or implied, with respect to the accuracy, reasonableness, or completeness of any of the statements made during this presentation, including, but not limited to, statements obtained from third parties. Opinions, estimates and projections constitute the current judgment of the speaker as of the date indicated. They do not necessarily reflect the views and opinions of Apollo and are subject to change at any time without notice. Apollo does not have any responsibility to update this presentation to account for such changes. There can be no assurance that any trends discussed during this presentation will continue.
Statements made throughout this presentation are not intended to provide, and should not be relied upon for, accounting, legal or tax advice and do not constitute an investment recommendation or investment advice. Investors should make an independent investigation of the information discussed during this presentation, including consulting their tax, legal, accounting or other advisors about such information. Apollo does not act for you and is not responsible for providing you with the protections afforded to its clients. This presentation does not constitute an offer to sell, or the solicitation of an offer to buy, any security, product or service, including interest in any investment product or fund or account managed or advised by Apollo.
Certain statements made throughout this presentation may be “forward-looking” in nature. Due to various risks and uncertainties, actual events or results may differ materially from those reflected or contemplated in such forward-looking information. As such, undue reliance should not be placed on such statements. Forward-looking statements may be identified by the use of terminology including, but not limited to, “may”, “will”, “should”, “expect”, “anticipate”, “target”, “project”, “estimate”, “intend”, “continue” or “believe” or the negatives thereof or other variations thereon or comparable terminology.