


Want it delivered daily to your inbox?
-
The bottom 40% of incomes account for 22% of total consumer spending and 13% of total income, and the top 20% of incomes account for 39% of total consumer spending and 47% of total income, see chart below.
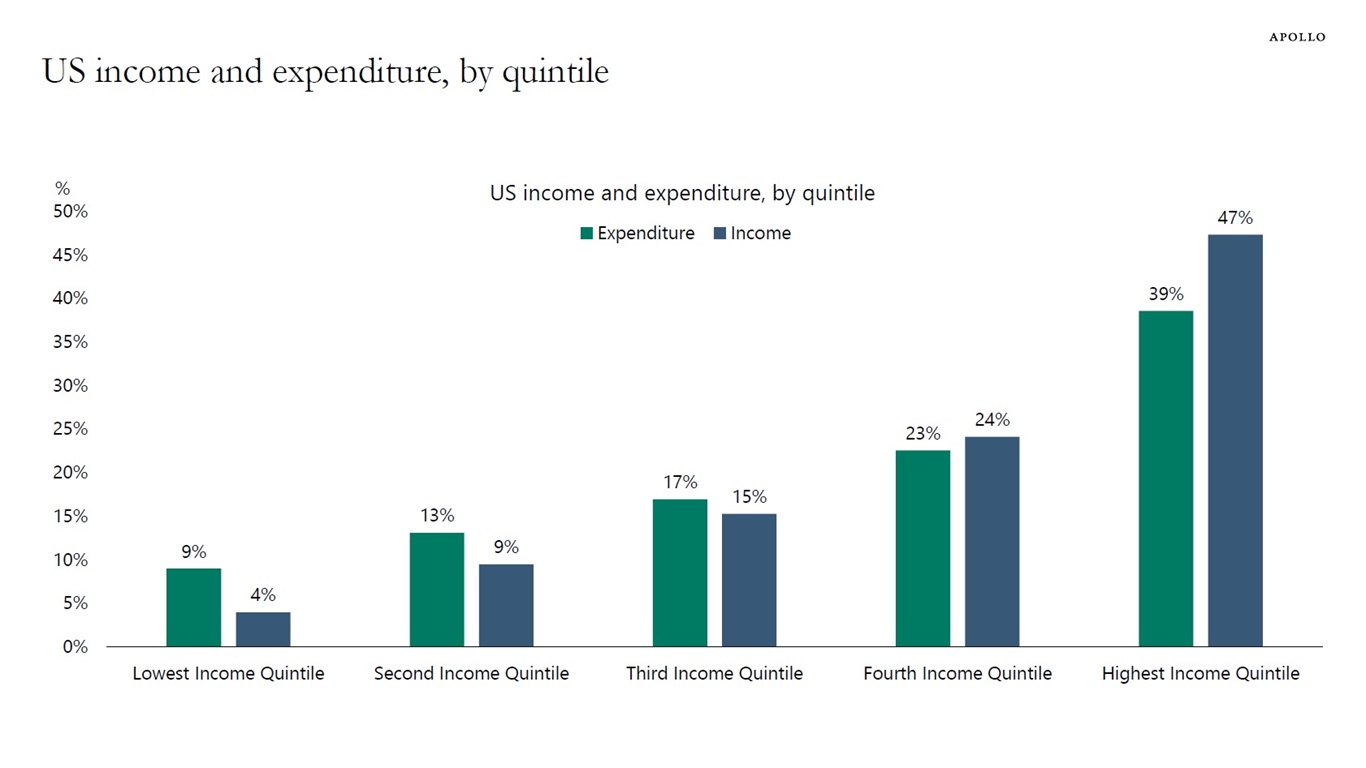
Data for 2022. Source: BLS, Haver Analytics, Apollo Chief Economist See important disclaimers at the bottom of the page.
-
The IMF is forecasting that in a few years GDP per capita in Poland will be higher than in Spain and at the same level as Italy, see chart below.
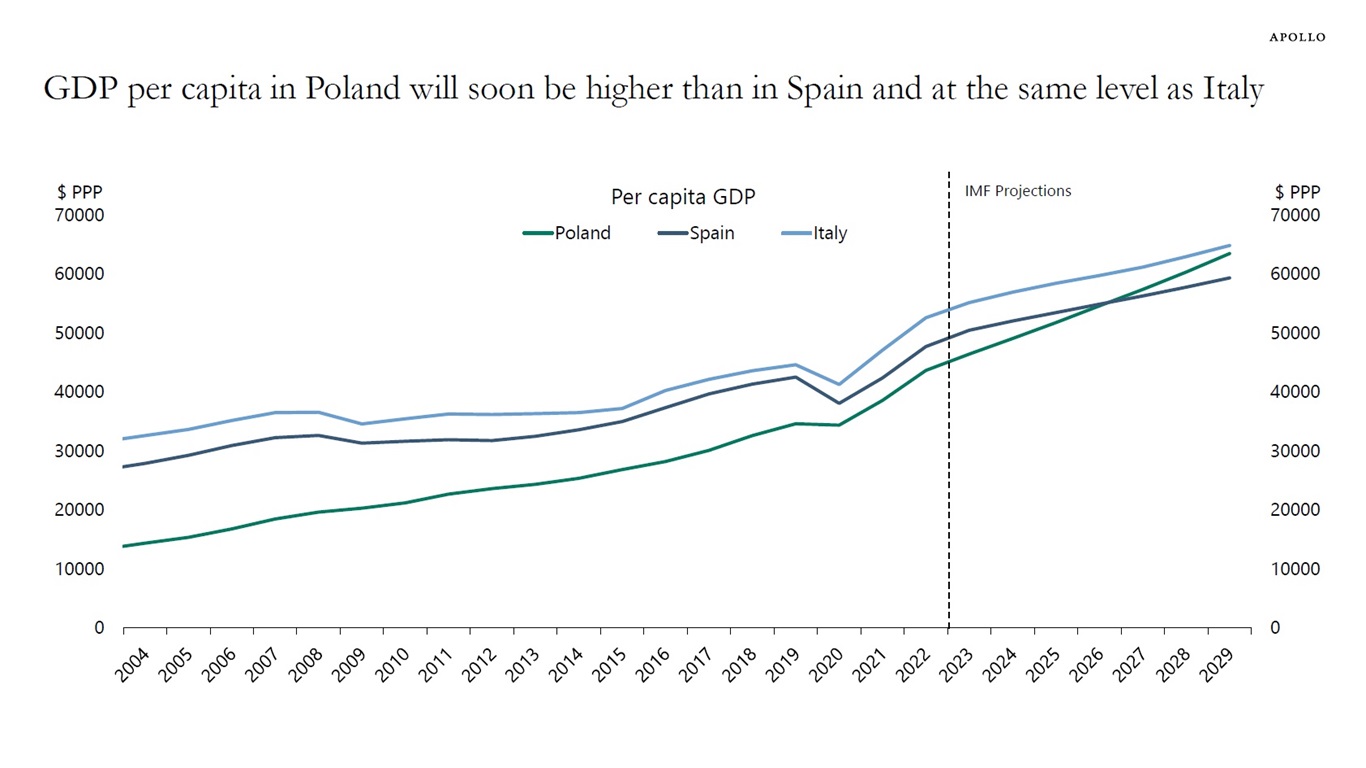
Source: IMF WEO, Haver Analytics, Apollo Chief Economist See important disclaimers at the bottom of the page.
-
The pharma industry currently accounts for about 70% of GDP growth in Denmark, see chart below.
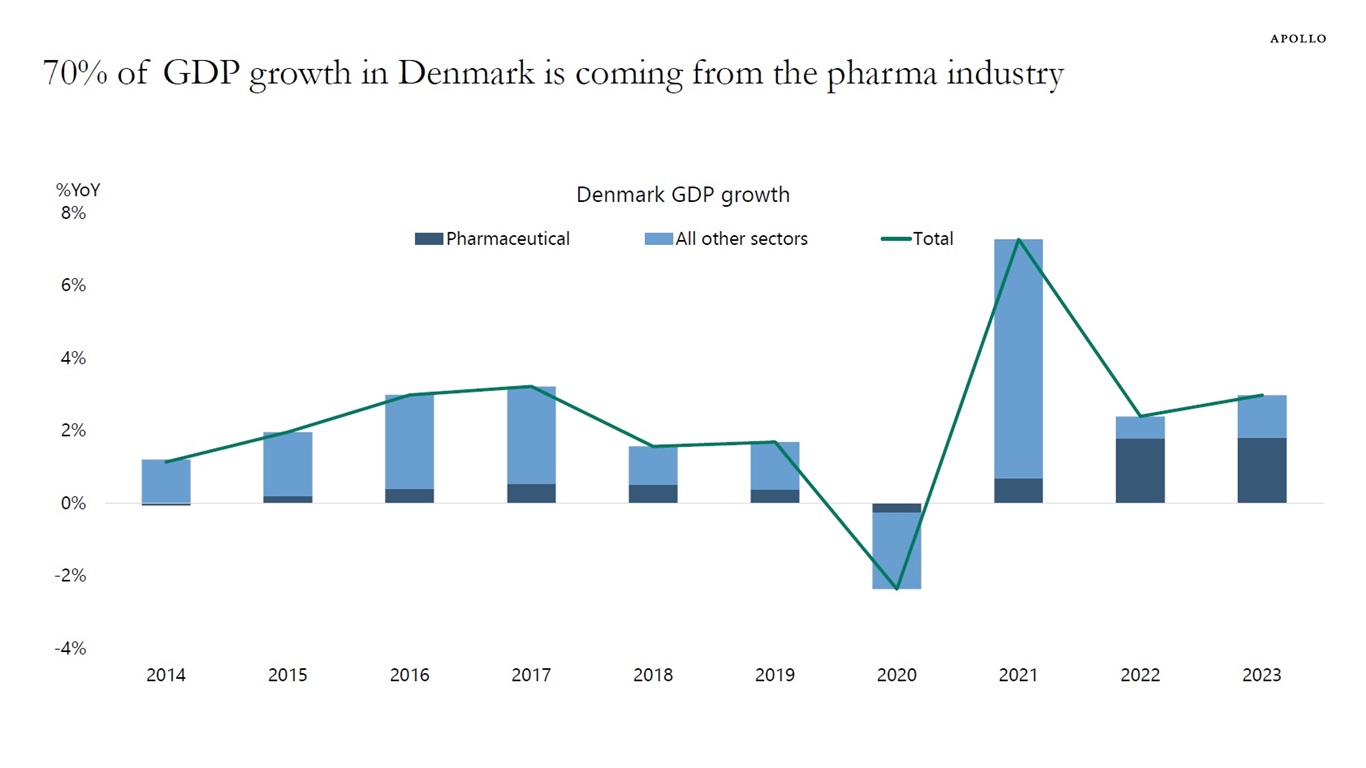
Source: Statistics Denmark, Apollo Chief Economist See important disclaimers at the bottom of the page.
-
Long-term loans to corporates are moving away from being financed by overnight deposits to instead being financed by the long-term liabilities of organizations such as insurers and pensions, thereby making the financial system more stable, see chart below.
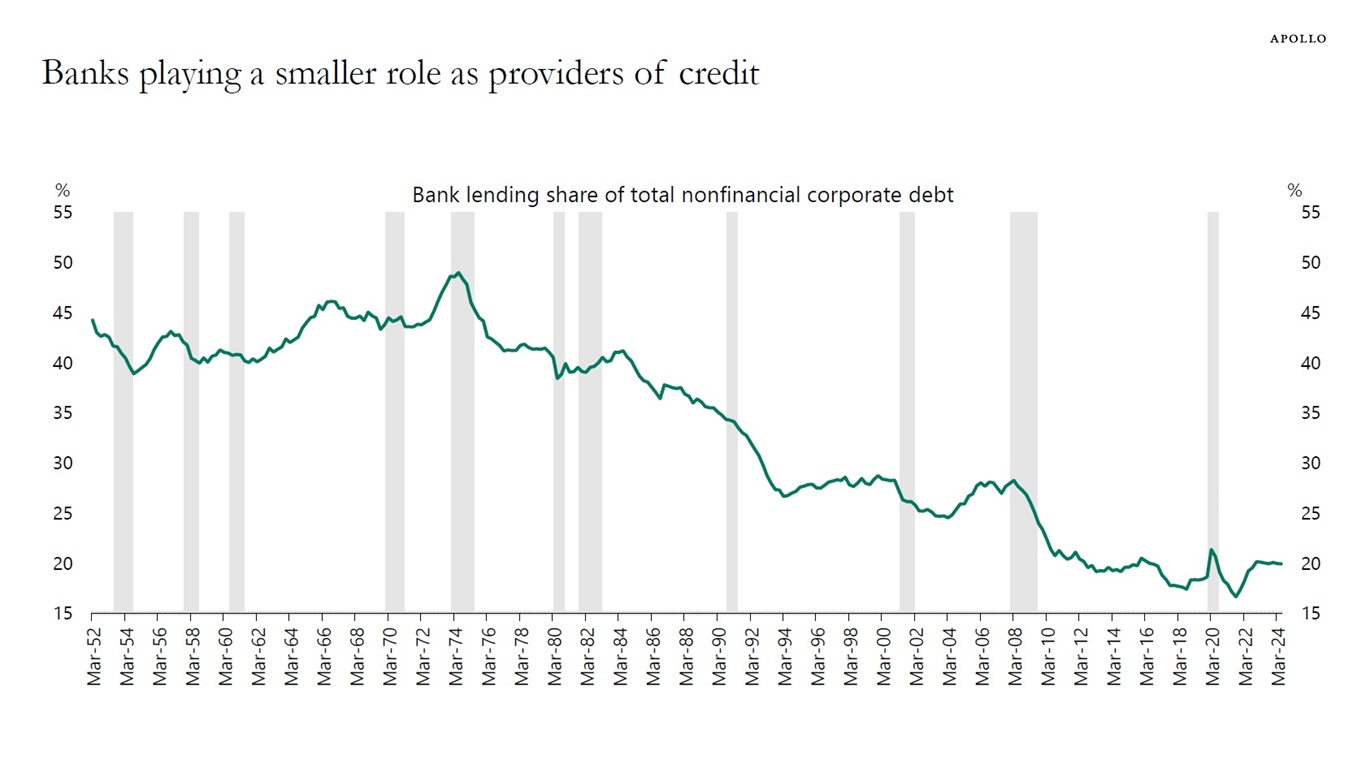
Source: FRB, Haver Analytics, Apollo Chief Economist See important disclaimers at the bottom of the page.
-
It is inconsistent to say that the incoming economic data is strong but the labor market is weakening.
For example, if the Atlanta Fed GDP Now estimate is 2.9%, significantly above the CBO’s 2% estimate of long-run growth, then job growth is accelerating and the unemployment rate is declining.
With the data for consumer spending, capex spending, and government spending still strong, we should soon begin to see a rebound in nonfarm payrolls and a decline in the unemployment rate.
That is also what the incoming data is showing:
1) This week, jobless claims declined to 219,000, and given this was the survey week for the September employment report, this suggests that nonfarm payrolls for September could come in at 300,000, see the first chart below.
2) The Atlanta Fed GDP Now estimate currently stands at 2.9%, and looking at the historical relationship, this implies that nonfarm payrolls in the third quarter will come in at 240,000 jobs created each month in July, August, and September, see the second chart. In other words, we could see a sharp rebound in job growth in September from the low levels we saw in July and August.
3) A new Fed paper looks at the procyclicality of quits and countercyclicality of layoffs and finds that layoffs are a leading indicator of a recession. During recessions, quits decline as layoffs increase. But this is not what the latest data for layoffs and quits to non-participation show, see the next four charts below.
4) Finally, with mortgage rates coming down and Case-Shiller at 5% we could see a rebound in the housing market, which could trigger a rebound in overall inflation, see the last chart.
With financial conditions easing further because of the 50bps Fed cut and still strong tailwinds to economic growth from the CHIPS Act, the IRA, the Infrastructure Act, strong AI spending, and strong defense spending, the bottom line is that there are no signs of the economy entering a recession. And because of these tailwinds, there are no reasons to expect a recession. On the contrary, the incoming data seen in our chart book (available here), in particular jobless claims and the Atlanta Fed GDP Now, are pointing to a reacceleration in employment growth over the coming months.
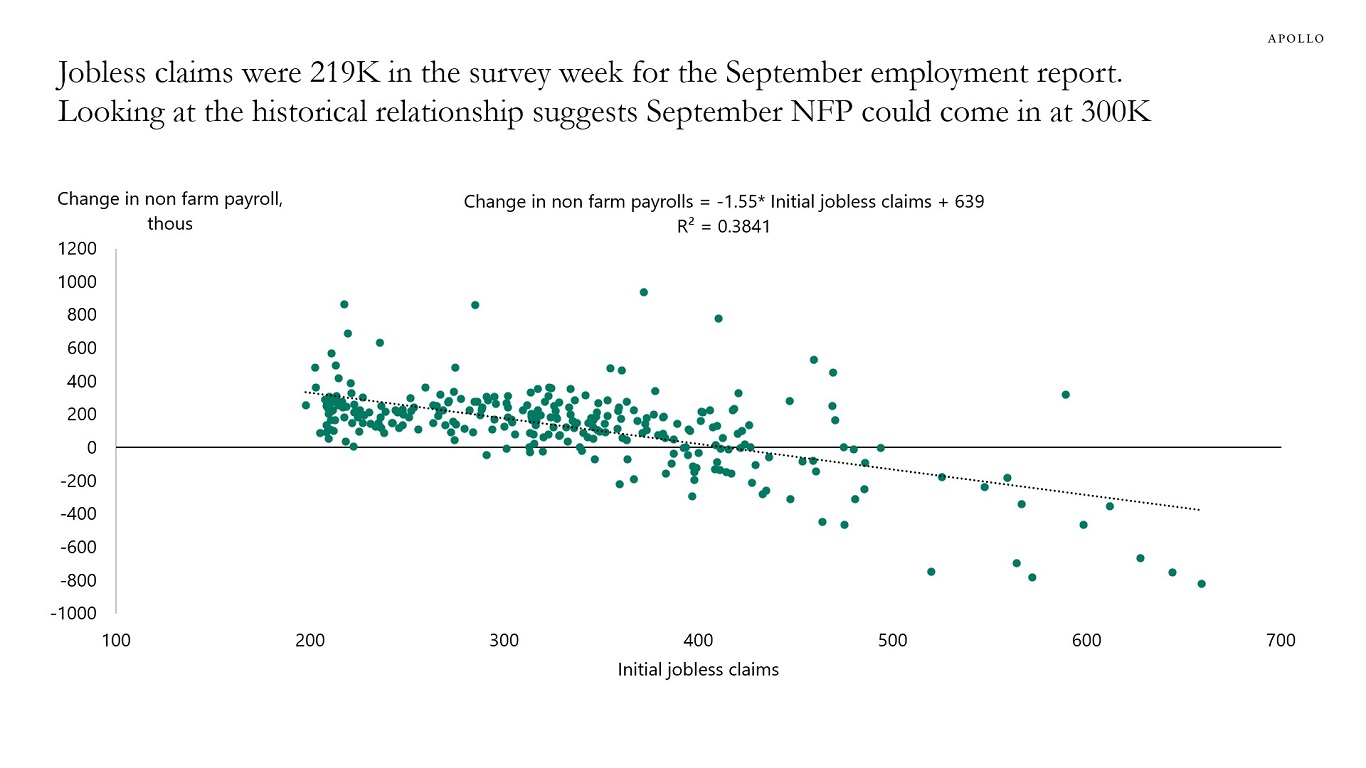
Note: Sample from Jan 2000 to Aug 2024 and excludes data from March 2020 to March 2021 due to Covid behavior. Source: BLS, DOL, Haver Analytics, Apollo Chief Economist 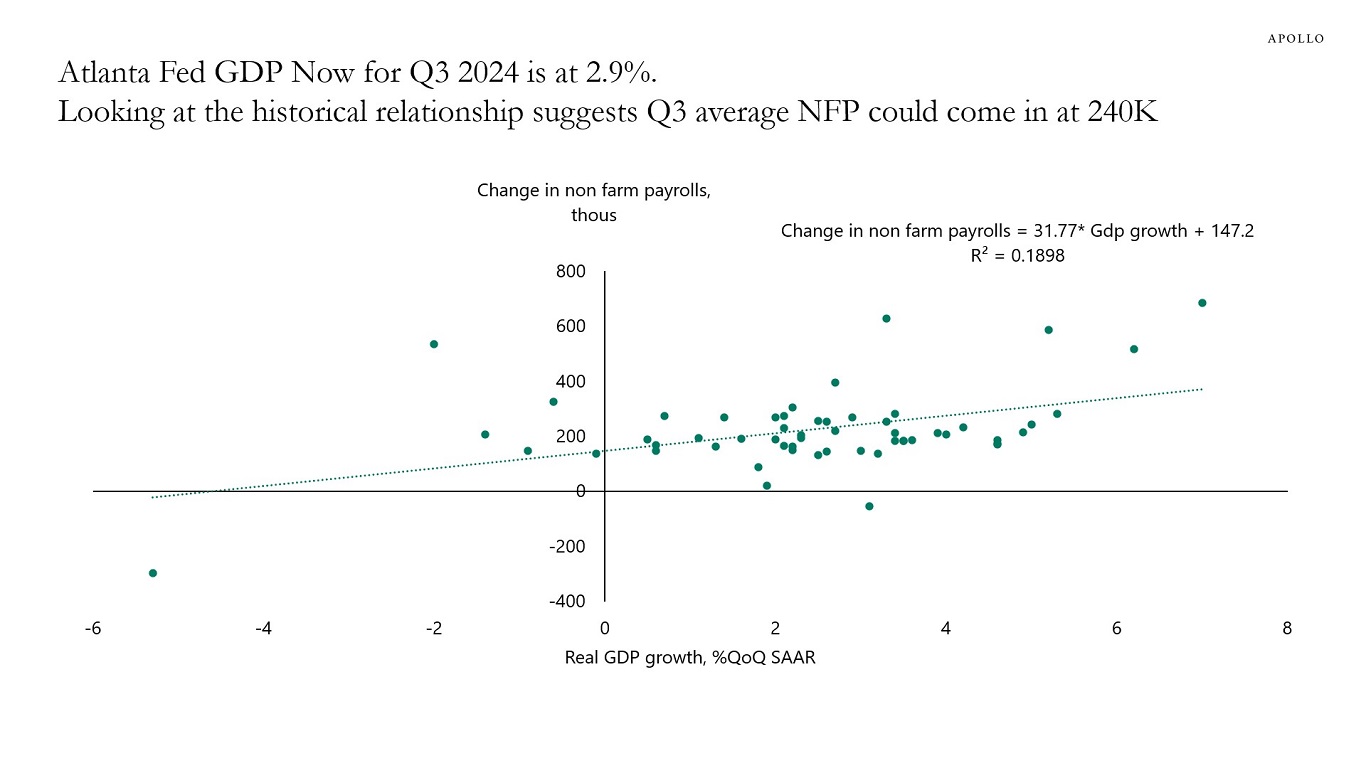
Note: Sample from Q12010 to Q22024 and excludes data from Q22020 and Q32020 due to Covid behavior. Source: BLS, DOL, Haver Analytics, Apollo Chief Economist 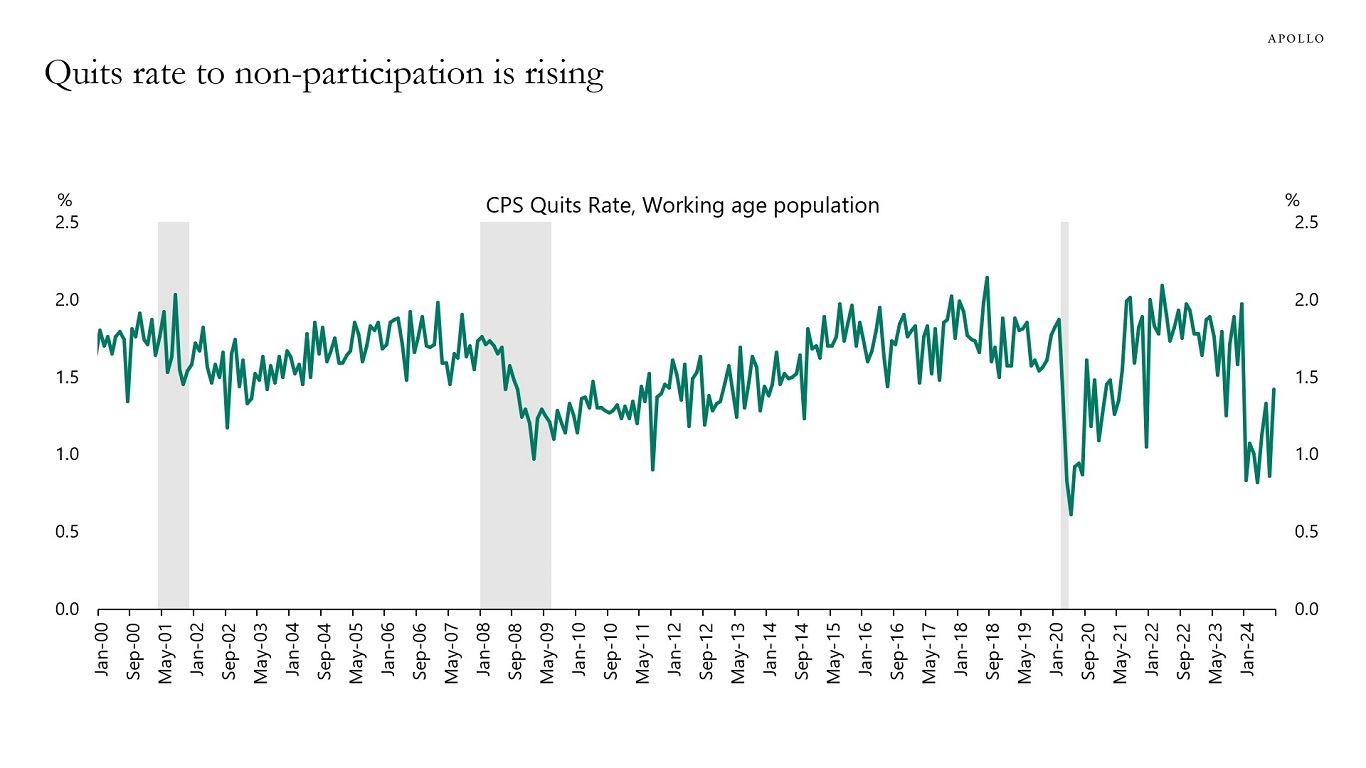
Source: Ellieroth and Mchaud (2024), “Quits, Layoffs, and Labor Supply”, Fed Working Paper, Haver Analytics, Apollo Chief Economist 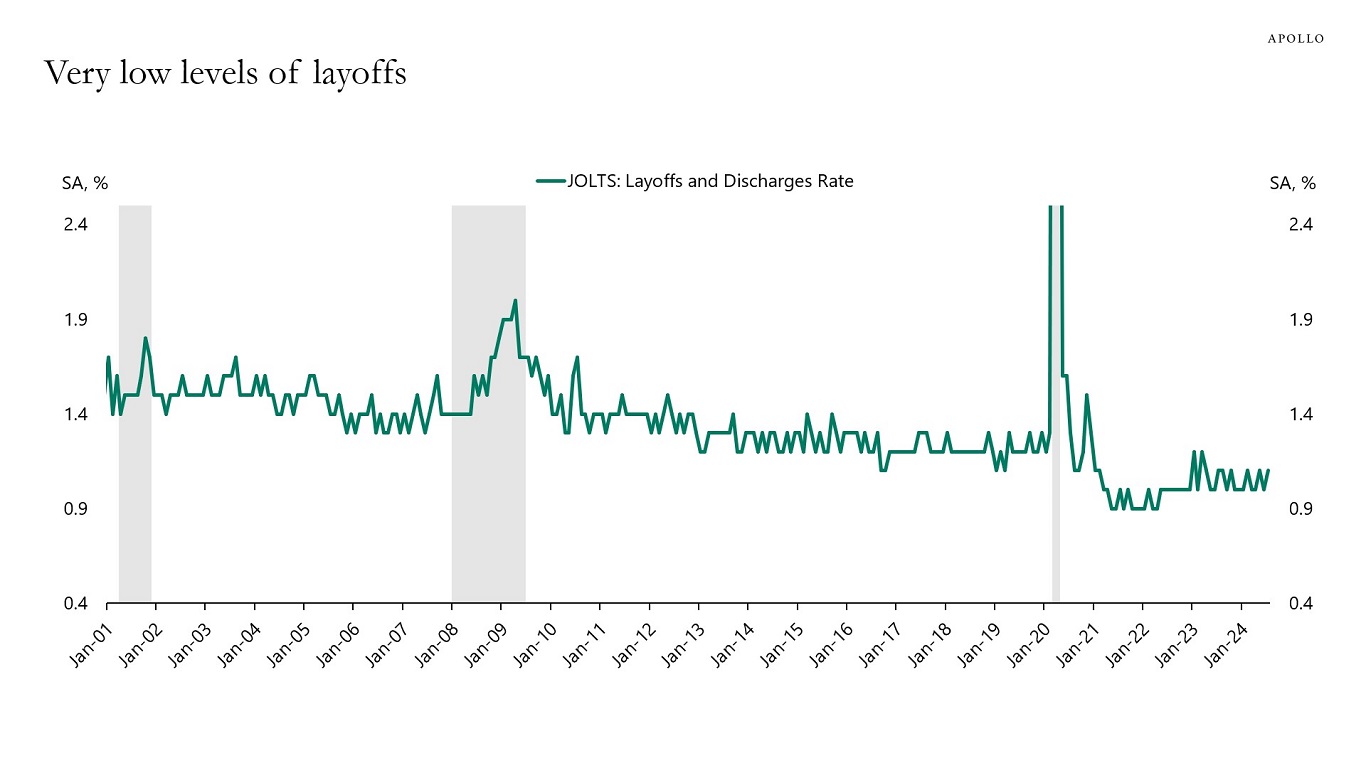
Source: BLS, Haver Analytics, Apollo Chief Economist 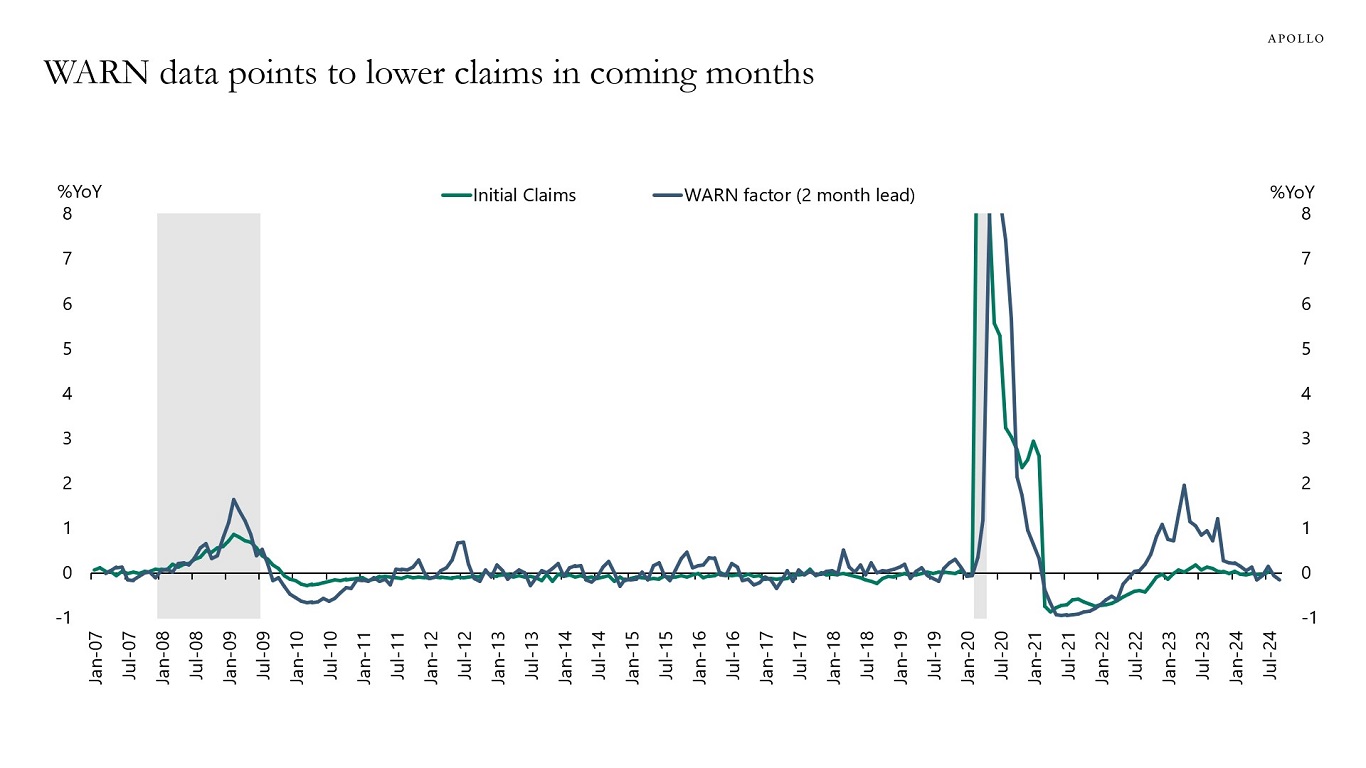
Note: The Worker Adjustment and Retraining Notification (WARN) Act helps ensure 60 to 90 days advance notice in cases of qualified plant closings and mass layoffs. WARN factor is the Cleveland Fed estimate for WARN notices (https://www.clevelandfed.org/publications/working-paper/wp-2003r-advance-layoff-notices-and-aggregate-job-loss). Source: Department of Labor, Haver Analytics, Federal Reserve Bank of Cleveland, Apollo Chief Economist 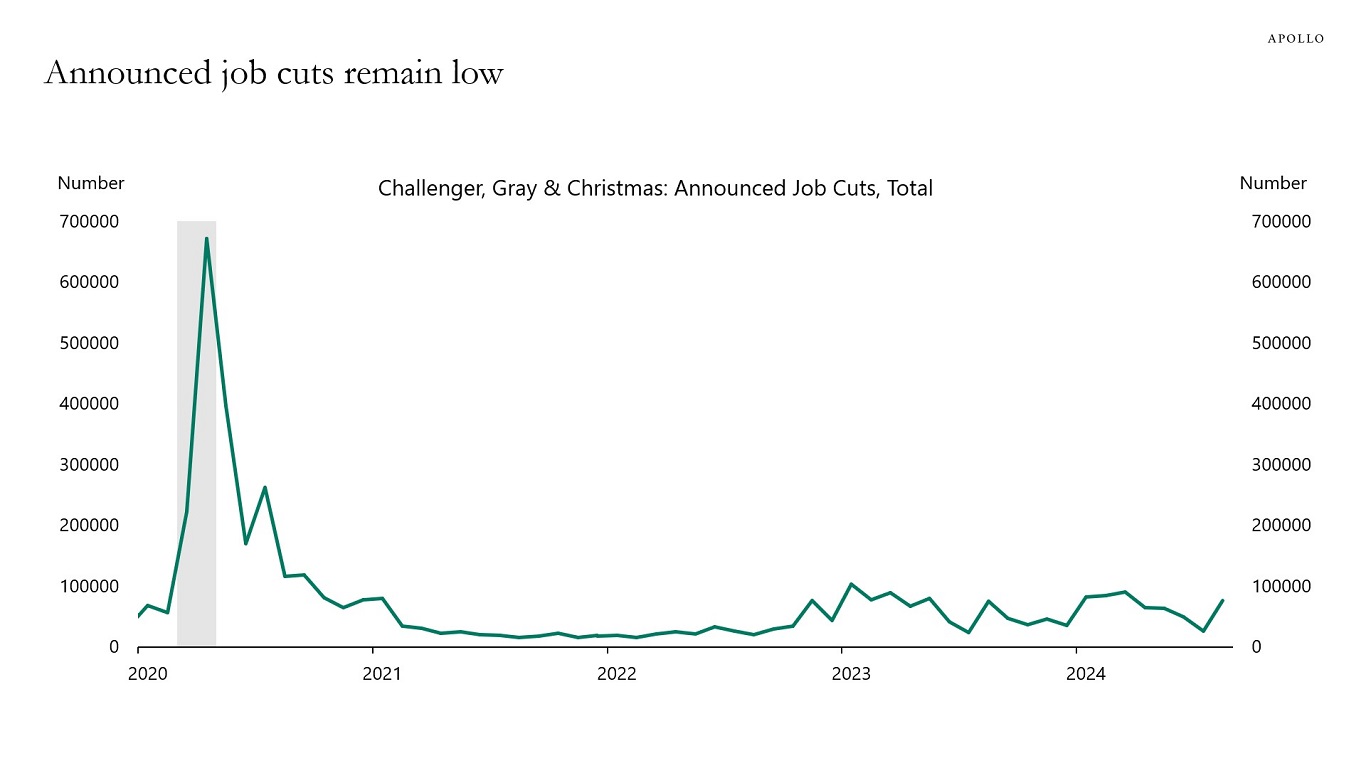
Source: Challenger, Gray & Christmas, Haver Analytics, Apollo Chief Economist 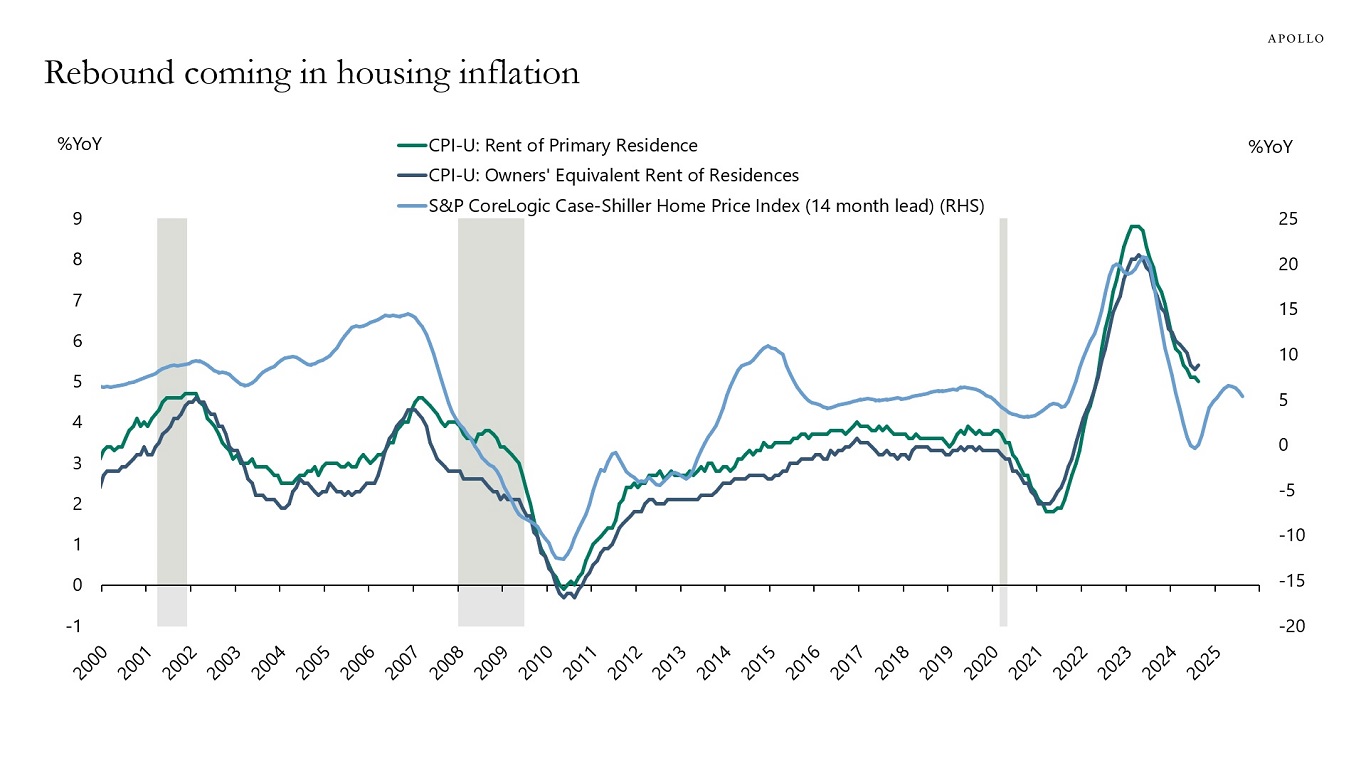
Source: Haver Analytics, BLS, S&P, Apollo Chief Economist See important disclaimers at the bottom of the page.
-
E-Verify is a Department of Homeland Security website that allows businesses to determine the eligibility of their employees, both US and foreign citizens, to work in the United States. Currently, only 23 states require the use of E-Verify for at least some public and/or private employers.
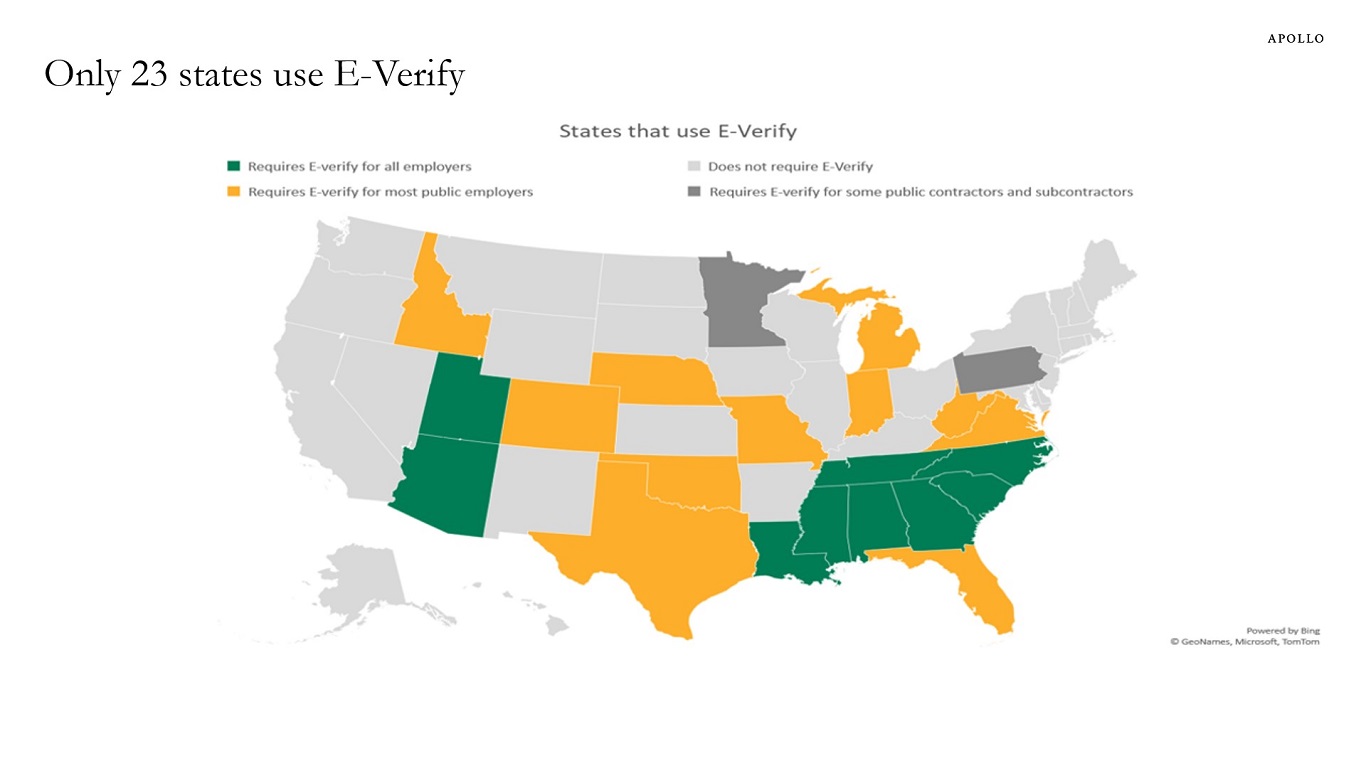
Note: E-Verify is a voluntary internet-based program to help employers verify the work authorization of all new hires. The program is administered by the US Department of Homeland Security in partnership with the Social Security Administration. Currently, 23 states require the use of E-Verify for at least some public and/or private employers. Source: NCSL, Apollo Chief Economist See important disclaimers at the bottom of the page.
-
Since the Fed started raising rates, the terminal rate has fluctuated between 2% and 4.5%, see chart below.
That’s a pretty wide range of outcomes.
The bottom line is that the market narrative at any point in time is almost always wrong.
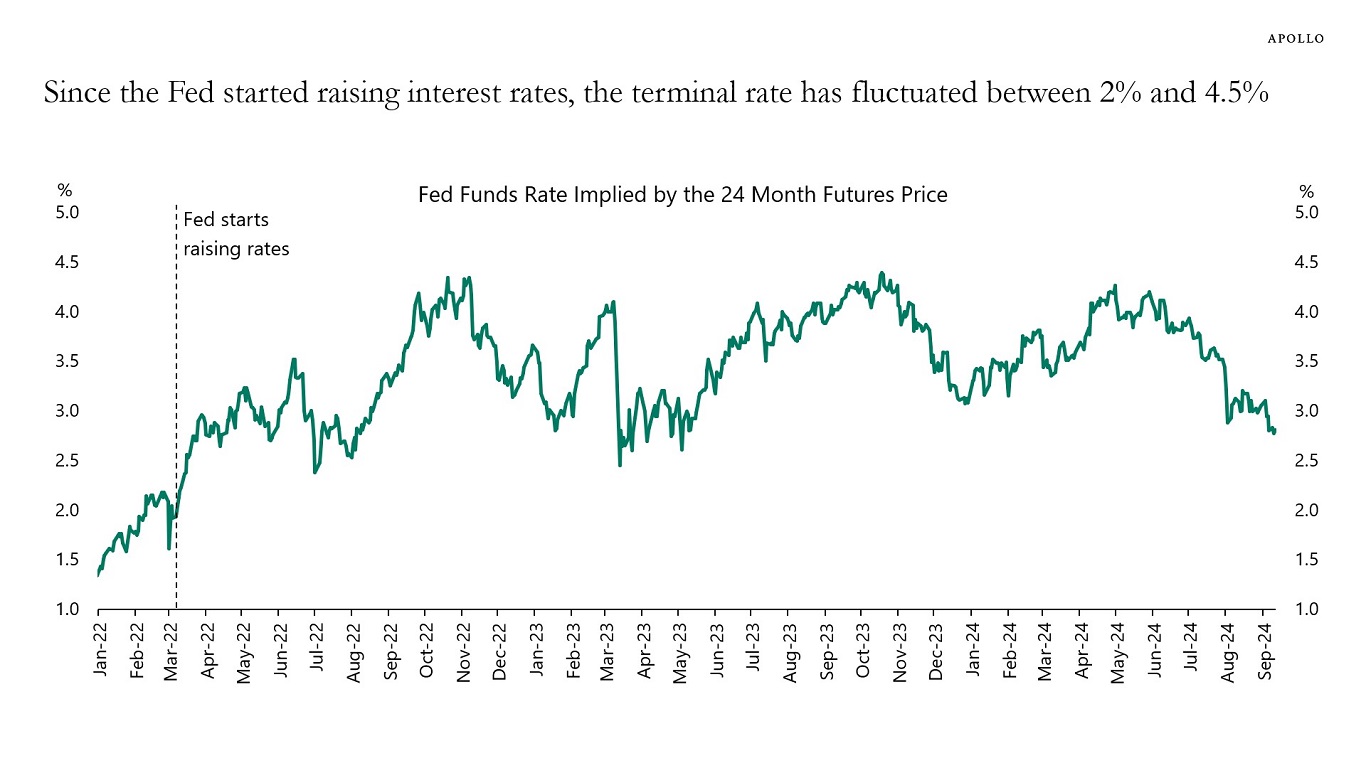
Source: CME, Haver Analytics, Apollo Chief Economist See important disclaimers at the bottom of the page.
-
Fed Chair Powell told the audience at Jackson Hole that “the time has come for policy to adjust,” acknowledging recent progress on inflation, and setting the scene for a rate cut today—the first reduction in more than four years.
While the announcement provided investors with much-needed clarity about the timing of the first rate cut, there remains a large deal of disagreement around the magnitude of rate cuts throughout the rest of the year and into 2025. It seems as though overnight investors have replaced concerns about a stubbornly high inflation with a possible recession that will force the Fed to cut rates more aggressively.
In our view, recent economic data—including the July and August payrolls reports—point to an economy that is slowing down but not heading into a recession. This was very much the outcome that the Fed was working towards given the resilience and stamina of the US economy over the past three years. While employment gains have been more moderate over the last three months, average hourly earnings have increased, and the unemployment rate declined in August. On top of that, recent economic indicators continue to point to a strong economy. Initial jobless claim applications fell to the lowest since July, US retail sales accelerated in July by the most since early 2023, and gross domestic product rose at a 3% annualized rate during the second quarter, up from the previous estimate of 2.8%. Other indicators continue to signal robust growth: Restaurant bookings, TSA travel data, hotel bookings and box office revenue remain strong.
Even if the Fed embarks on an easing cycle, we believe that interest rates will remain relatively higher for longer. If we assume the interest rate futures market is correct in pricing in at least four rate cuts in 2024—which we believe is overblown—short-term interest rates would by the end of 2024 be around 4.5%, a level that would still be the highest for overnight rates since 2007 (excluding the Fed’s current hiking cycle). Furthermore, if we take in the expectations for additional ~five rate cuts in 2025, rates will reach 3% by the end of next year, which is nearly double the average 1.8% rate over the past decade.
A soft landing remains our base case, driving our broadly constructive view on direct lending. Our expectation remains that it will take longer for inflation to come down to the central bank’s 2% target range, and as a result the curve will continue to steepen, meaning long rates are going to decline less than short rates. The combination of a strong economic backdrop along with elevated yields further out the curve is favorable for high-quality private credit. With private credit spreads of 5%-6% and Original Issue Discounts of 2% factored in, investors should still be able to command solid returns over the coming years. We continue to believe that the opportunity set to lend to bigger businesses on a first lien, senior secured basis at elevated yields remains attractive.
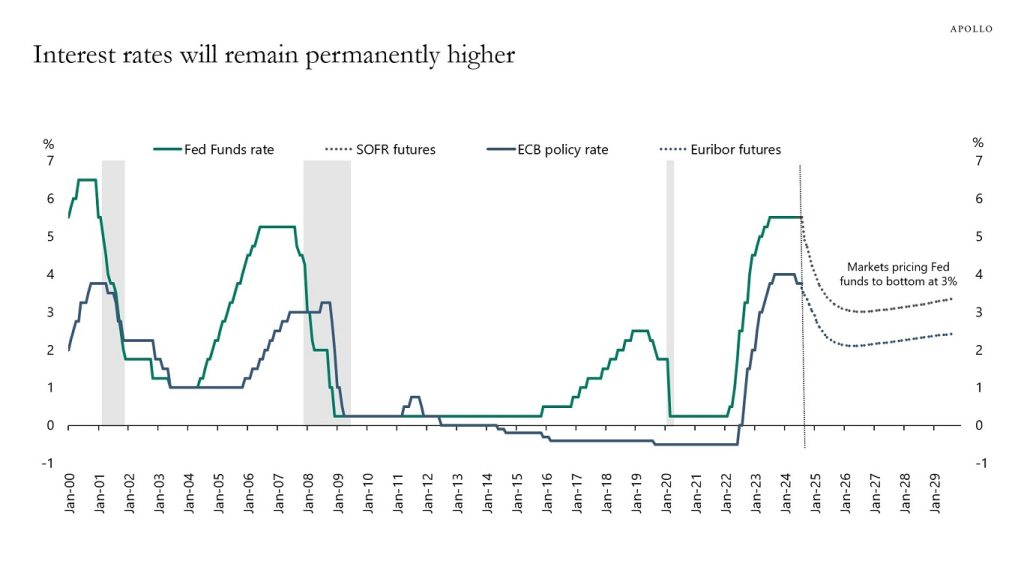
Source: Bloomberg, Apollo Chief Economist See important disclaimers at the bottom of the page.
-
Despite surveys showing that the consensus is expecting a soft landing, rates markets are pricing in a full-blown recession, see chart below.
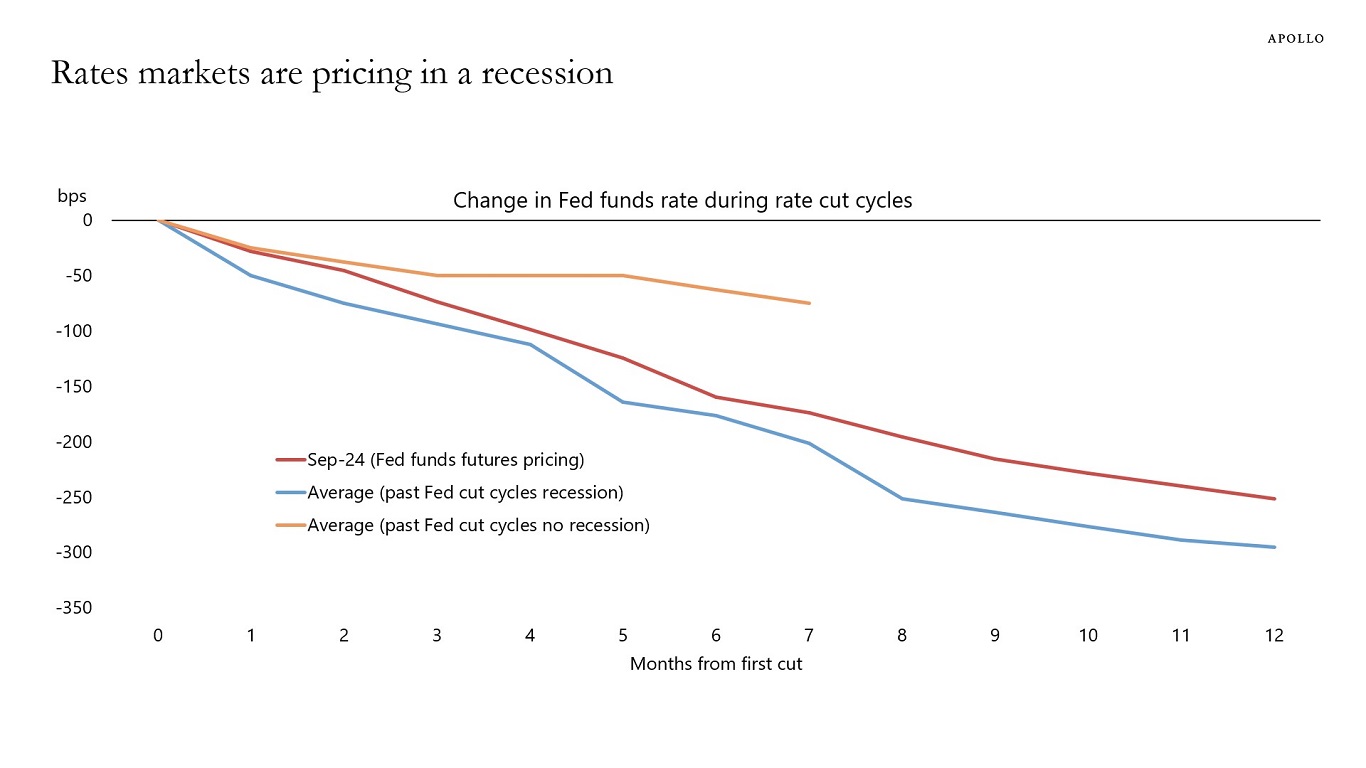
Source: FRB, Haver Analytics, Bloomberg, Apollo Chief Economist See important disclaimers at the bottom of the page.
-
Manufacturing wages in China are now 20% of manufacturing wages in the US, and manufacturing wages in India are 3% of US wages, see chart below.
For comparison, GDP per capita in the US is $76,000, in China it is $13,000, and in India $2,000.
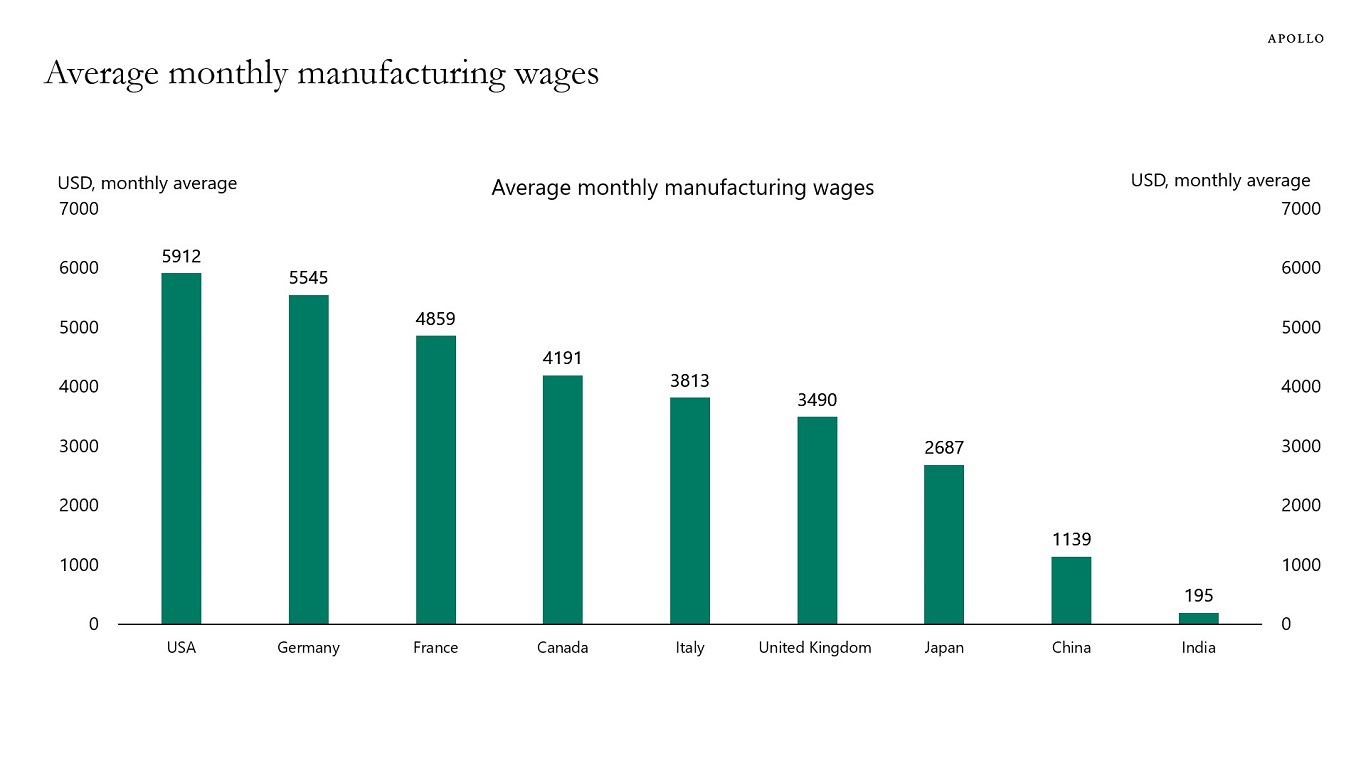
Note: Canada, United Kingdom, United States of America and India data is for 2023. Germany, France, Italy and China data is for 2022. Japan data is for 2021. Source: ILO, National Bureau of Statistics of China, Apollo Chief Economist See important disclaimers at the bottom of the page.

This presentation may not be distributed, transmitted or otherwise communicated to others in whole or in part without the express consent of Apollo Global Management, Inc. (together with its subsidiaries, “Apollo”).
Apollo makes no representation or warranty, expressed or implied, with respect to the accuracy, reasonableness, or completeness of any of the statements made during this presentation, including, but not limited to, statements obtained from third parties. Opinions, estimates and projections constitute the current judgment of the speaker as of the date indicated. They do not necessarily reflect the views and opinions of Apollo and are subject to change at any time without notice. Apollo does not have any responsibility to update this presentation to account for such changes. There can be no assurance that any trends discussed during this presentation will continue.
Statements made throughout this presentation are not intended to provide, and should not be relied upon for, accounting, legal or tax advice and do not constitute an investment recommendation or investment advice. Investors should make an independent investigation of the information discussed during this presentation, including consulting their tax, legal, accounting or other advisors about such information. Apollo does not act for you and is not responsible for providing you with the protections afforded to its clients. This presentation does not constitute an offer to sell, or the solicitation of an offer to buy, any security, product or service, including interest in any investment product or fund or account managed or advised by Apollo.
Certain statements made throughout this presentation may be “forward-looking” in nature. Due to various risks and uncertainties, actual events or results may differ materially from those reflected or contemplated in such forward-looking information. As such, undue reliance should not be placed on such statements. Forward-looking statements may be identified by the use of terminology including, but not limited to, “may”, “will”, “should”, “expect”, “anticipate”, “target”, “project”, “estimate”, “intend”, “continue” or “believe” or the negatives thereof or other variations thereon or comparable terminology.