


Want it delivered daily to your inbox?
-
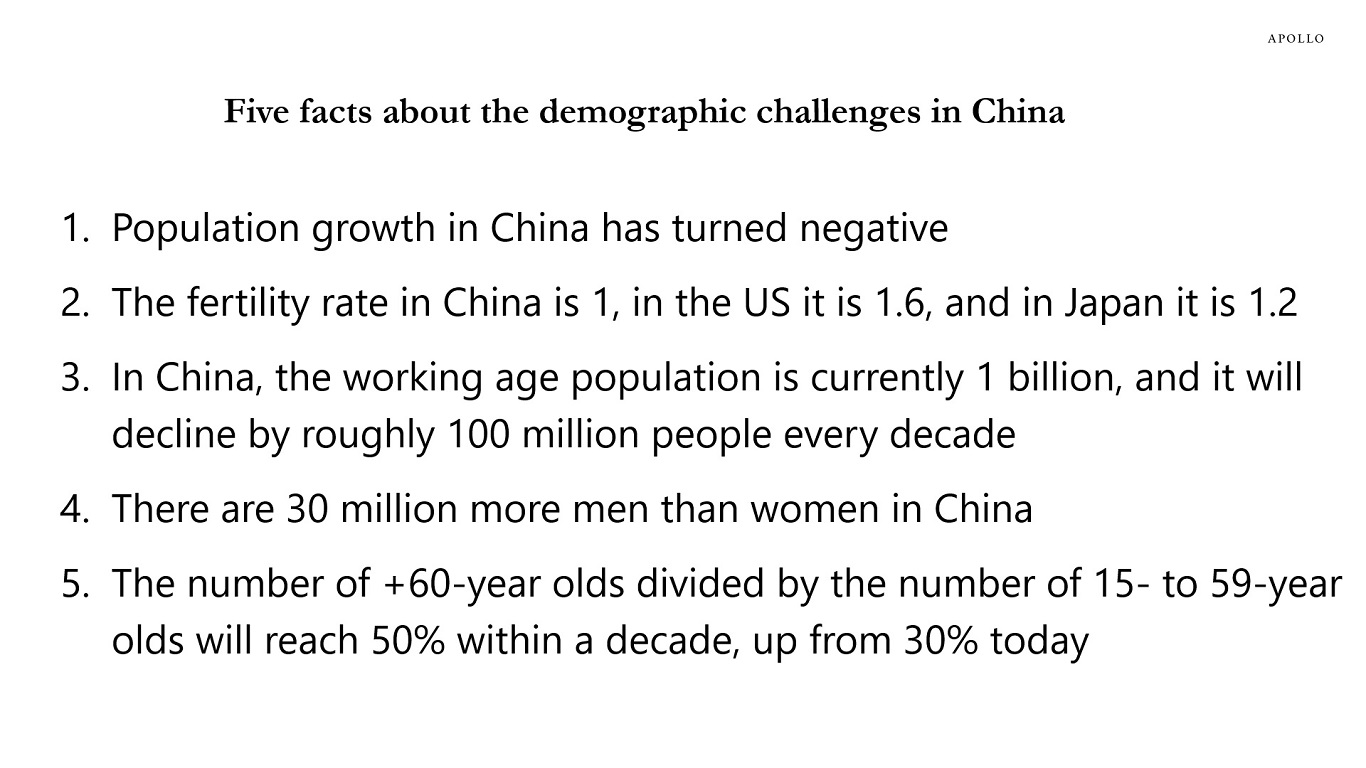
The Chinese population is shrinking, and the UN forecasts that the Chinese working age population will decline by roughly 100 million people every decade. These demographic headwinds are significant and a major drag on growth in China, see below and in our chart book available here.
A shrinking population with fewer working age individuals means fewer taxpayers, more spending on government services for retired people, and overcapacity, as companies can no longer fill existing factories with workers.
For investors, the implication is slower growth, more disinflationary pressures, and weaker global demand for commodities.
Source: Apollo Chief Economist See important disclaimers at the bottom of the page.
-
It used to be the case that the percentage of foreign companies listed on European and US stock exchanges was very similar at around 15%, see chart below. But, over the past decade, the share of foreign companies listed on stock exchanges has declined significantly in Europe and increased significantly in the US.
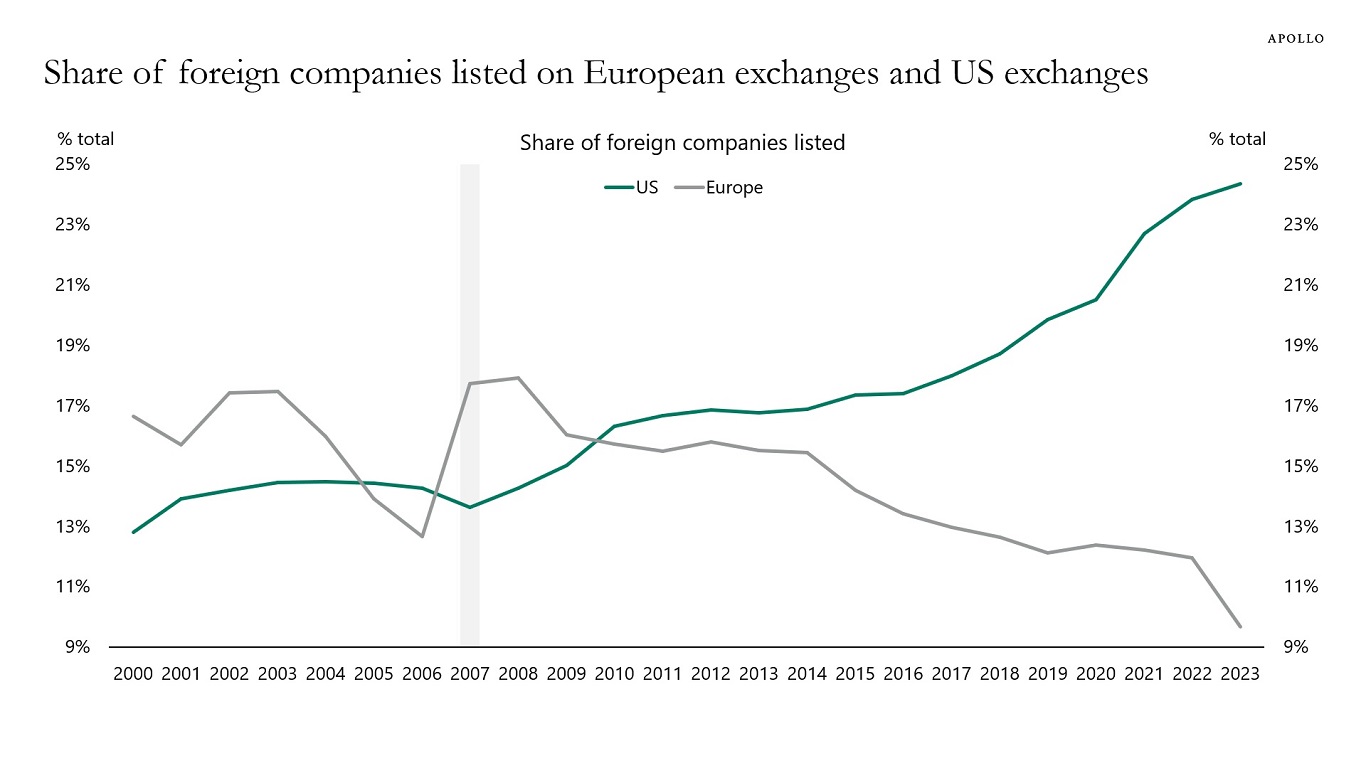
US = NYSE and Nasdaq US, Europe = LSE, Euronext, Deutsche Boerse AG and Nasdaq Nordic.
Sources: World Federation of Exchanges, Apollo Chief EconomistSee important disclaimers at the bottom of the page.
-
This week, jobless claims declined, GDP was revised higher, and personal income was higher than consensus expected. Our daily and weekly indicators continue to show no signs of a slowdown, see our chart book.
Or, from a markets perspective, if the economy is about to enter a recession and the unemployment rate is about to go up, why is Walmart’s stock price trading at an all-time high?
With this backdrop, let’s quantify what Fed cuts will do to the economy.
The Fed is saying that monetary policy is restrictive and the Fed funds rate needs to normalize and come down to r-star, which they estimate to be around 3%.
We ran a simulation on a simplified version of the Fed’s model for the US economy, FRBUS, to quantify what the normalization of interest rates means for GDP and inflation.
Assuming a 100bps cut to the Fed funds rate this year and an additional 150bps in forward guidance about more cuts coming will boost GDP by 2% and inflation by 1%, see simulations below.
In short, the current excitement about a dramatic amount of rate cuts is ignoring the significant positive effects these cuts will have on the stock market, credit spreads, consumer spending, capex spending, corporate earnings, and inflation.
Combined with a continued strong tailwind to the economy from fiscal policy and massive investments in AI, the risks are rising that Fed cuts are going to boost stock prices and tighten credit spreads and trigger a reacceleration in GDP and inflation, see again simulations below.
The bottom line is that the r-star framework is missing what “normalizing interest rates” means for the economy, and this is particularly problematic when the Fed funds rate is significantly higher than the model-calculated terminal policy rate.
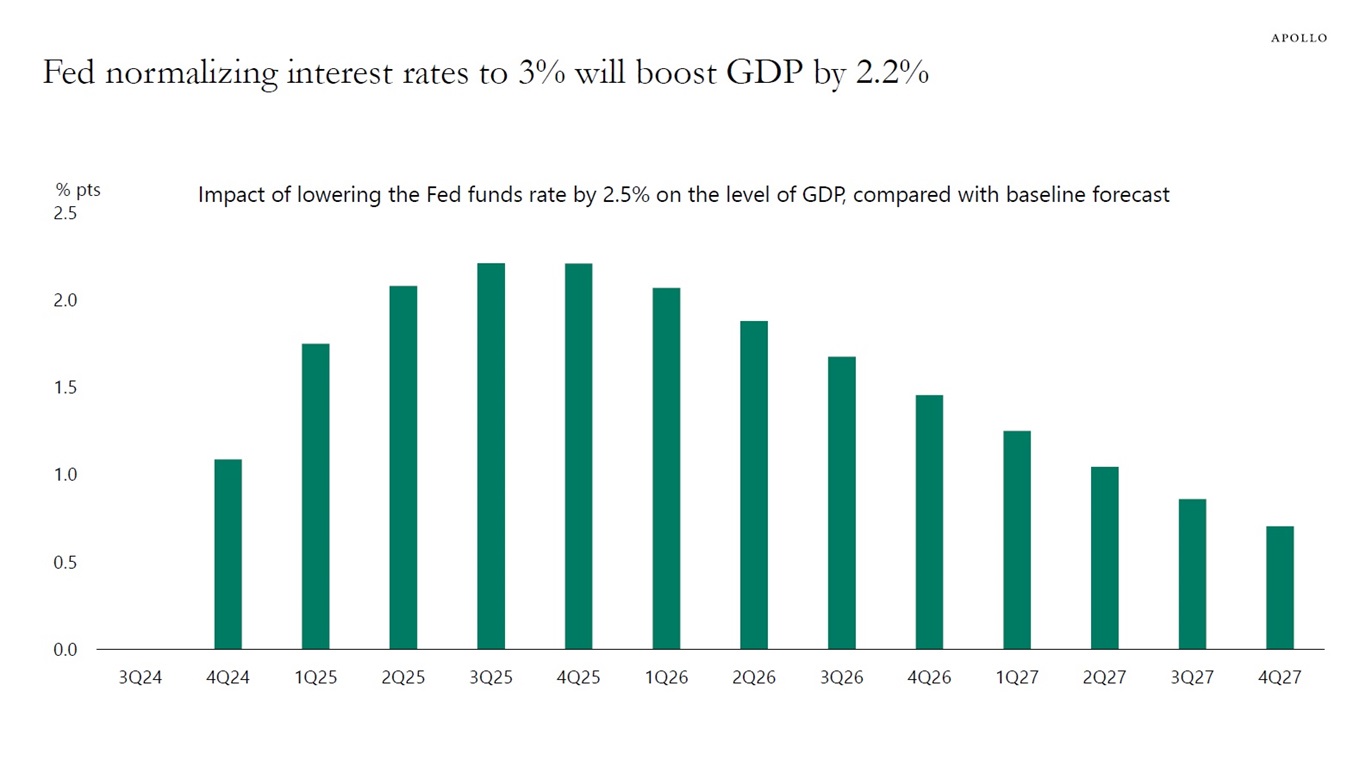
Note: Monetary policy shock: 100bps decline in the Fed funds rate and Fed forward guidance signaling that another 150bps of cuts are coming (to ultimately bring the Fed funds rate down to the Fed’s estimate of r-star at 3%). Source: Bloomberg SHOK Model, Apollo Chief Economist 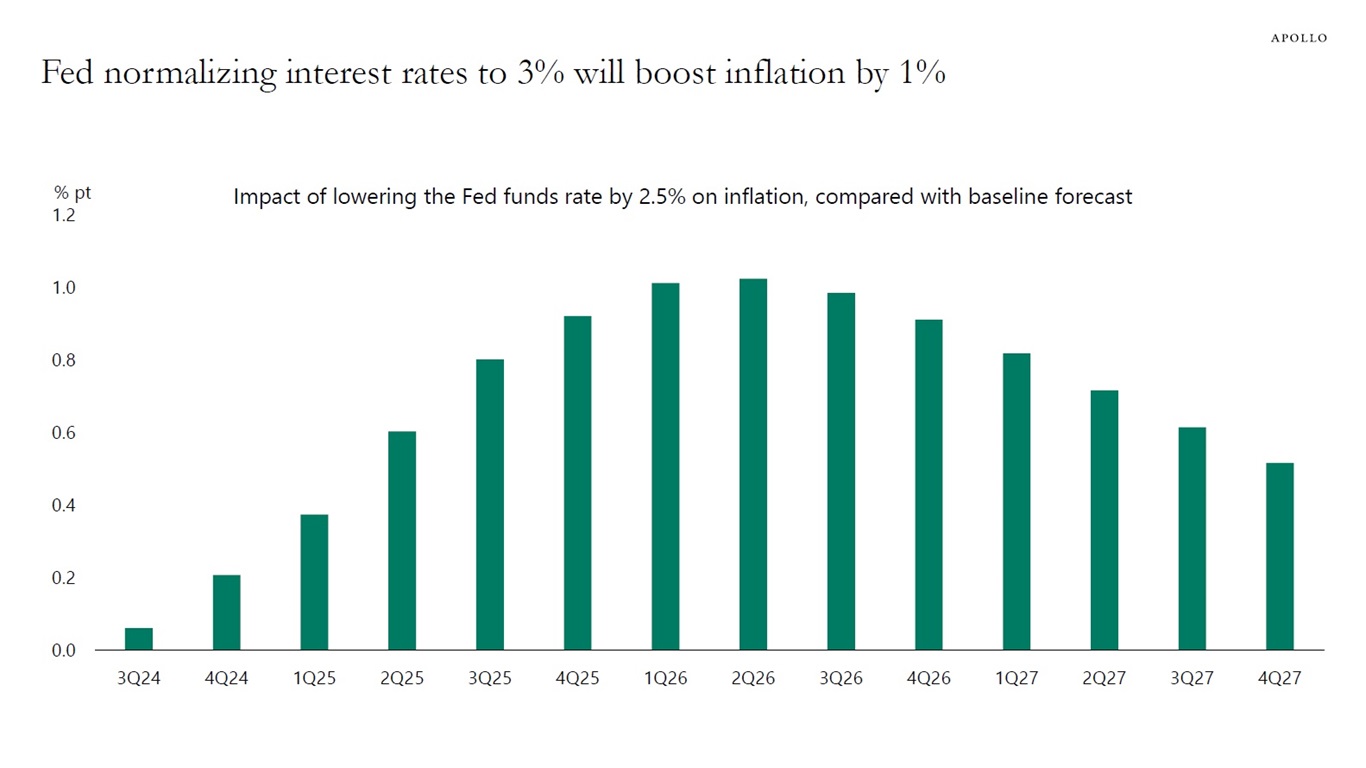
Note: Monetary policy shock: 100bps decline in the Fed funds rate and Fed forward guidance signaling that another 150bps of cuts are coming (to ultimately bring the Fed funds rate down to the Fed’s estimate of r-star at 3%). Source: Bloomberg SHOK Model, Apollo Chief Economist See important disclaimers at the bottom of the page.
-
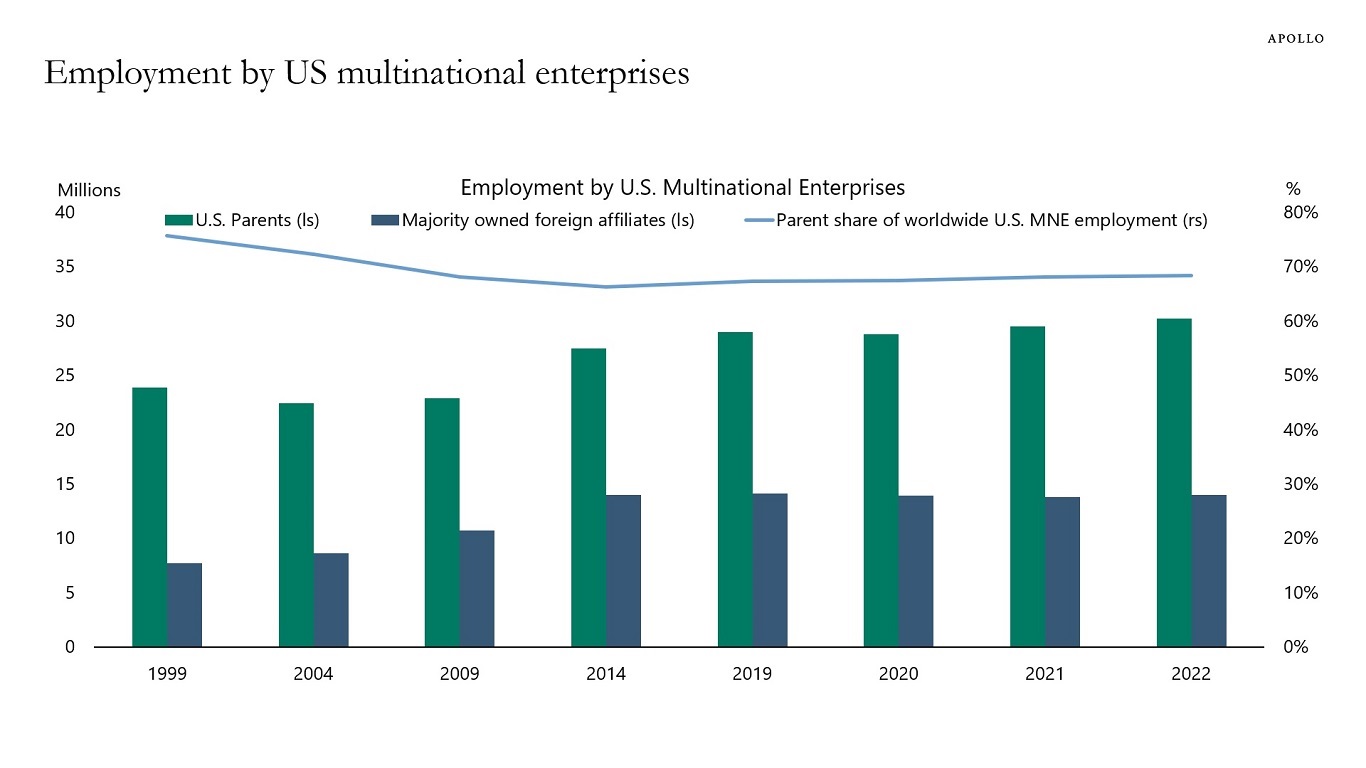
Worldwide employment in all US multinational companies is 44 million.
About 70% of employment in US multinational enterprises, or about 30 million jobs, are in the US, and 14 million jobs in US multinational firms are outside the US.
With total nonfarm payrolls in the US at 159 million, 19% of US employment is in multinational enterprises.
Put differently, more than 80% of jobs in the US economy are outside the S&P 500 companies, and privately owned companies continue to be the lifeblood of the US economy.
For more, see this new data from the BLS.
Source: US Bureau of Economic Analysis, Apollo Chief Economist See important disclaimers at the bottom of the page.
-
MSCI defines the free float as the proportion of shares outstanding that is deemed to be available for purchase in the public equity markets by international investors.
A higher free float normally means lower volatility and higher liquidity. The free float is higher in the US, UK, and Australia, and generally lower in emerging markets, see charts below.
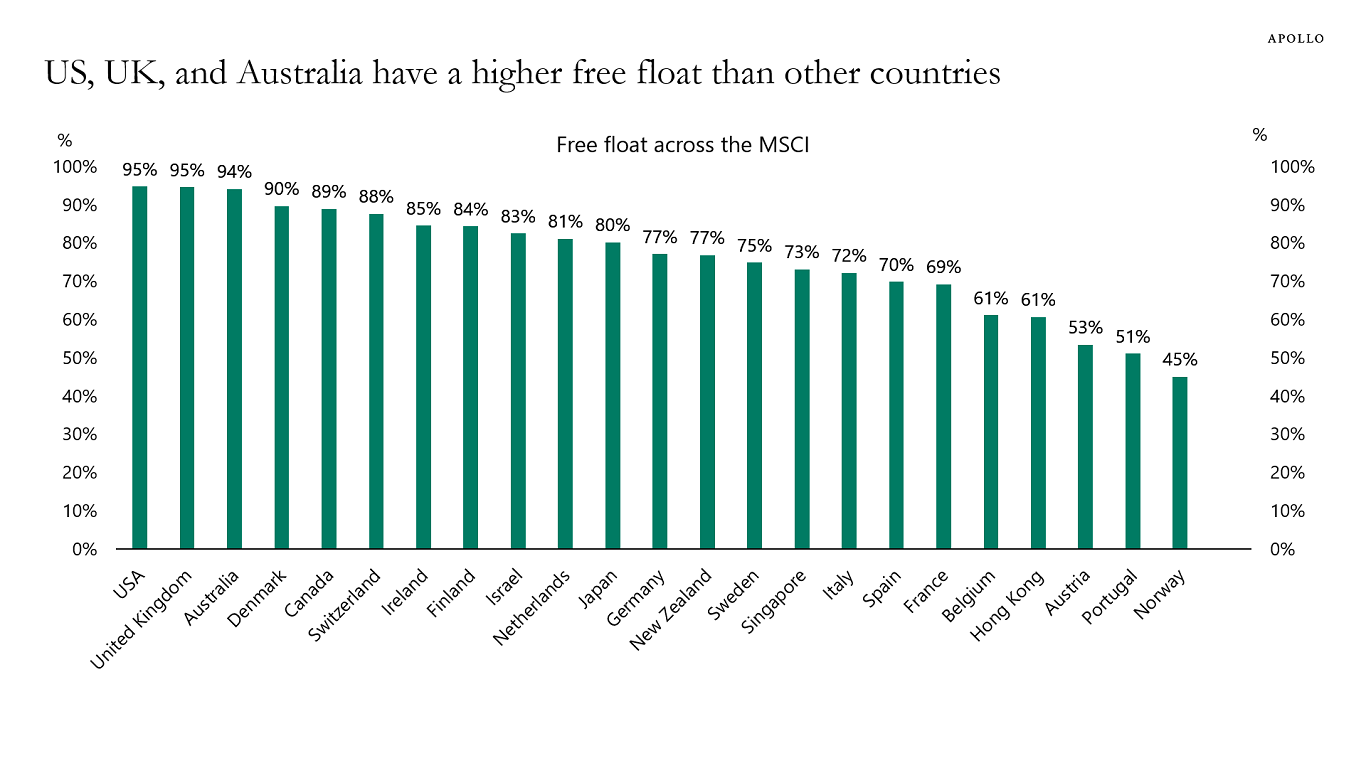
Note: MSCI defines the free float of a security as the proportion of shares outstanding that is deemed to be available for purchase in the public equity markets by international investors. Data as of July 2024. Source: Bloomberg, Apollo Chief Economist 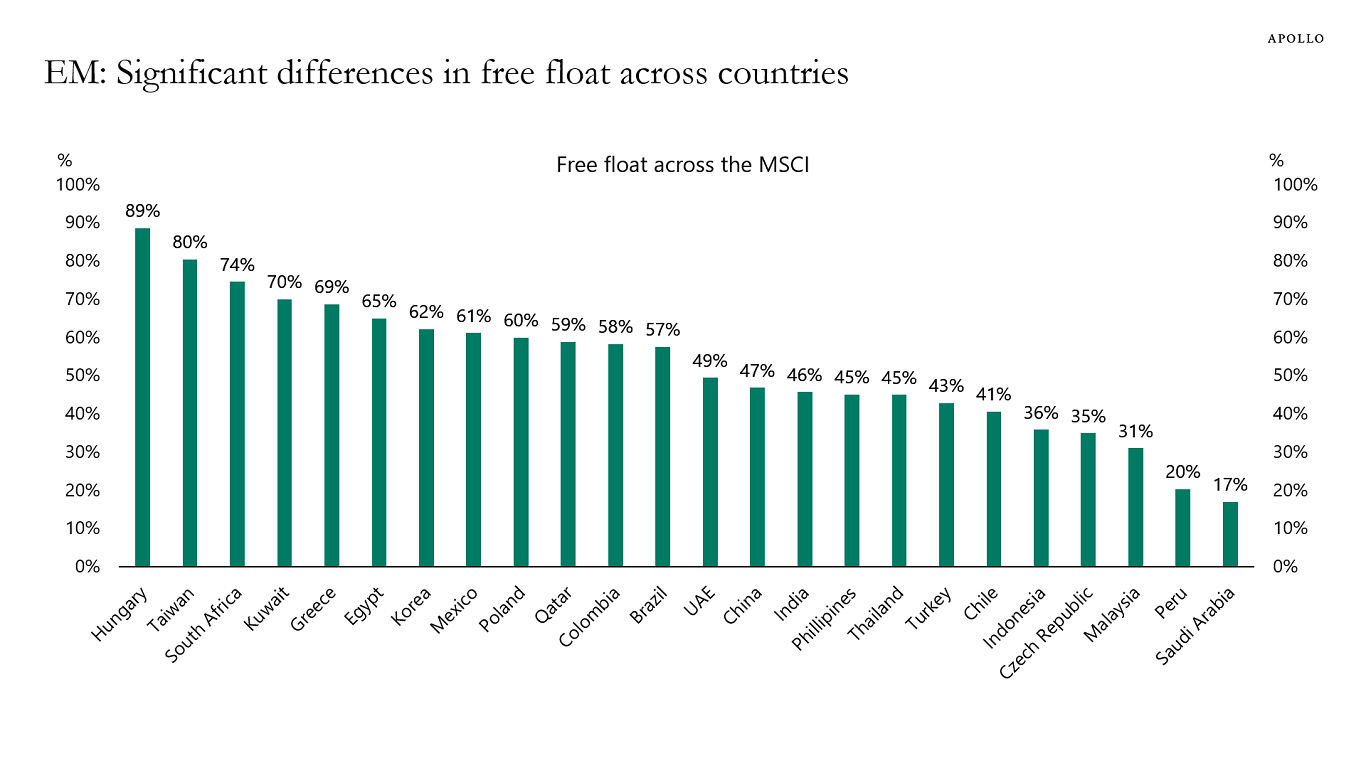
Note: MSCI defines the free float of a security as the proportion of shares outstanding that is deemed to be available for purchase in the public equity markets by international investors. Data as of July 2024. Source: Bloomberg, Apollo Chief Economist See important disclaimers at the bottom of the page.
-
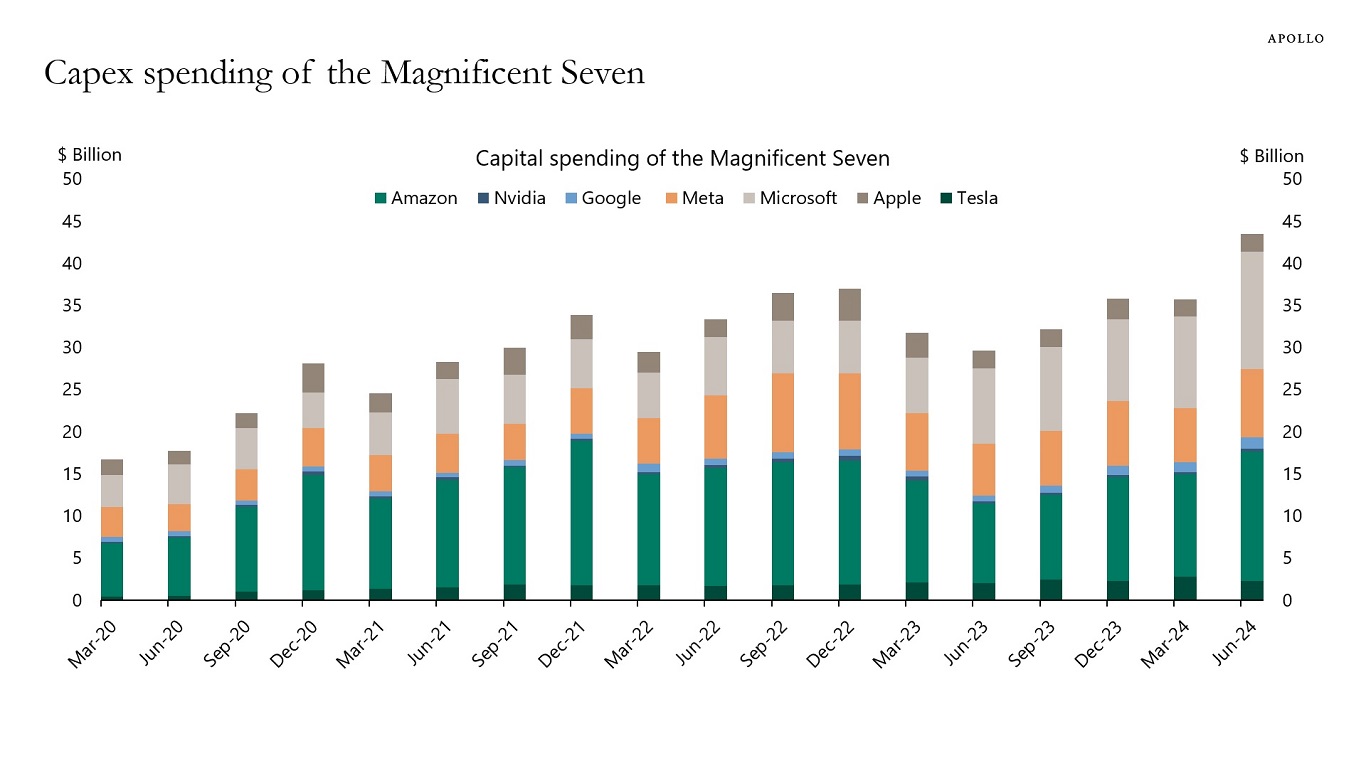
The economics textbook says that higher interest rates should slow capex spending.
But capex spending is currently much less sensitive to interest rates because of massive investments in AI.
Despite the Fed funds rate being at the highest level in decades, capex spending by the Magnificent Seven is at record-high levels, see chart below.
This is another reason why the monetary policy transmission mechanism is much weaker than usual. Fed hikes are having a much smaller negative impact than normal on business investment decisions because of the strong appetite among firms to invest in AI.
Source: Bloomberg, Apollo Chief Economist See important disclaimers at the bottom of the page.
-
Our chart book, available here, monitors a broad spectrum of indicators for signs of weakness in demand for US Treasuries. Fed cuts will begin to test the appetite for Treasuries among yield-sensitive buyers such as households, pension funds, and insurance companies.
Source: Apollo Chief Economist See important disclaimers at the bottom of the page.
-
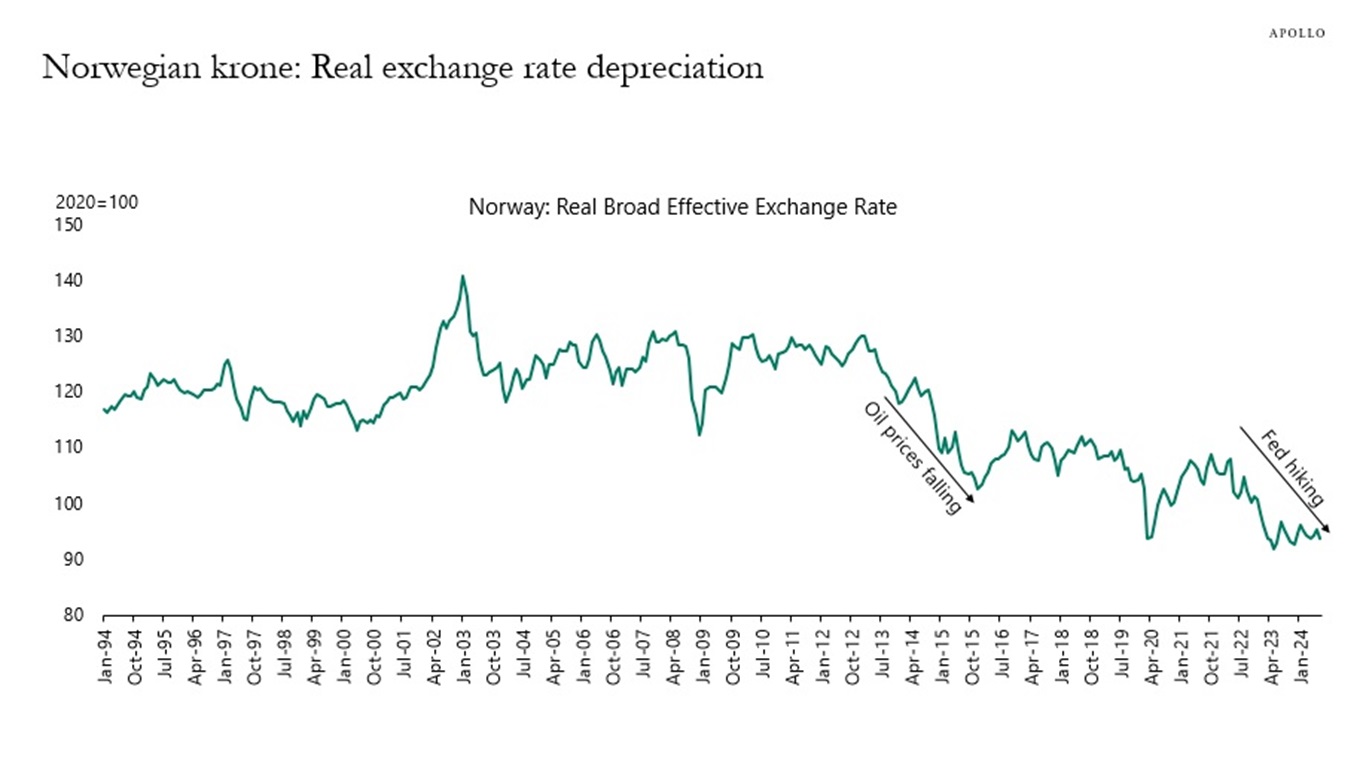
The depreciation of the Norwegian krone has been driven by the Fed raising interest rates faster than Norges Bank and by weak oil prices, see charts below and our chart book available here.
Source: Bloomberg, Apollo Chief Economist 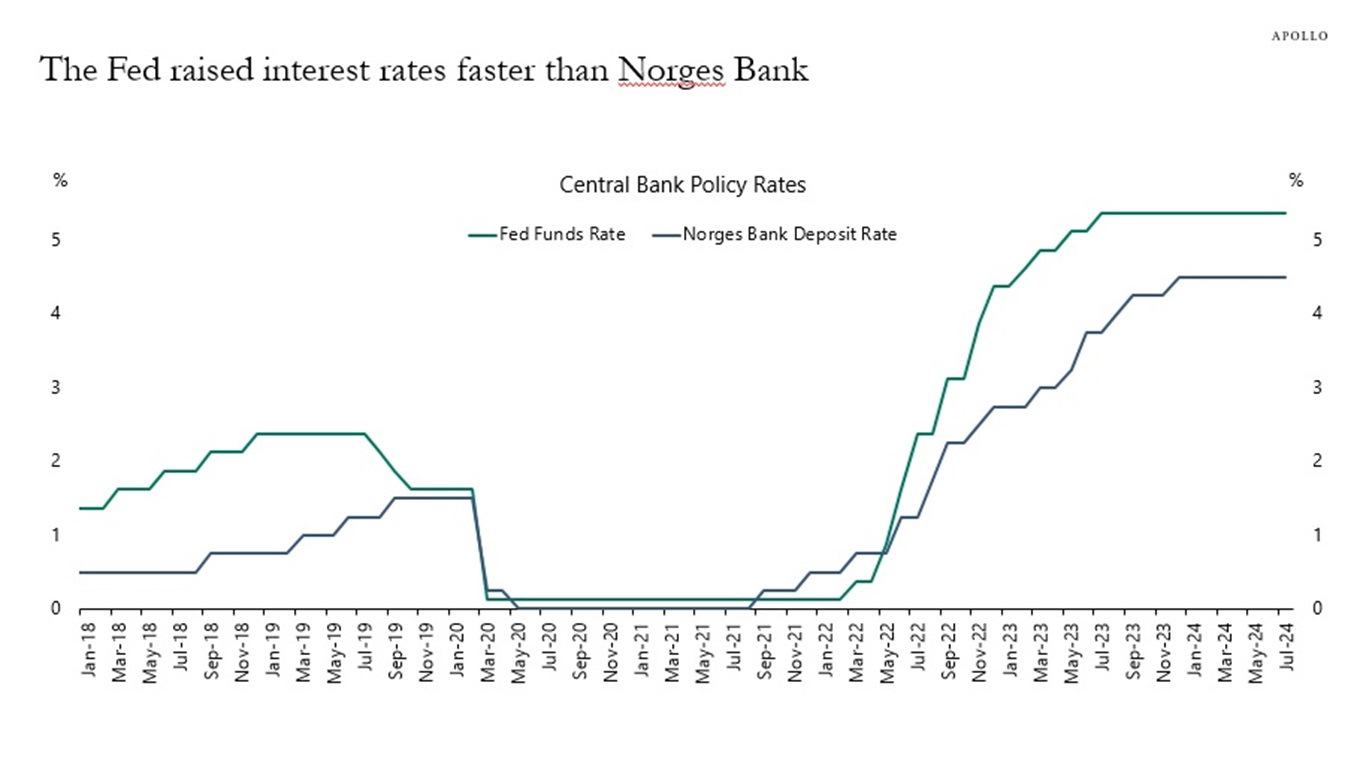
Source: Bloomberg, Apollo Chief Economist 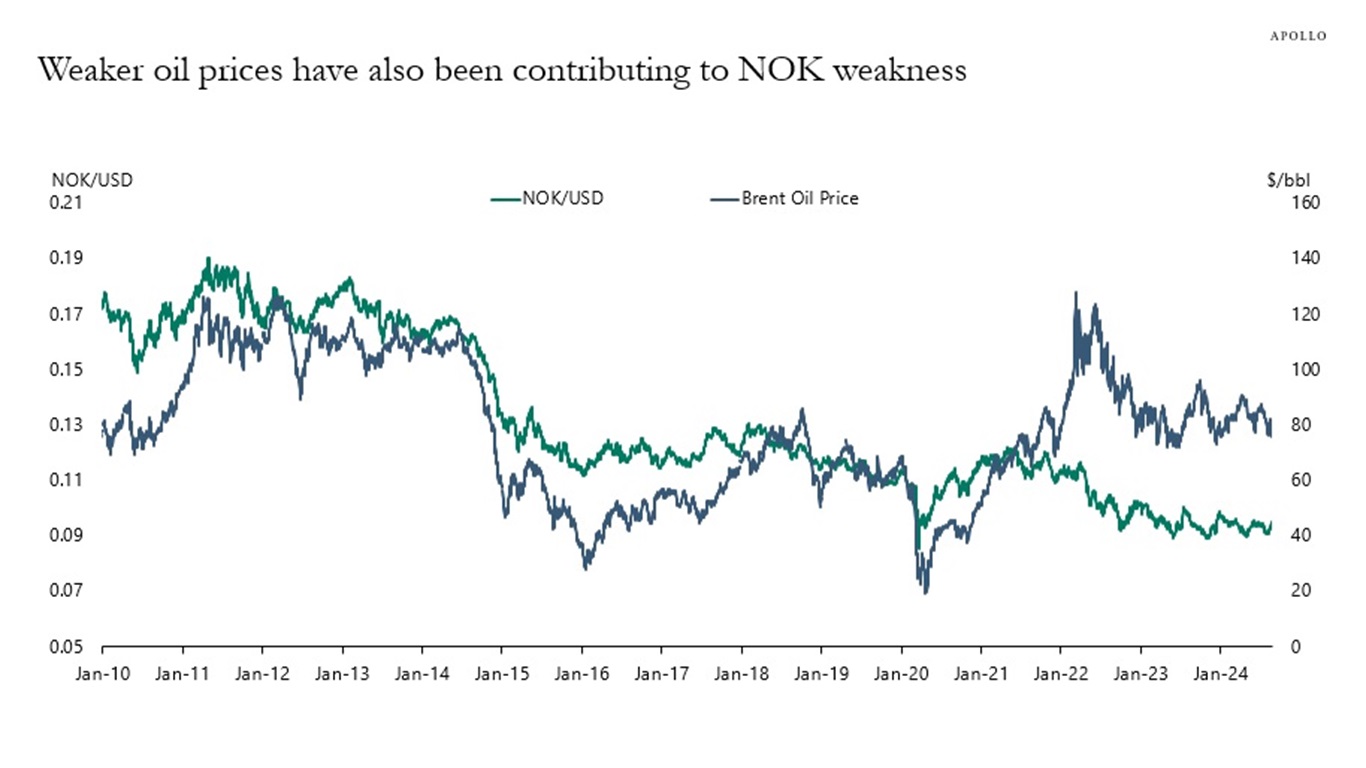
Source: Bloomberg, Apollo Chief Economist See important disclaimers at the bottom of the page.
-
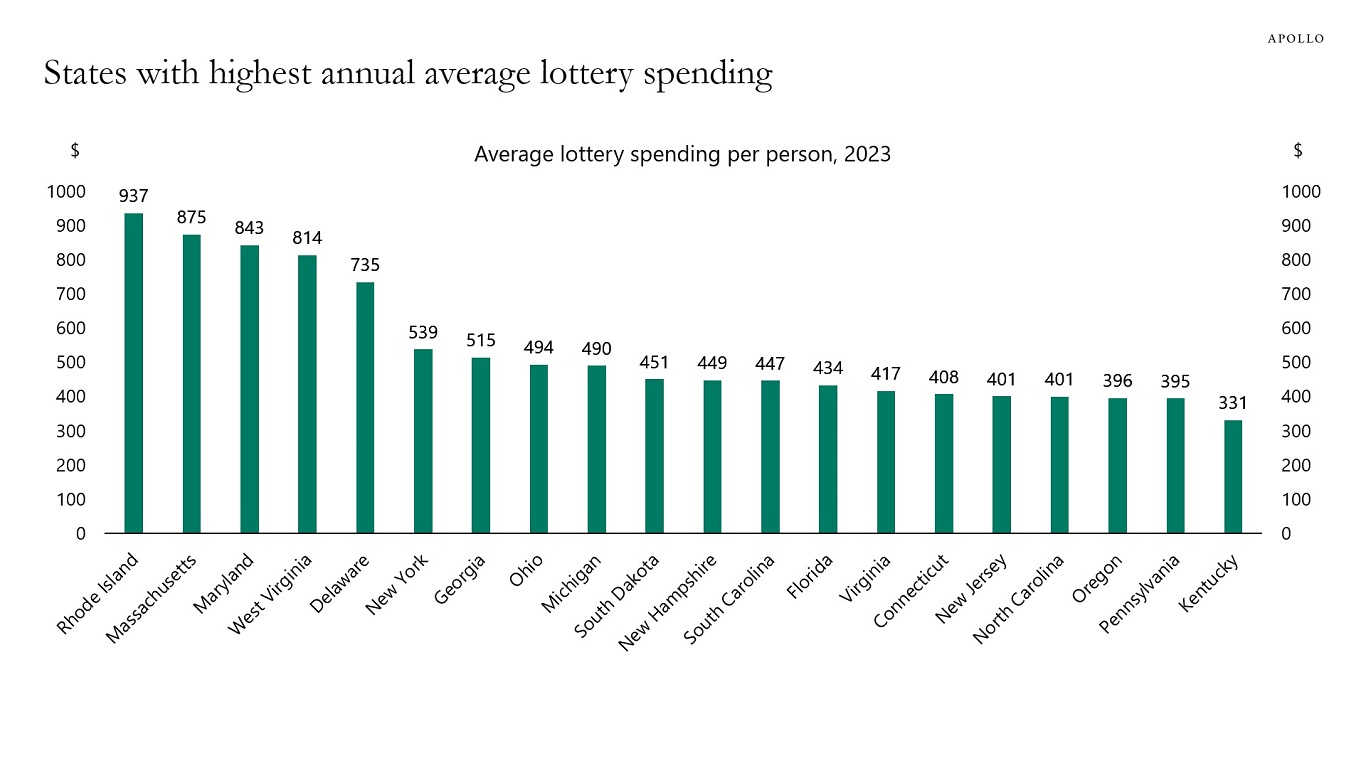
The five states with the highest average annual lottery spending per person are Rhode Island, Massachusetts, Maryland, West Virginia, and Delaware, see chart below.
Source: North American Association of State & Provincial Lotteries (NASPL), US Census Bureau, Apollo Chief Economist See important disclaimers at the bottom of the page.
-
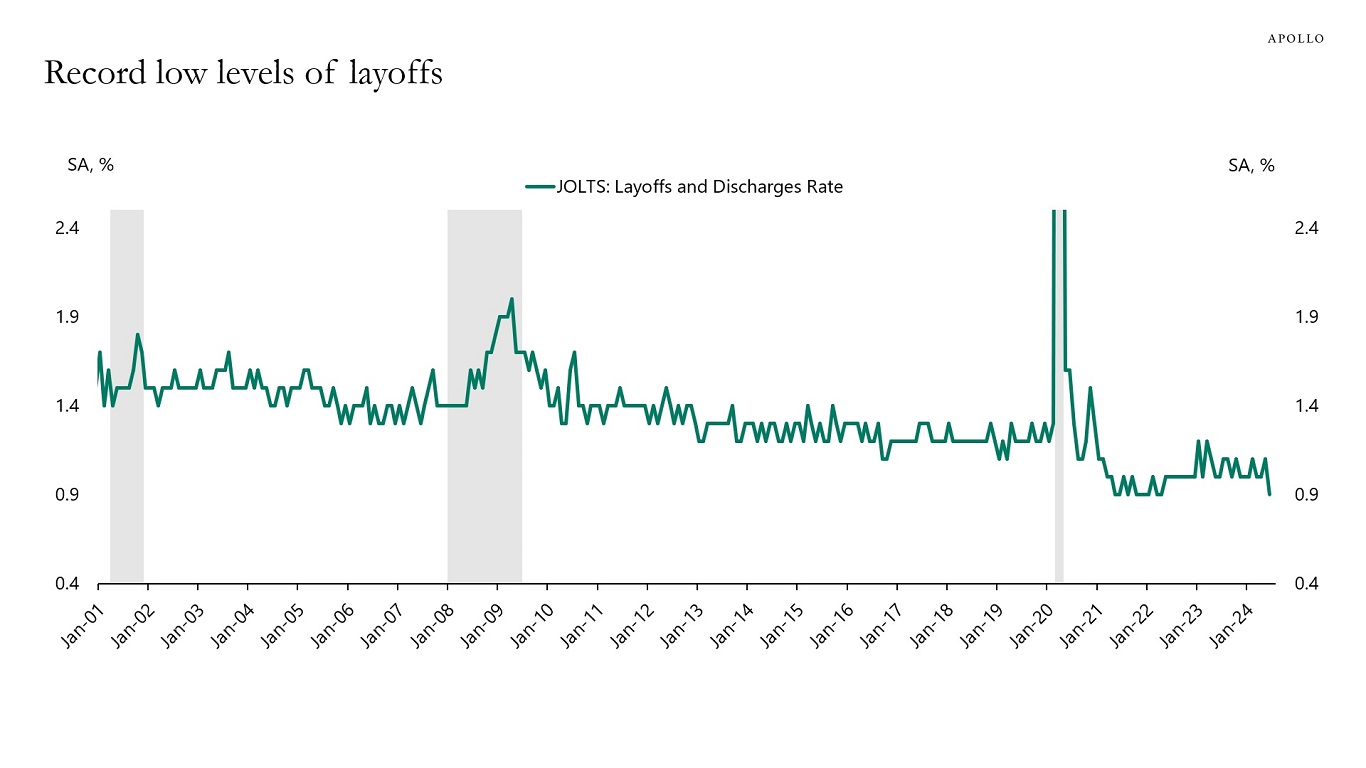
The JOLTS data shows that layoffs are currently at record-low levels, see the first chart.
The Challenger, Gray & Christmas survey of job cut announcements shows that job cuts are at record-low levels, see the second chart.
WARN notices are trending down, suggesting that initial jobless claims will decline over the coming months, see the third chart.
The bottom line is that the rise in the unemployment rate is not driven by people getting fired.
Put differently, we are not in a recession, and it is debatable if the labor market is softening.
In short, the economy is doing just fine, and that is good for consumer spending, capex spending, and corporate earnings. There is no need for the Fed to cut interest rates four times this year. In fact, cutting interest rates too aggressively runs the risk of triggering another run-up in inflation.
Our latest chart book with daily and weekly indicators for the US economy is available here.
Source: BLS, Haver Analytics, Apollo Chief Economist 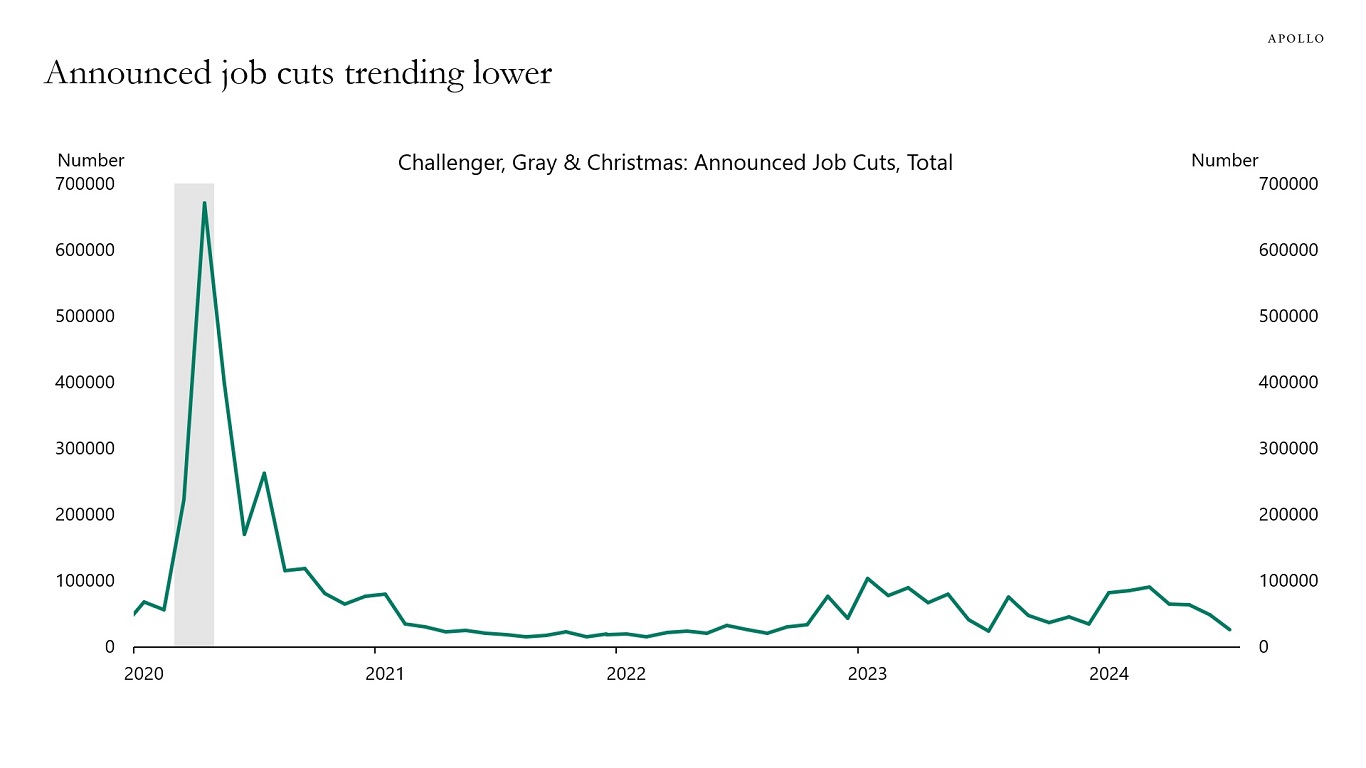
Source: Challenger, Gray & Christmas, Haver Analytics, Apollo Chief Economist 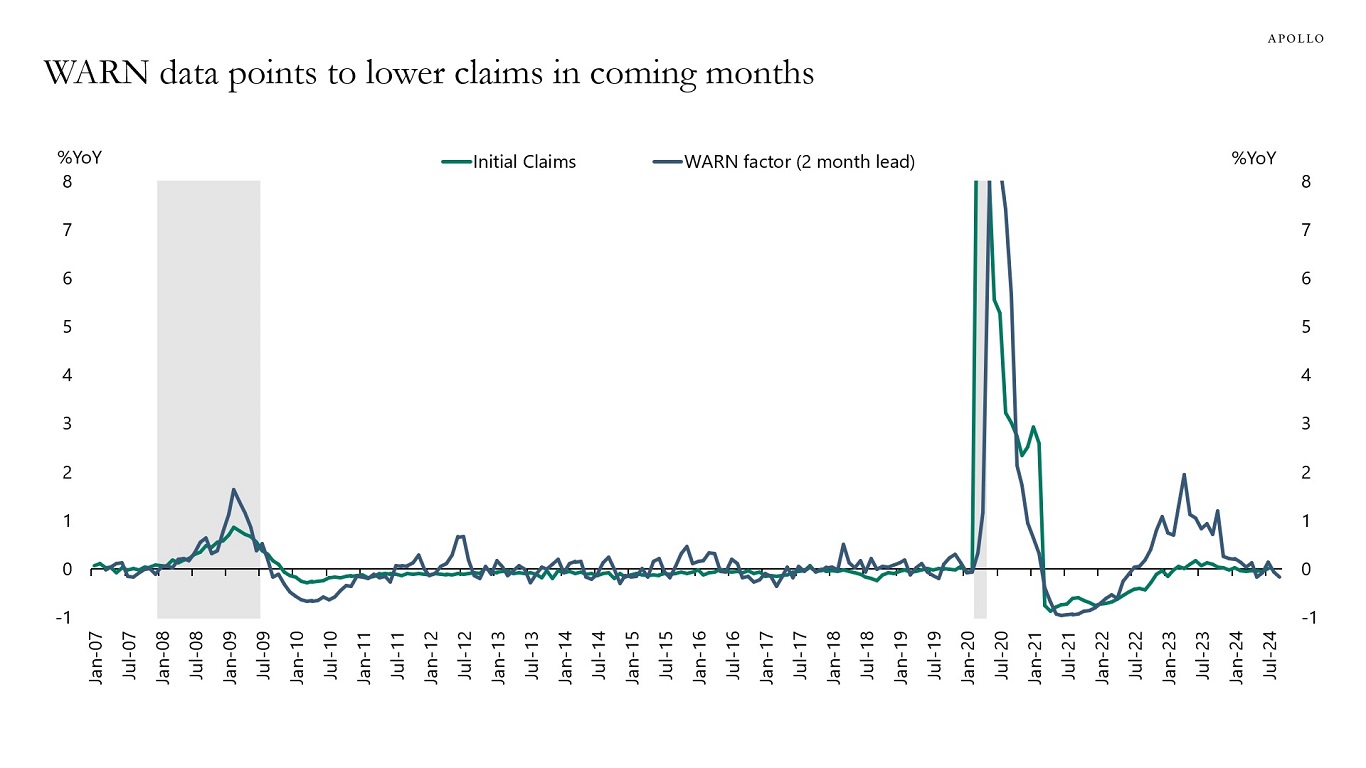
Note: The Worker Adjustment and Retraining Notification (WARN) Act helps ensure 60 to 90 days advance notice in cases of qualified plant closings and mass layoffs. WARN factor is the Cleveland Fed estimate for WARN notices (https://www.clevelandfed.org/publications/working-paper/wp-2003r-advance-layoff-notices-and-aggregate-job-loss). Source: Department of Labor, Haver Analytics, Federal Reserve Bank of Cleveland, Apollo Chief Economist See important disclaimers at the bottom of the page.

This presentation may not be distributed, transmitted or otherwise communicated to others in whole or in part without the express consent of Apollo Global Management, Inc. (together with its subsidiaries, “Apollo”).
Apollo makes no representation or warranty, expressed or implied, with respect to the accuracy, reasonableness, or completeness of any of the statements made during this presentation, including, but not limited to, statements obtained from third parties. Opinions, estimates and projections constitute the current judgment of the speaker as of the date indicated. They do not necessarily reflect the views and opinions of Apollo and are subject to change at any time without notice. Apollo does not have any responsibility to update this presentation to account for such changes. There can be no assurance that any trends discussed during this presentation will continue.
Statements made throughout this presentation are not intended to provide, and should not be relied upon for, accounting, legal or tax advice and do not constitute an investment recommendation or investment advice. Investors should make an independent investigation of the information discussed during this presentation, including consulting their tax, legal, accounting or other advisors about such information. Apollo does not act for you and is not responsible for providing you with the protections afforded to its clients. This presentation does not constitute an offer to sell, or the solicitation of an offer to buy, any security, product or service, including interest in any investment product or fund or account managed or advised by Apollo.
Certain statements made throughout this presentation may be “forward-looking” in nature. Due to various risks and uncertainties, actual events or results may differ materially from those reflected or contemplated in such forward-looking information. As such, undue reliance should not be placed on such statements. Forward-looking statements may be identified by the use of terminology including, but not limited to, “may”, “will”, “should”, “expect”, “anticipate”, “target”, “project”, “estimate”, “intend”, “continue” or “believe” or the negatives thereof or other variations thereon or comparable terminology.