


Want it delivered daily to your inbox?
-
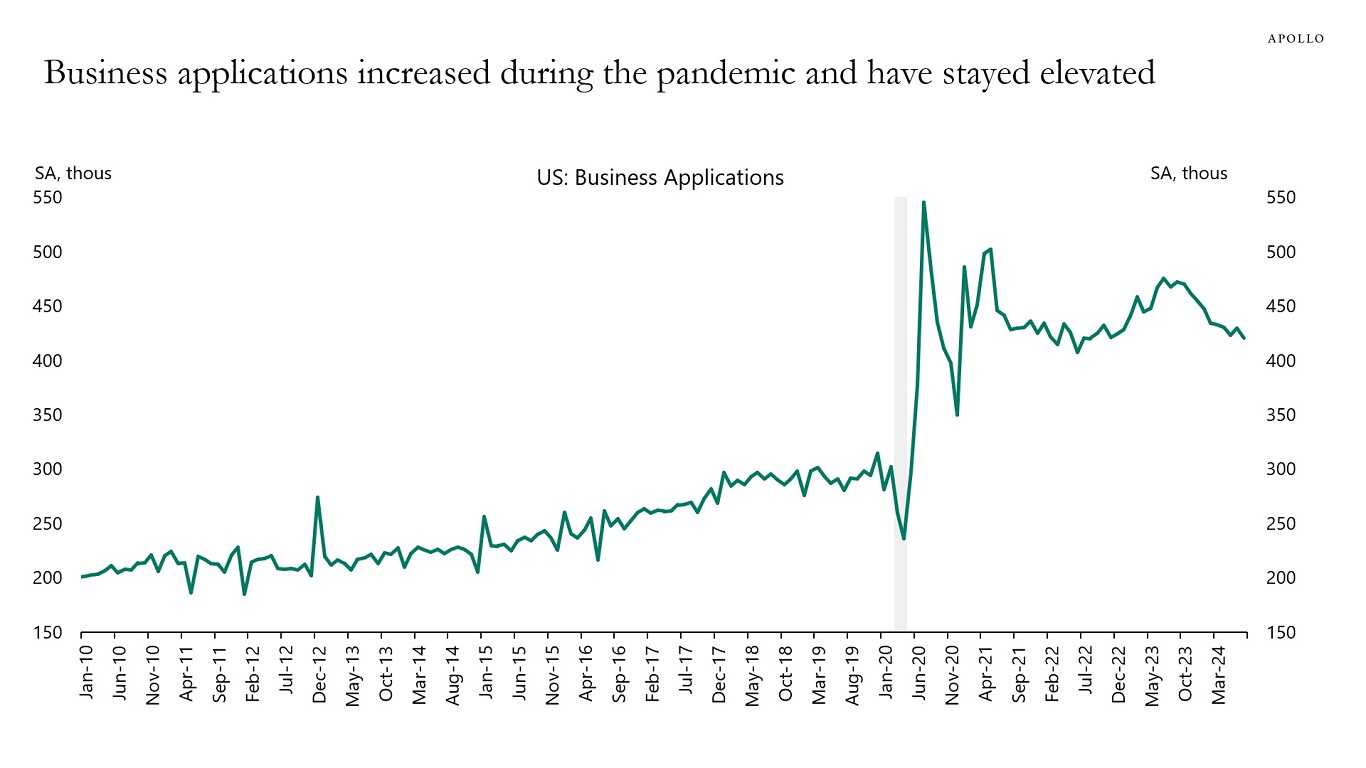
During the pandemic, many new businesses were created, see the first chart below. But the new businesses created were different. They were created by individuals rather than corporations, and they were smaller and less likely to hire a lot of people, see the second and third chart.
The bottom line is that business dynamics changed during Covid, with more one-person businesses opening since 2020. This is likely why the BLS overestimated employment in the birth/death model, which looks back five years and adjusts the total employment numbers for how many new businesses have opened and how many people work at these new businesses.
In other words, new businesses created are smaller and have fewer workers. The sector distribution seems to be fairly even and a lot of these businesses happen to be in Florida, see the fourth and fifth chart.
The implication for markets is that employment growth going forward will be lower because of an increase in the share of new businesses with fewer workers.
For more, see our chart book available here on these changing business dynamics.
Source: Census Bureau, Haver Analytics, Apollo Chief Economist 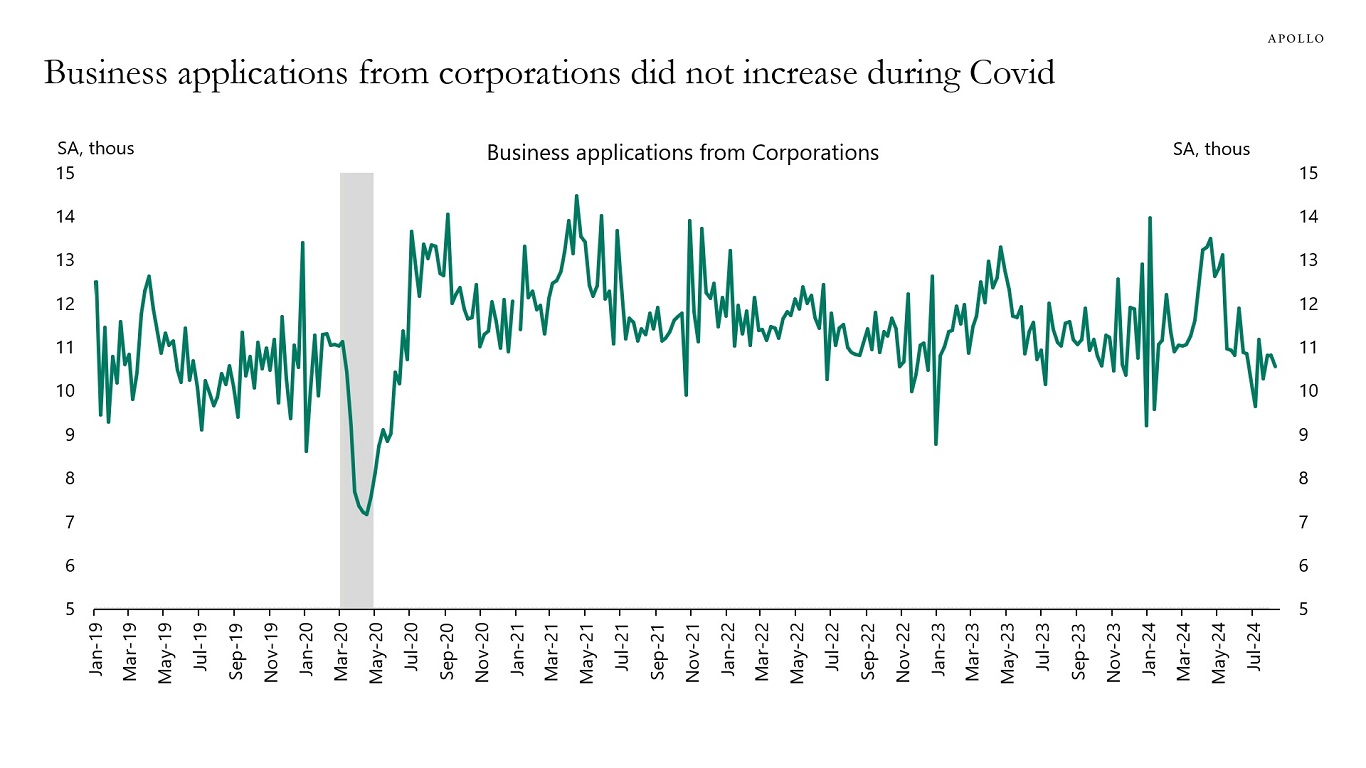
Source: Census Bureau, Haver Analytics, Apollo Chief Economist 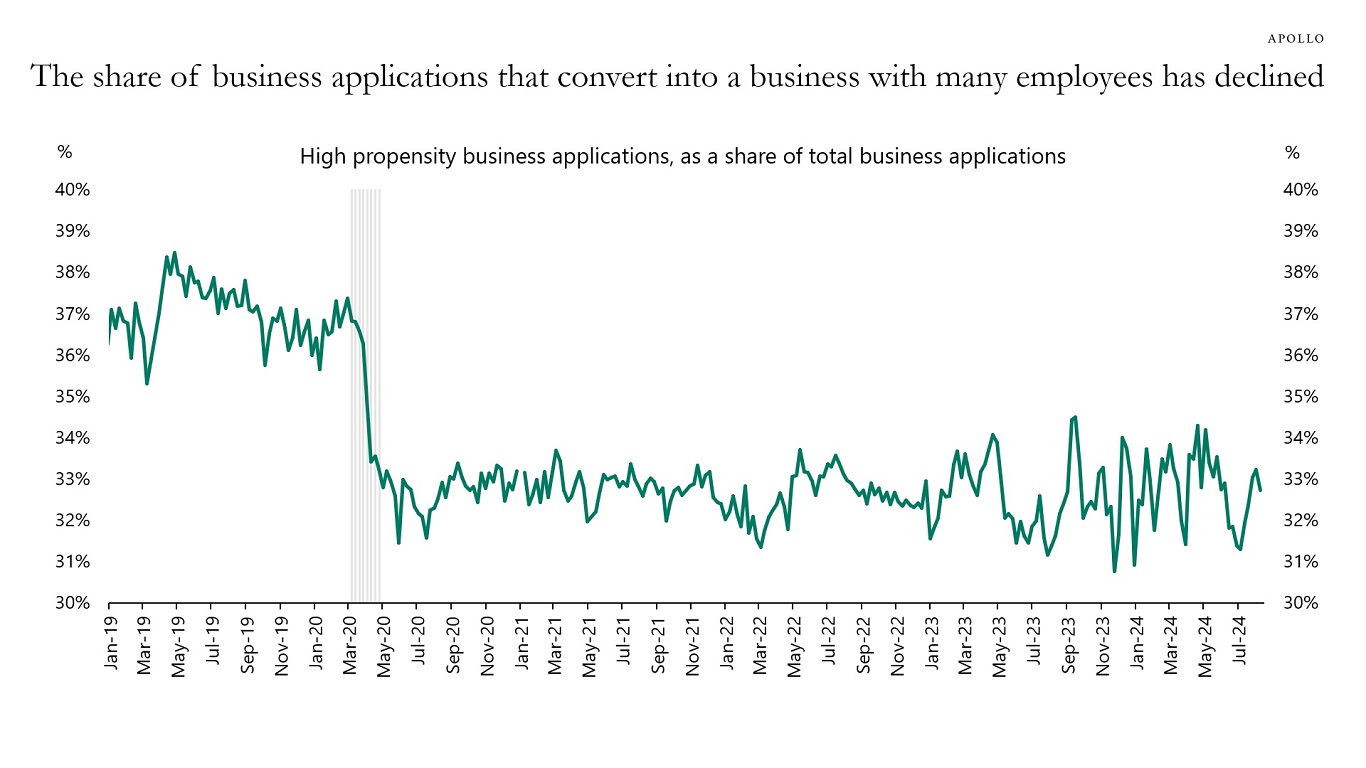
Note: High-propensity businesses are those that have a higher likelihood of becoming businesses with employees and payroll capabilities, and include those that: Define themselves as a corporate entity, indicate a plan to hire employees, have a date for providing first wages and planned wages, have been given a NAICS industry code that aligns with accommodation and food services, construction, manufacturing, retail, professional, scientific or technical services, educational services and healthcare.
Source: Census Bureau, Haver Analytics, Apollo Chief Economist
Source: Census Bureau, Haver Analytics, Apollo Chief Economist 
Source: Census Bureau, Apollo Chief Economist. Note: Data for 2022. See important disclaimers at the bottom of the page.
-
The share of Italian government bonds held by non-residents has increased over the past year, see chart below.
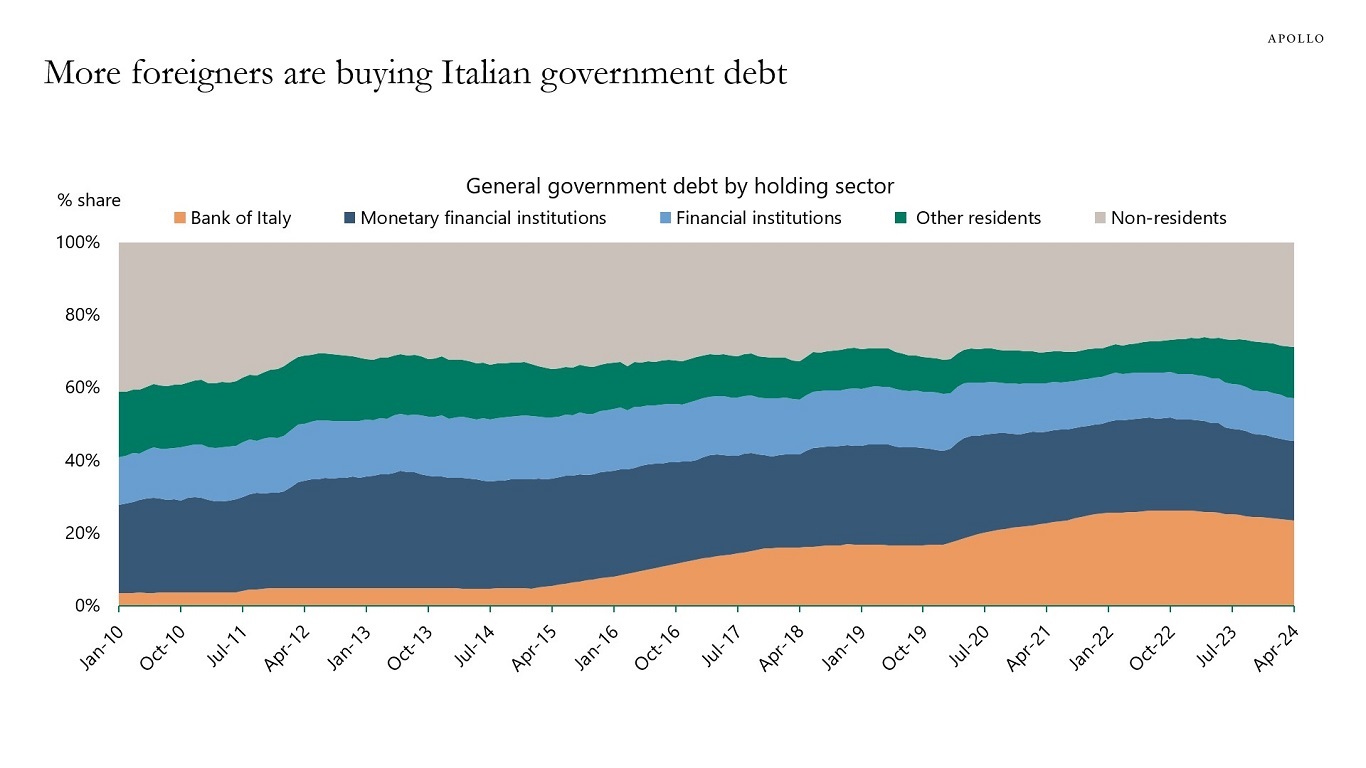
Source: Bank of Italy, Apollo Chief Economist. Note: Monetary Financial Institutions include banks, money market funds and ECB. See important disclaimers at the bottom of the page.
-
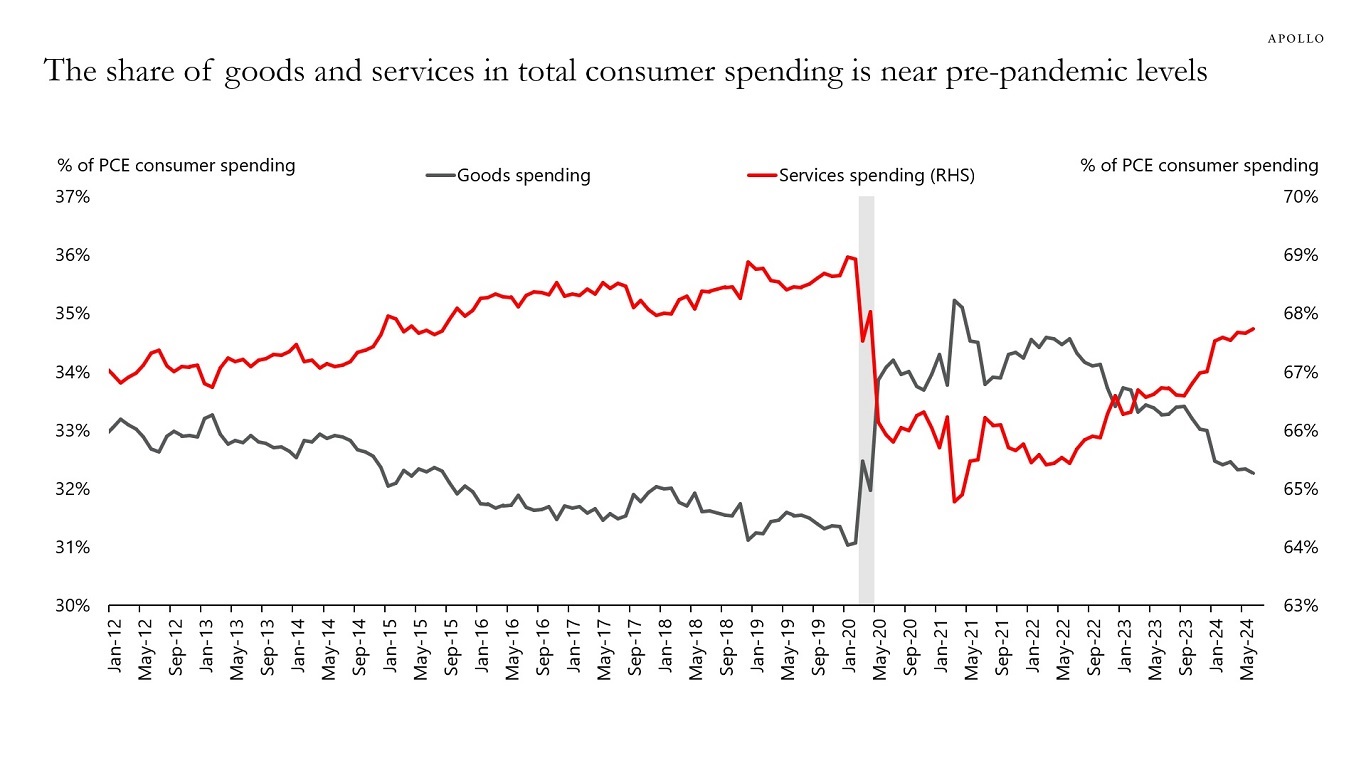
During the pandemic, households increased spending on goods because they were shopping online, and services spending was lowered because they couldn’t go to restaurants and travel.
The chart below shows that consumers have significantly increased spending on services over the past two years, and the current share at 68% is now close to pre-pandemic levels.
The bottom line is that we are getting to the end of the catch-up effect for companies in the consumer services industry.
Source: BEA, Haver Analytics, Apollo Chief Economist See important disclaimers at the bottom of the page.
-
Population growth in China has now turned negative. This is important because a growing labor force used to be a strong driver of growth in China. Combined with falling home prices and ongoing trade wars with Europe and the US, the headwinds to growth in China are intensifying. One implication for markets is continued downward pressure on commodity prices.
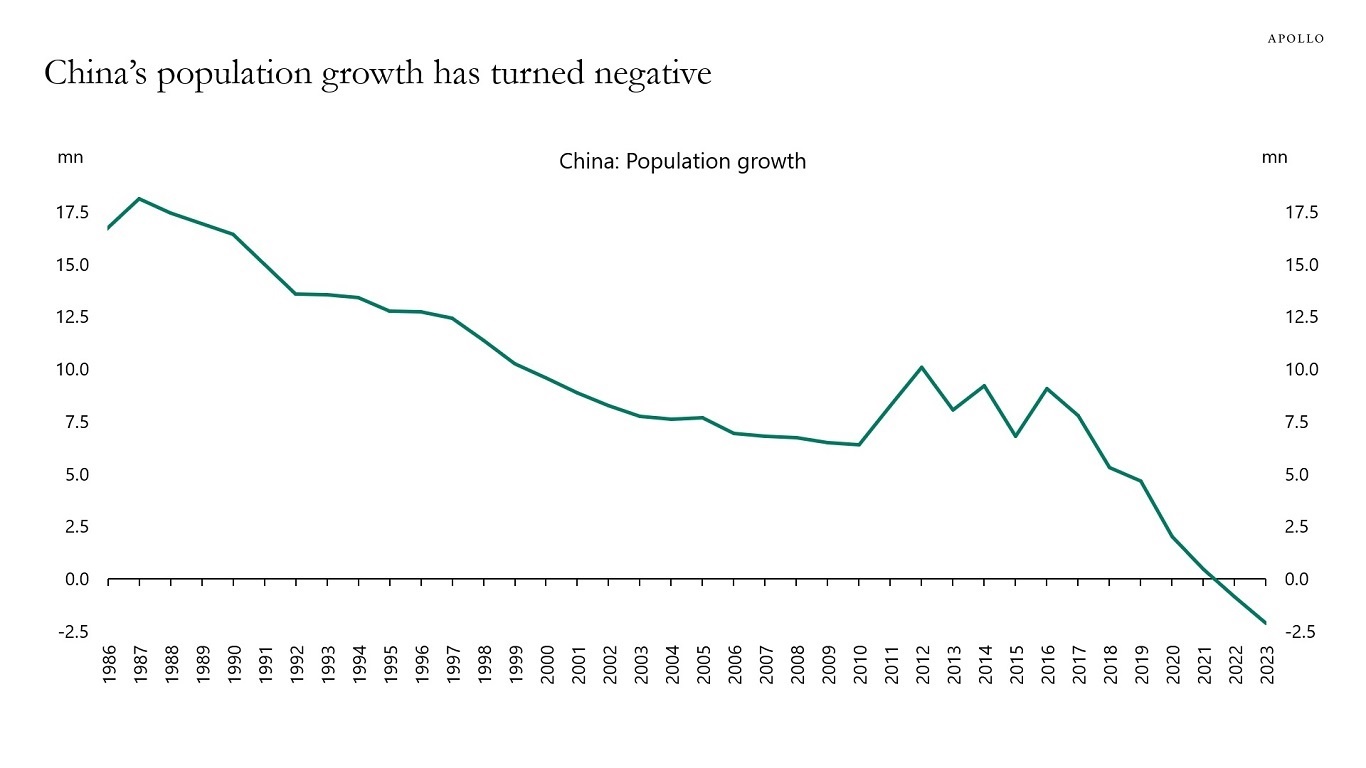
Source: CNBS, Haver Analytics, Apollo Chief Economist. Note: Natural population growth shown. Natural population growth = (birth rate – death rate) * total population. See important disclaimers at the bottom of the page.
-
Small business optimism is at the same level as when the Fed started raising interest rates in March 2022, see chart below. This is not a recession. If anything, this suggests the economy is reaccelerating.

Source: NFIB, Haver Analytics, Apollo Chief Economist See important disclaimers at the bottom of the page.
-
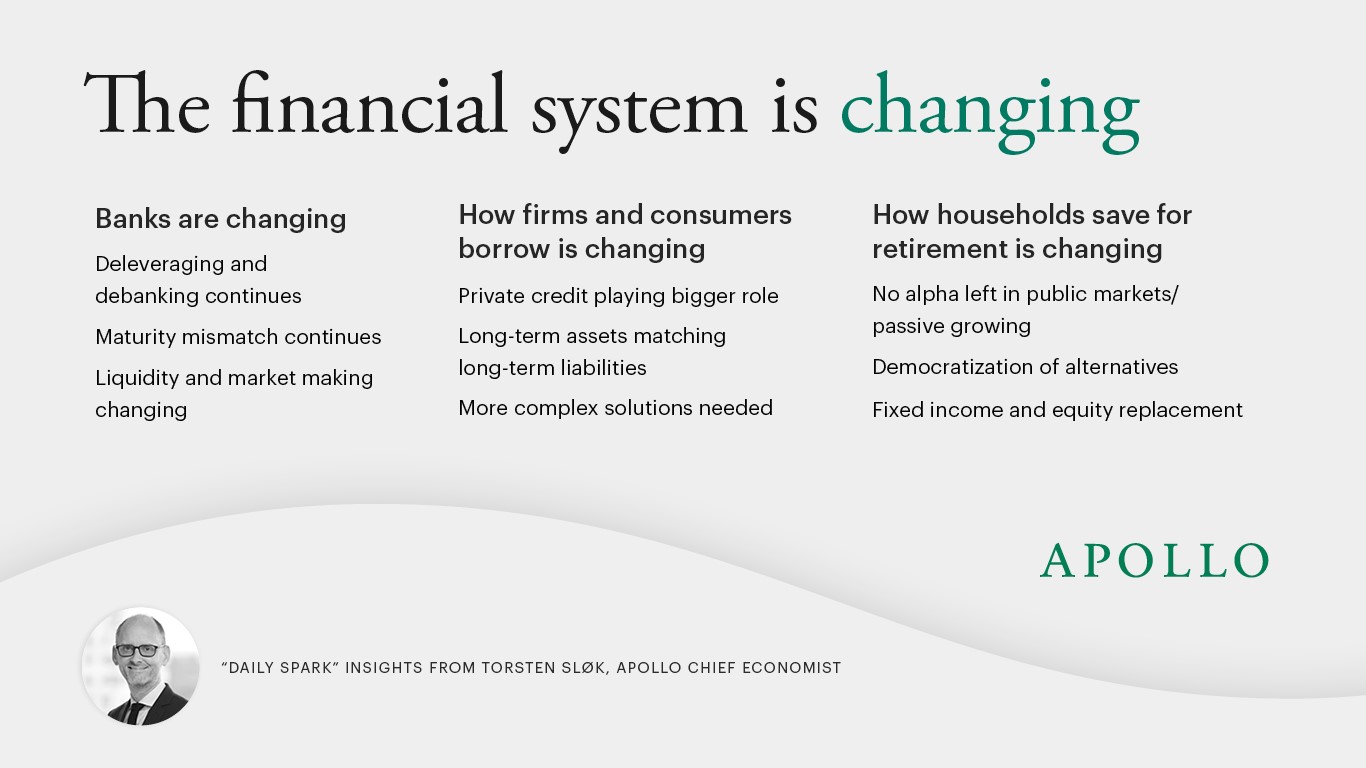
The financial system is changing.
First, banks are changing, and debanking continues, partly because of banks’ maturity mismatch when using deposits to finance long-term lending and partly because of ongoing changes to market liquidity and market making.
Second, how firms and consumers borrow is changing, with private credit playing a bigger role, and an increased realization that long-term assets such as investments in AI and energy should be matched with long-term liabilities.
Third, how households save for retirement is changing with passive investing growing, democratization of alternatives, and an increased recognition that parts of the 60/40 portfolio invested in highly liquid public markets can be replaced with private fixed income and private equity both for households and institutional investors.
See important disclaimers at the bottom of the page.
-
Looking at the latest daily and weekly data shows that retail sales are strong, jobless claims are falling, restaurant bookings are strong, air travel is strong, hotel occupancy rates are high, bank credit growth is accelerating, bankruptcy filings are trending lower, credit card spending is solid, and Broadway show attendance and box office grosses are strong. The Atlanta Fed’s GDP Now estimate for third quarter GDP is 2.4%, and the Dallas Fed weekly GDP indicator is 2.3%. Finally, we added a new chart with state-level GDP for New York, California, and Texas, which also shows continued strength, see below. The bottom line is that there are no signs of a recession in the incoming data, see also our chart book with daily and weekly data available here.

Source: Baumeister, Christiane, Danilo Leiva-Leon, and Eric Sims (2024), “Tracking Weekly State-Level Economic Conditions,” Review of Economics and Statistics, 106(2), 483-504., Apollo Chief Economist. Note: The economic conditions indices are computed with mixed-frequency dynamic factor models with weekly, monthly, and quarterly variables that cover multiple dimensions of state economies. The indices are scaled to 4-quarter growth rates of US real GDP and normalized such that a value of zero indicates national long-run growth. See important disclaimers at the bottom of the page.
-
The argument for buying distressed commercial real estate today is that interest rates are about to come down. But if interest rates come down because of a recession, then buying distressed CRE today is not a good idea. If the economy starts to slow down more meaningfully, as the consensus expects, the problems for rental housing, multifamily, and warehouses will get a lot worse.

Source: Moody’s, Apollo Chief Economist See important disclaimers at the bottom of the page.
-
Central banks are buying more gold, see charts below.
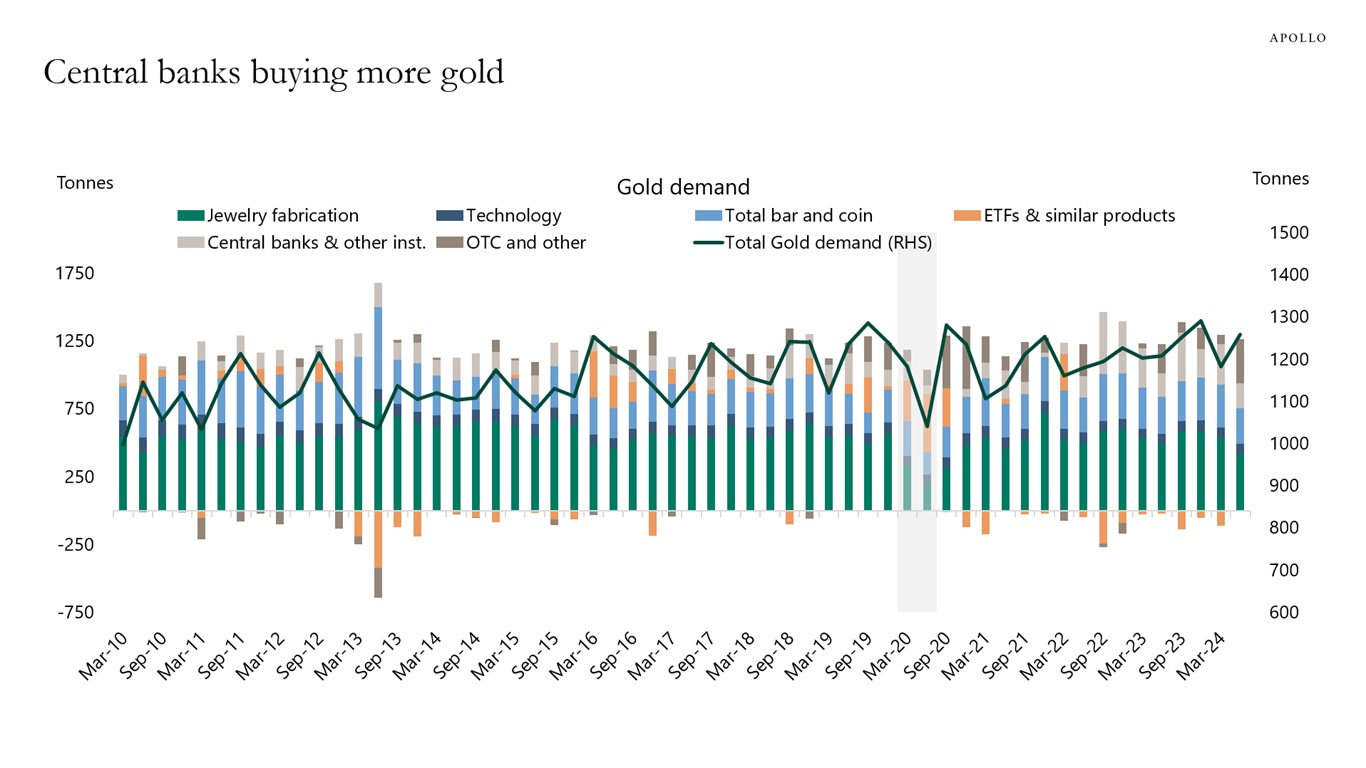
Source: World Gold Council, Apollo Chief Economist 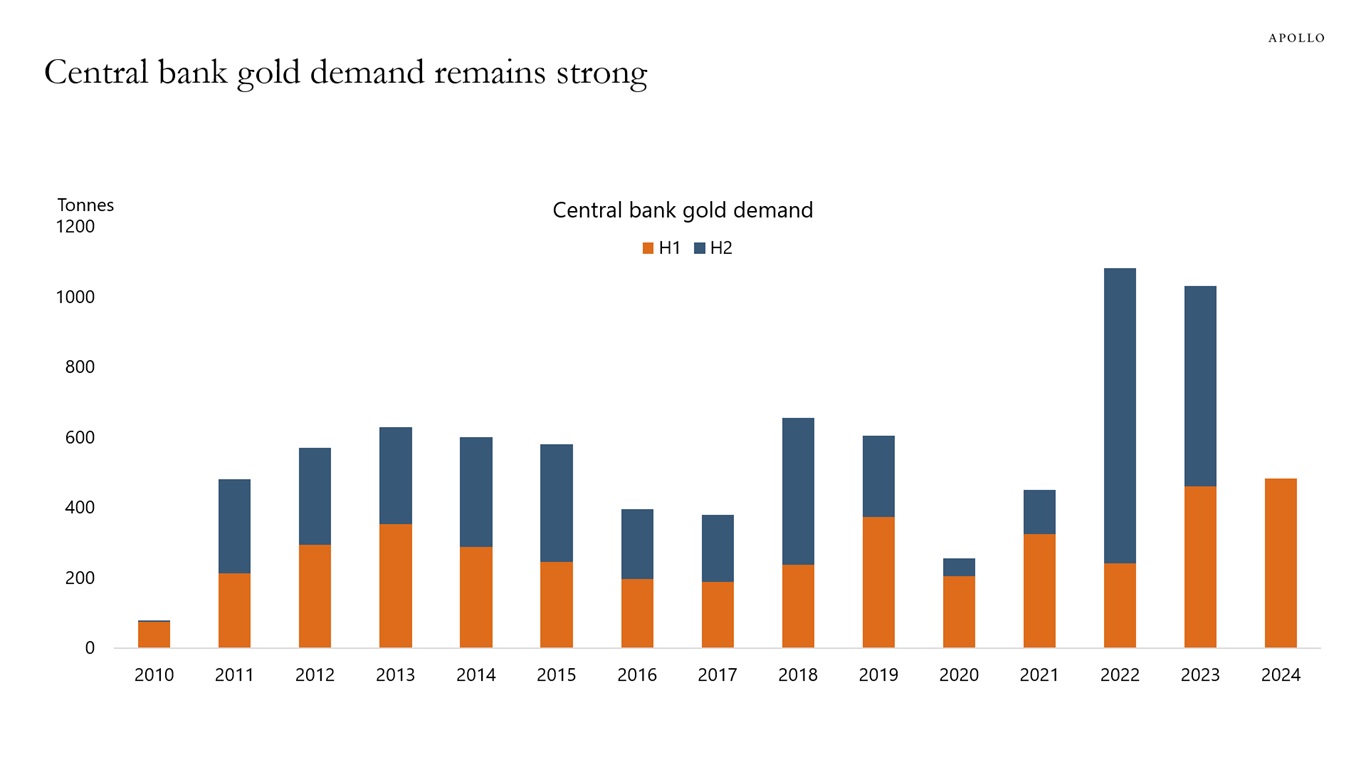
Source: World Gold Council, Apollo Chief Economist See important disclaimers at the bottom of the page.
-
US households are in much better shape than households in Canada and the UK, see the chart below.

Note: Household debt is defined as all liabilities of households (including non-profit institutions serving households) that require payments of interest or principal by households to the creditors at fixed dates in the future. Debt is calculated as the sum of the following liability categories: loans (primarily mortgage loans and consumer credit) and other accounts payable. The indicator is measured as a percentage of net household disposable income. Source: OECD, Apollo Chief Economist See important disclaimers at the bottom of the page.

This presentation may not be distributed, transmitted or otherwise communicated to others in whole or in part without the express consent of Apollo Global Management, Inc. (together with its subsidiaries, “Apollo”).
Apollo makes no representation or warranty, expressed or implied, with respect to the accuracy, reasonableness, or completeness of any of the statements made during this presentation, including, but not limited to, statements obtained from third parties. Opinions, estimates and projections constitute the current judgment of the speaker as of the date indicated. They do not necessarily reflect the views and opinions of Apollo and are subject to change at any time without notice. Apollo does not have any responsibility to update this presentation to account for such changes. There can be no assurance that any trends discussed during this presentation will continue.
Statements made throughout this presentation are not intended to provide, and should not be relied upon for, accounting, legal or tax advice and do not constitute an investment recommendation or investment advice. Investors should make an independent investigation of the information discussed during this presentation, including consulting their tax, legal, accounting or other advisors about such information. Apollo does not act for you and is not responsible for providing you with the protections afforded to its clients. This presentation does not constitute an offer to sell, or the solicitation of an offer to buy, any security, product or service, including interest in any investment product or fund or account managed or advised by Apollo.
Certain statements made throughout this presentation may be “forward-looking” in nature. Due to various risks and uncertainties, actual events or results may differ materially from those reflected or contemplated in such forward-looking information. As such, undue reliance should not be placed on such statements. Forward-looking statements may be identified by the use of terminology including, but not limited to, “may”, “will”, “should”, “expect”, “anticipate”, “target”, “project”, “estimate”, “intend”, “continue” or “believe” or the negatives thereof or other variations thereon or comparable terminology.