


Want it delivered daily to your inbox?
-
The soft employment report for July is in sharp contrast to the steady decline in default rates seen in recent months, see chart below.
If the economy were crashing, default rates would be spiking higher, and that is not what the data shows.
Also, join us today for a live discussion hosted by yours truly on what the current market volatility might mean for the Fed, the economy, and the markets. We start at 8:00 am EDT. Register now.
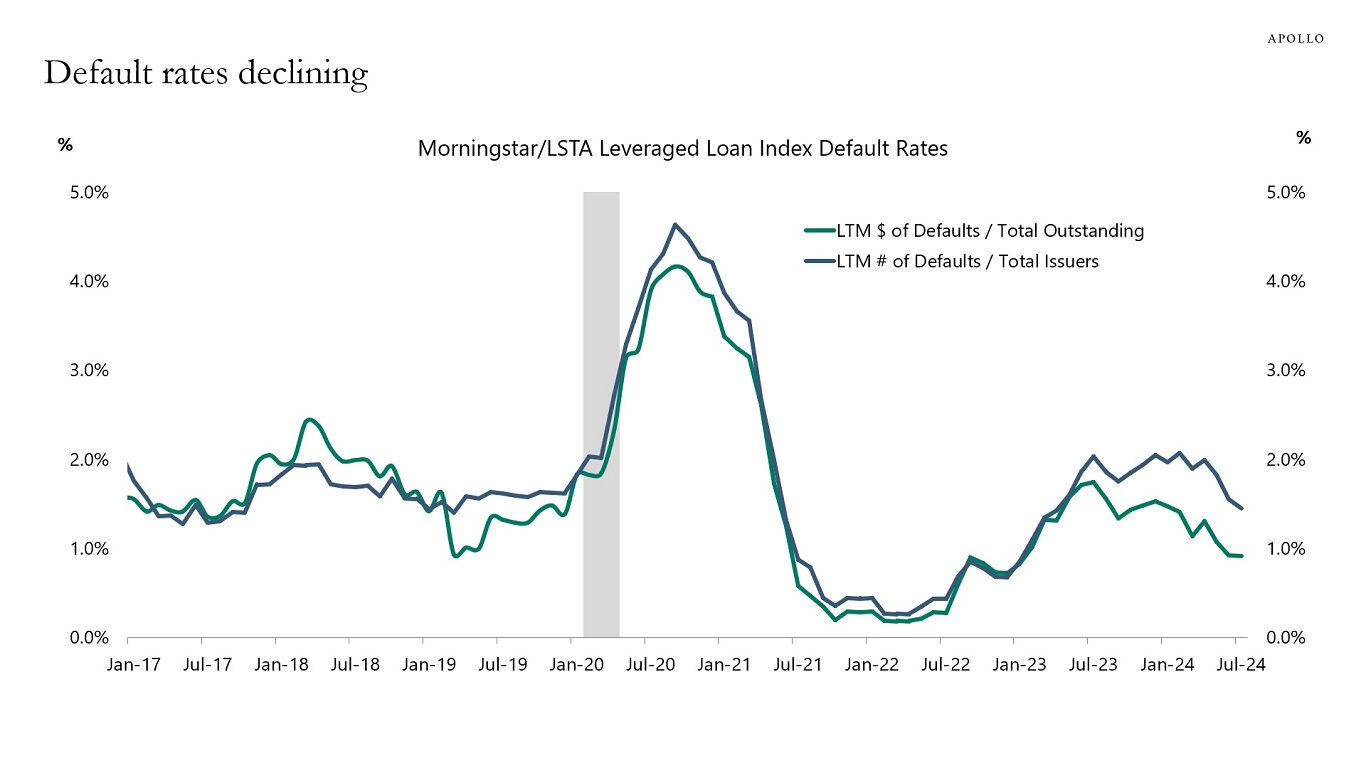
Source: PitchBook LCD, Apollo Chief Economist See important disclaimers at the bottom of the page.
-
The CHIPS Act, the Inflation Reduction Act, and the Infrastructure Act have triggered a new industrial renaissance in AI and energy. Also, US manufacturing capacity is now growing after having declined for many decades, see chart below.
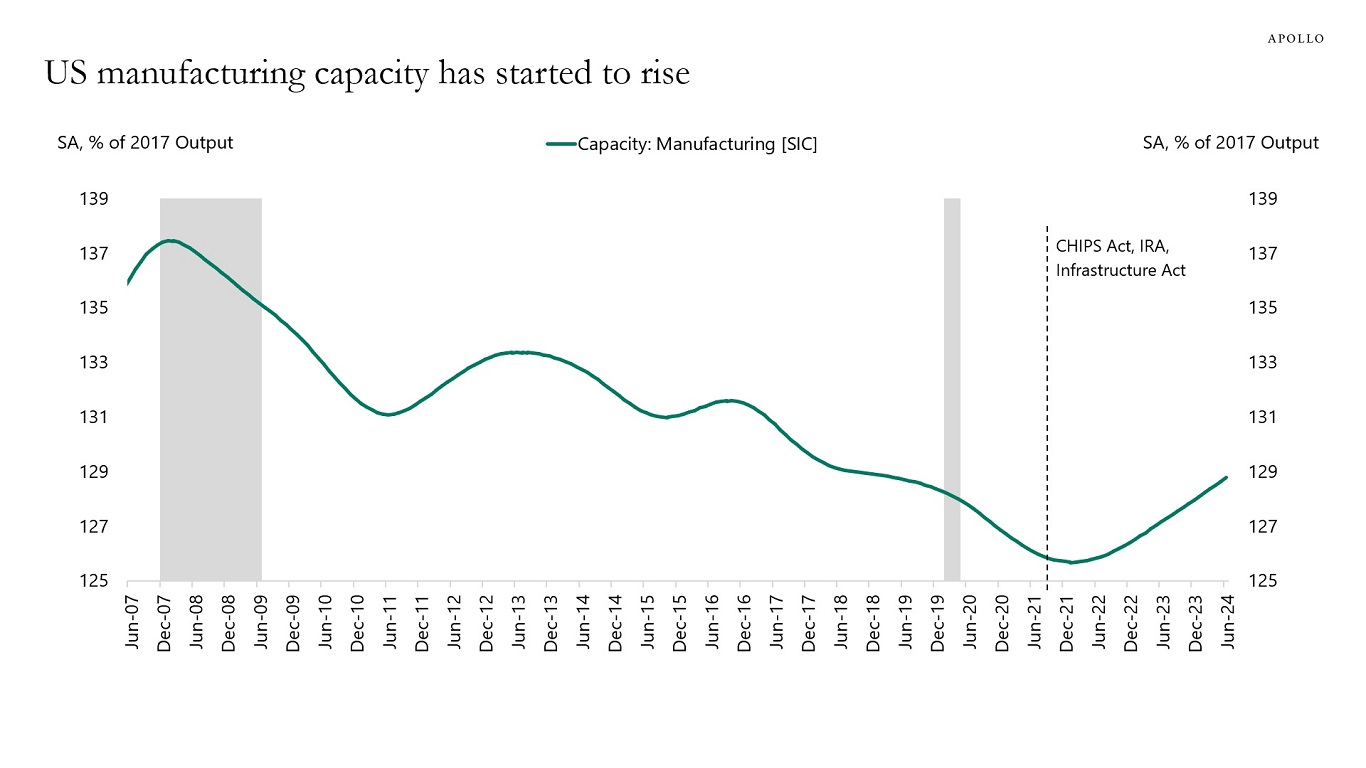
Note: SIC = Standard Industrial Classification. Source: Federal Reserve Board, National Bureau of Economic Research, Haver Analytics, Apollo Chief Economist See important disclaimers at the bottom of the page.
-
Research by David Autor from MIT shows that 60% of today’s workers are employed in occupations that didn’t exist in 1940, see chart below.
This is important when discussing what impact AI may have on the labor market.
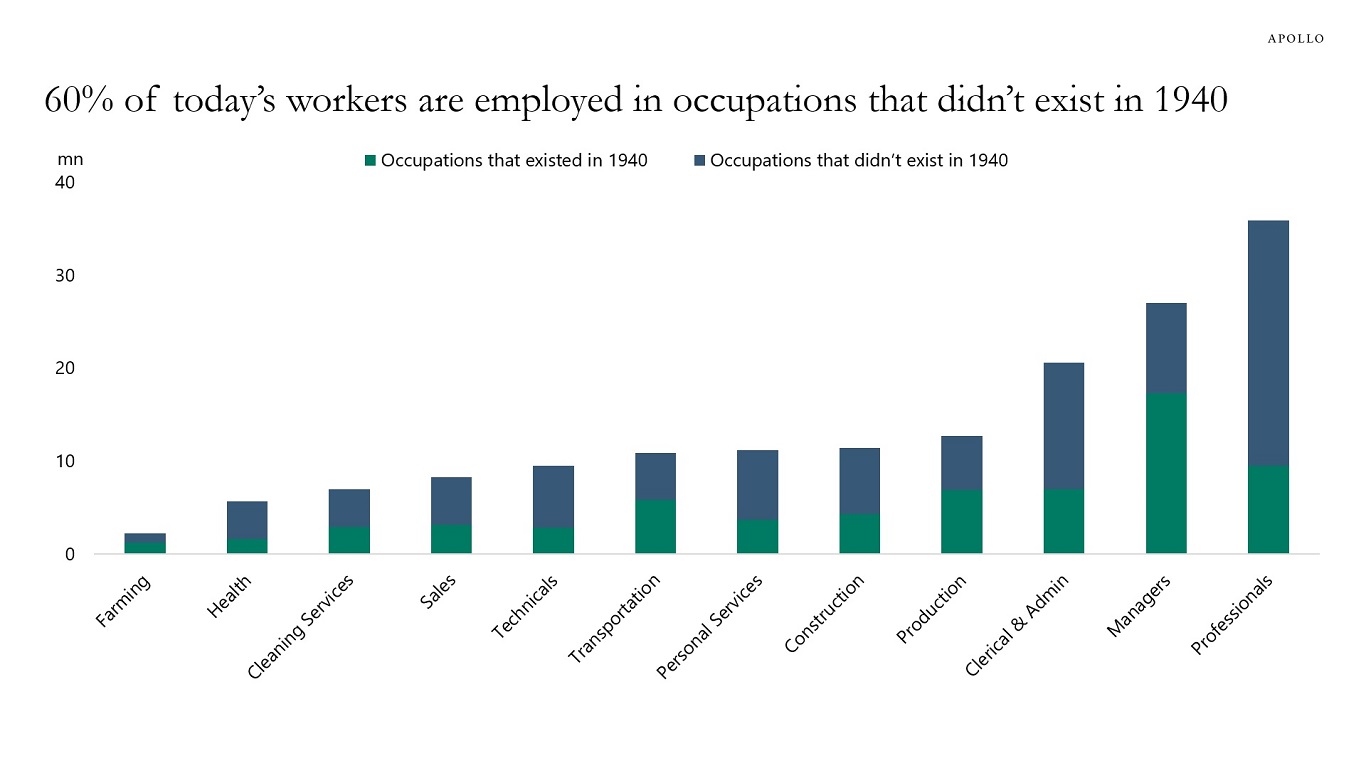
Source: David Autor, Caroline Chin, Anna Salomons, Bryan Seegmiller, “New Frontiers: The Origins and Content of New Work, 1940–2018.” The Quarterly Journal of Economics, Volume 139, Issue 3, August 2024; Apollo Chief Economist See important disclaimers at the bottom of the page.
-
The soft July employment report is inconsistent with the hard data for economic activity, see charts below and our chart book. There are no signs of a slowdown in restaurant bookings, TSA air travel data, tax withholdings, retail sales, hotel demand, bank lending, Broadway show attendance, and weekly box office grosses. Combined with GDP in the second quarter coming in at 2.8%, the bottom line is that the current state of the economy can be described as slowing, but still a soft landing.
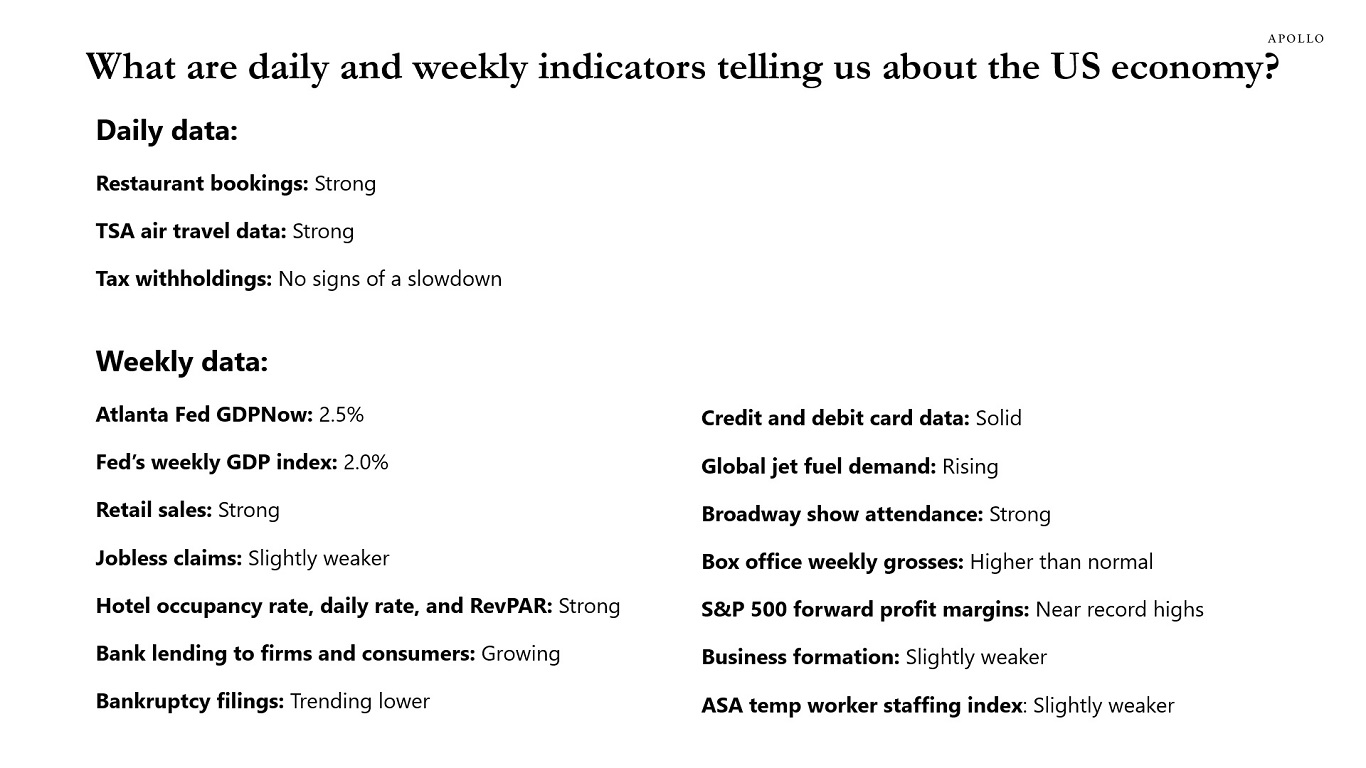
Note: Data as of Saturday, August 3, 2024. Source: Apollo Chief Economist See important disclaimers at the bottom of the page.
-
Since December 2019, US government debt outstanding has grown by $11.6 trillion, and over the same period, nominal GDP has grown by $6.7 trillion, see chart below.
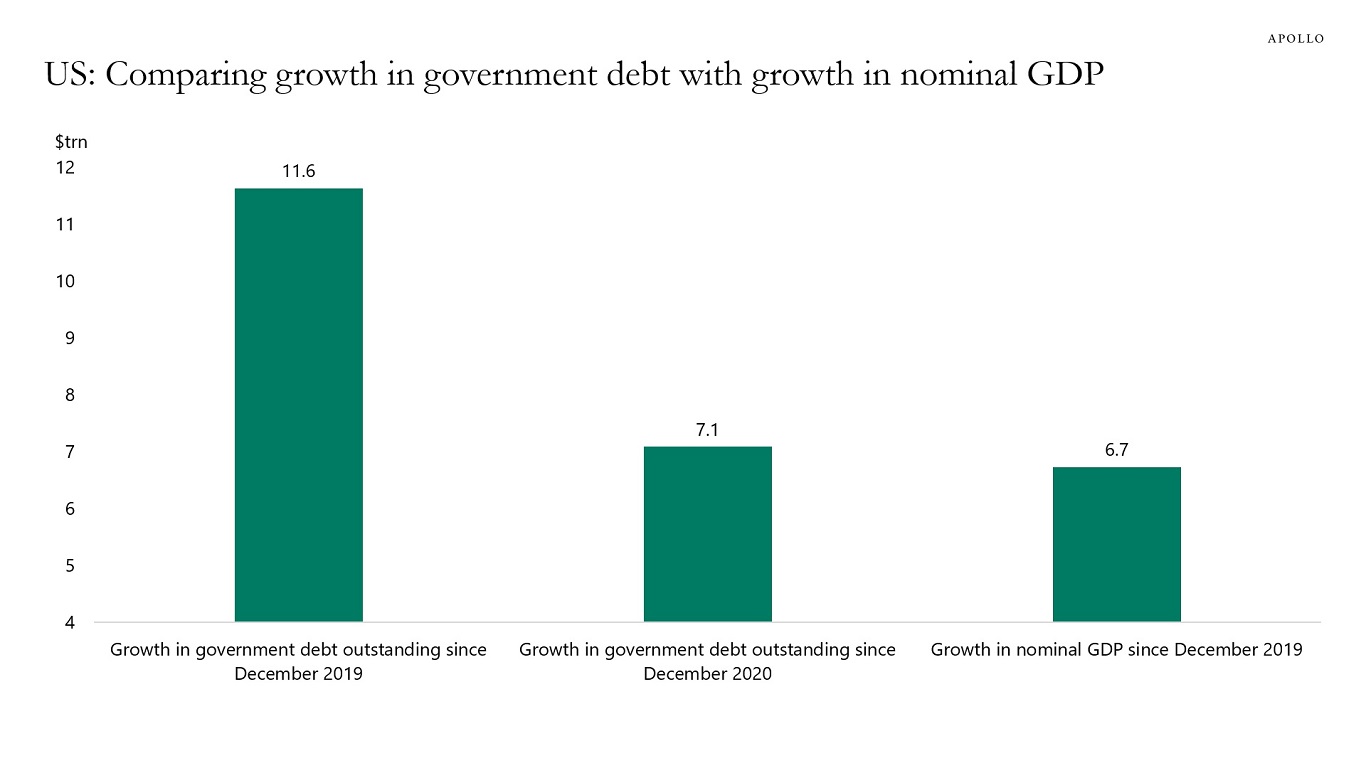
Source: BEA, US Treasury, Apollo Chief Economist See important disclaimers at the bottom of the page.
-
Since the Fed started raising rates, business confidence has diverged for small and large companies, see chart below.
The source of the divergence is likely higher costs of capital for small companies that have higher leverage and lower coverage ratios, and lack access to broadly syndicated loan markets and private credit.
In other words, the transmission mechanism of tighter monetary policy mainly works through smaller companies that are harder hit by Fed hikes and don’t benefit from tighter credit spreads and higher stock prices.
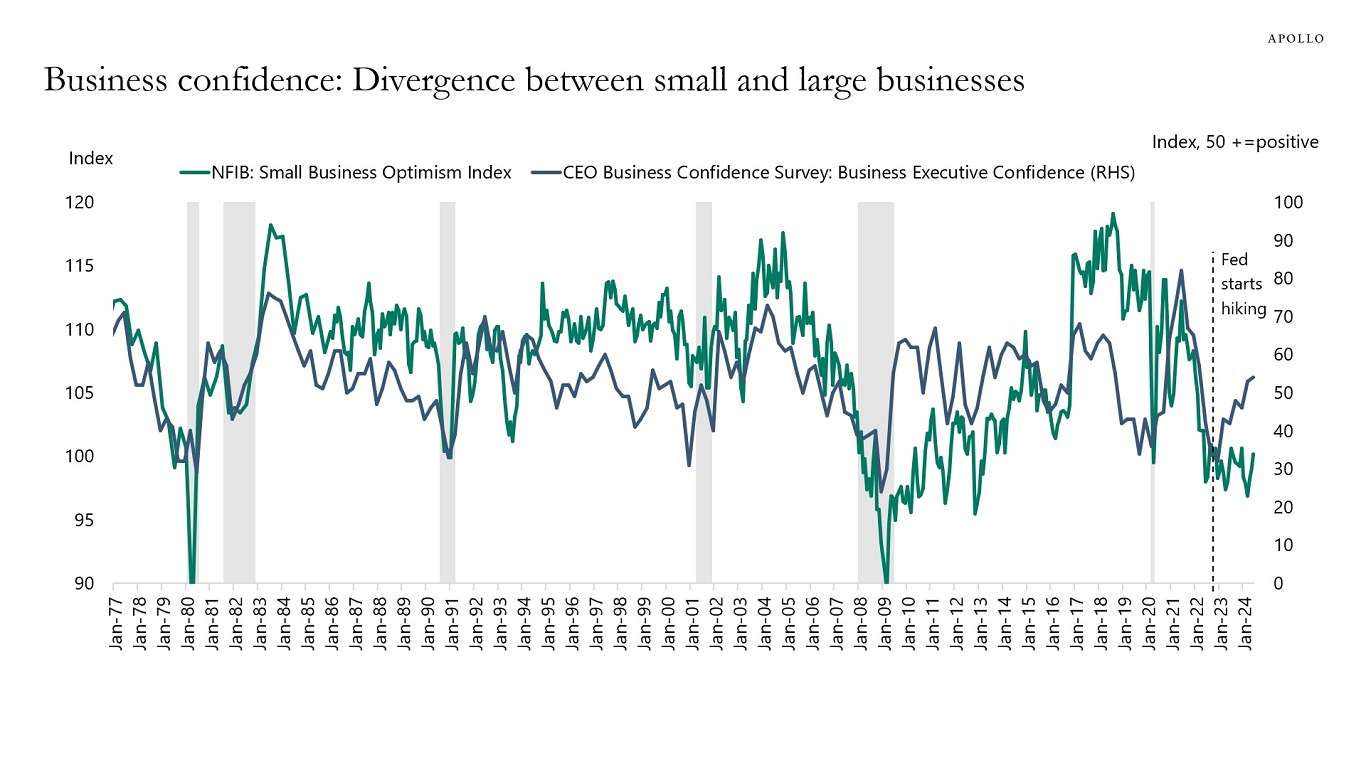
Source: Conference Board, NFIB, Haver Analytics, Apollo Chief Economist See important disclaimers at the bottom of the page.
-
China is slowing, Europe is slowing, and the US economy is also in the process of slowing down over the coming quarters.
As a result, commodity prices are falling.
Prices for energy, which make up almost 60% of the S&P GSCI, are declining because of weaker demand from China and more energy supply in the US.
Agriculture prices are falling, in particular soybean, driven lower by weaker global growth. But there are exceptions such as coffee, cocoa, livestock, and orange juice, where low supply is important.
Industrial metals prices are falling because of weaker global growth. For precious metals, gold prices are rising as households in China diversify away from falling Chinese property prices and falling Chinese stock prices. Central banks are also buying gold.
Our latest commodity outlook chart book is available here.
See important disclaimers at the bottom of the page.
-
The business cycles in China and India are decoupling after having grown in sync for decades, see chart below.
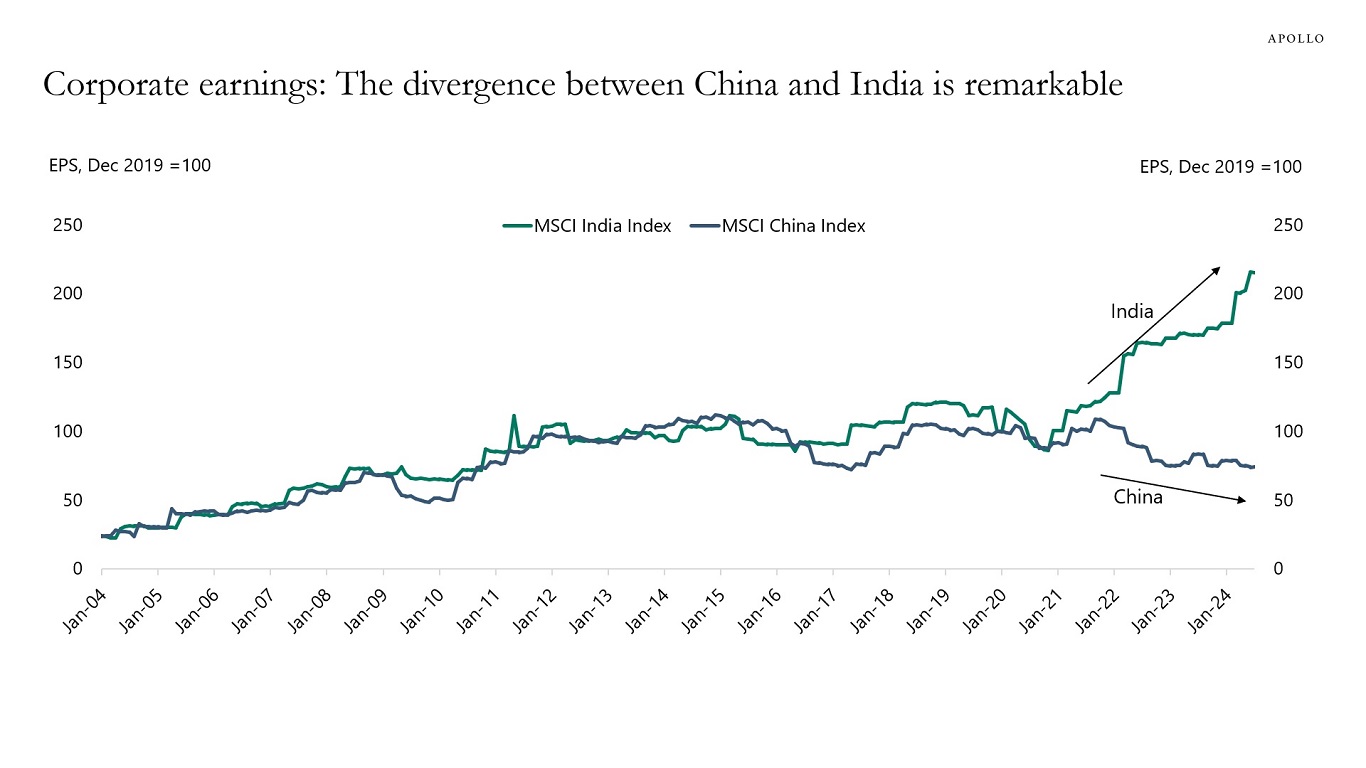
Source: Bloomberg, Apollo Chief Economist See important disclaimers at the bottom of the page.
-
The map below shows the share of primary energy consumption coming from renewable sources across countries, and the bottom line is that there is a significant need for investment in renewable energy around the world.
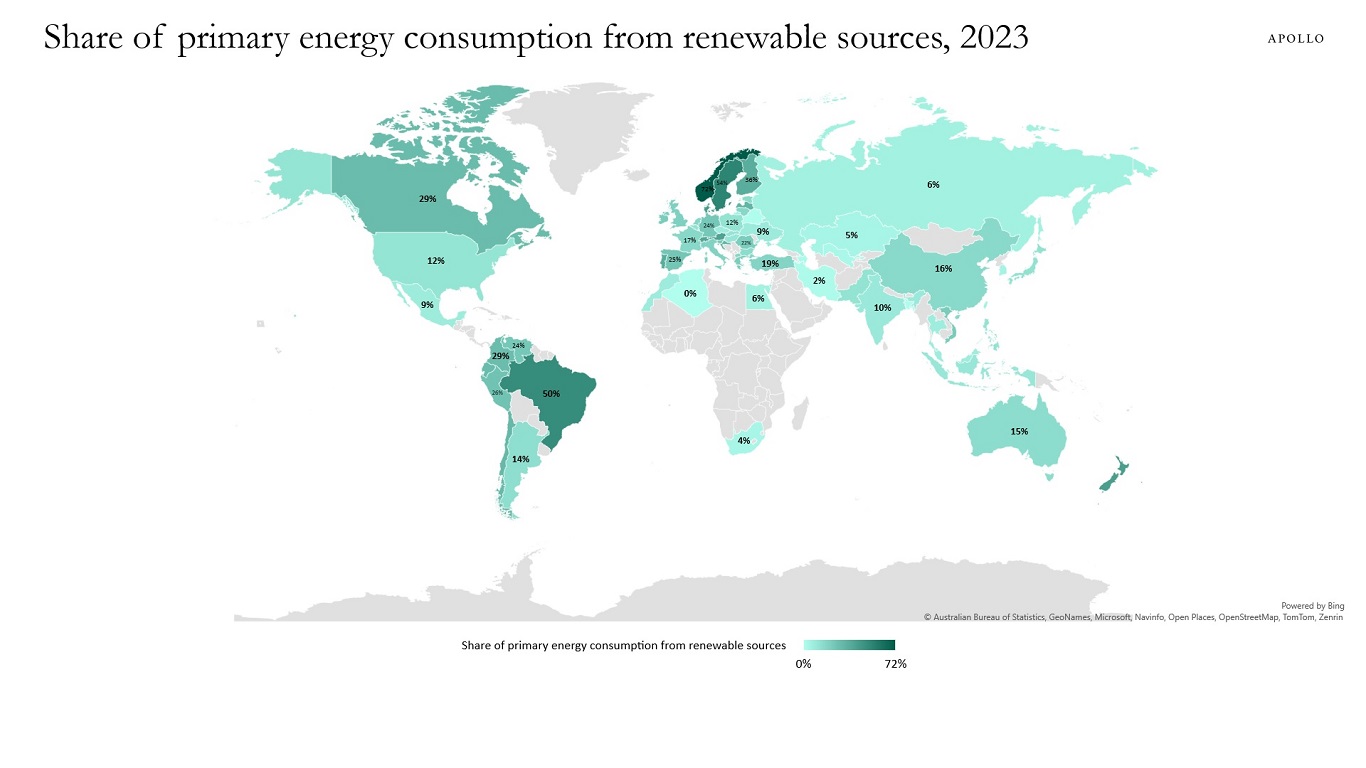
Source: Energy Institute – Statistical Review of World Energy (2024), OurWorldInData.org/energy, Apollo Chief Economist See important disclaimers at the bottom of the page.
-
The number of publicly listed companies has also declined in the UK, see chart below.
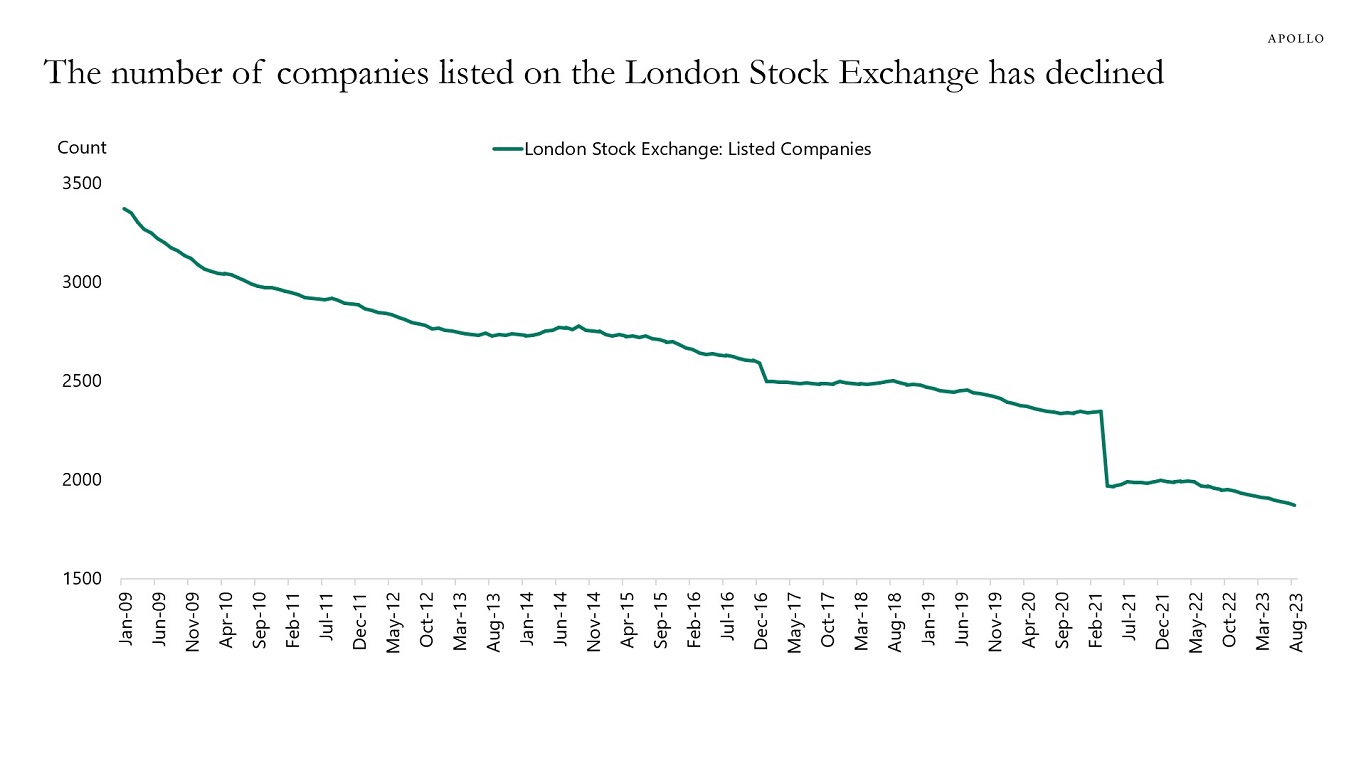
Source: World Federation of Exchanges, Haver Analytics, Apollo Chief Economist. Note: The sharp decline in April 2021 was due to Brexit. See important disclaimers at the bottom of the page.

This presentation may not be distributed, transmitted or otherwise communicated to others in whole or in part without the express consent of Apollo Global Management, Inc. (together with its subsidiaries, “Apollo”).
Apollo makes no representation or warranty, expressed or implied, with respect to the accuracy, reasonableness, or completeness of any of the statements made during this presentation, including, but not limited to, statements obtained from third parties. Opinions, estimates and projections constitute the current judgment of the speaker as of the date indicated. They do not necessarily reflect the views and opinions of Apollo and are subject to change at any time without notice. Apollo does not have any responsibility to update this presentation to account for such changes. There can be no assurance that any trends discussed during this presentation will continue.
Statements made throughout this presentation are not intended to provide, and should not be relied upon for, accounting, legal or tax advice and do not constitute an investment recommendation or investment advice. Investors should make an independent investigation of the information discussed during this presentation, including consulting their tax, legal, accounting or other advisors about such information. Apollo does not act for you and is not responsible for providing you with the protections afforded to its clients. This presentation does not constitute an offer to sell, or the solicitation of an offer to buy, any security, product or service, including interest in any investment product or fund or account managed or advised by Apollo.
Certain statements made throughout this presentation may be “forward-looking” in nature. Due to various risks and uncertainties, actual events or results may differ materially from those reflected or contemplated in such forward-looking information. As such, undue reliance should not be placed on such statements. Forward-looking statements may be identified by the use of terminology including, but not limited to, “may”, “will”, “should”, “expect”, “anticipate”, “target”, “project”, “estimate”, “intend”, “continue” or “believe” or the negatives thereof or other variations thereon or comparable terminology.