Want it delivered daily to your inbox?
-
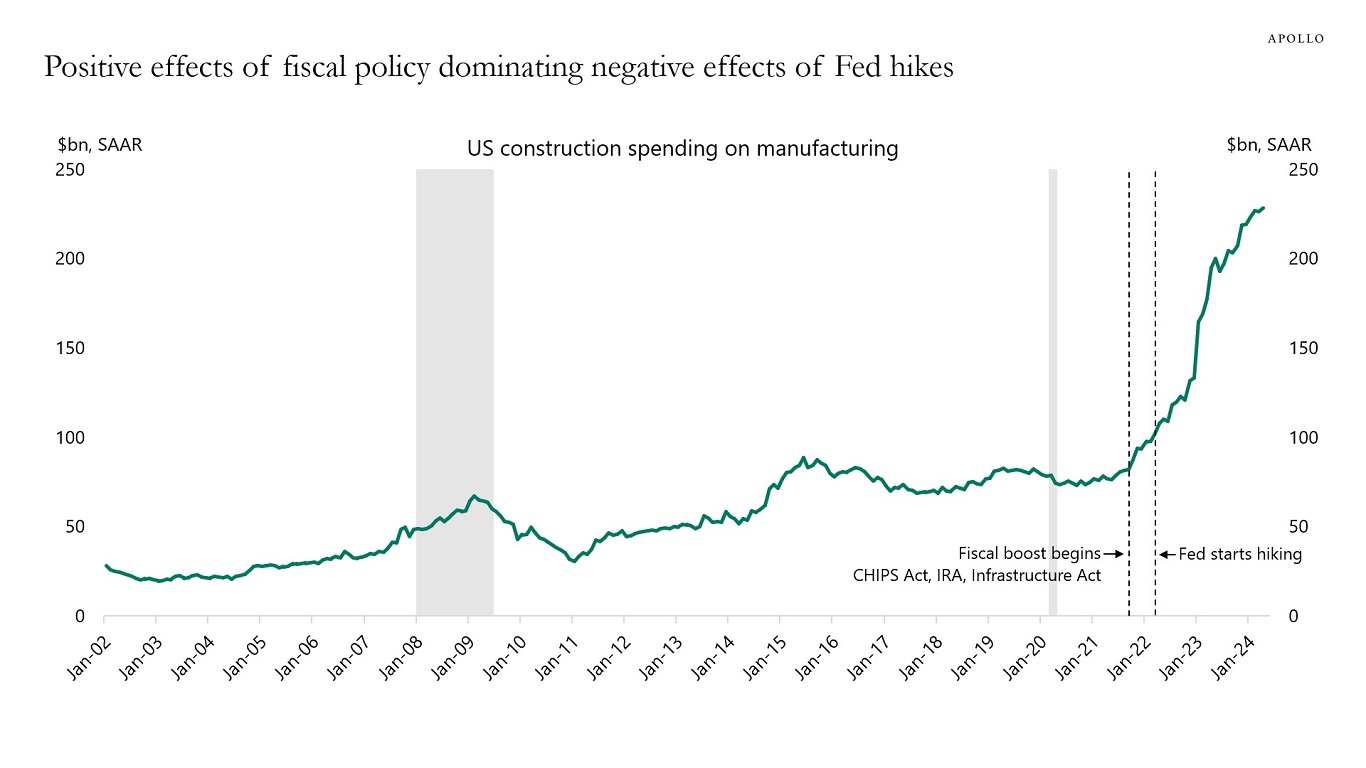
A key reason why the economy is still so strong is the significant tailwind to growth coming from the CHIPS Act, the Inflation Reduction Act, and the Infrastructure Act.
Monetary policy is using high interest rates trying to slow the economy down. Fiscal policy is utilizing open-ended policies to boost growth and employment.
In short, the positive effects of fiscal policy are dominating the negative effects of Fed hikes, see chart below.
Source: Census Bureau, Haver Analytics, Apollo Chief Economist See important disclaimers at the bottom of the page.
-
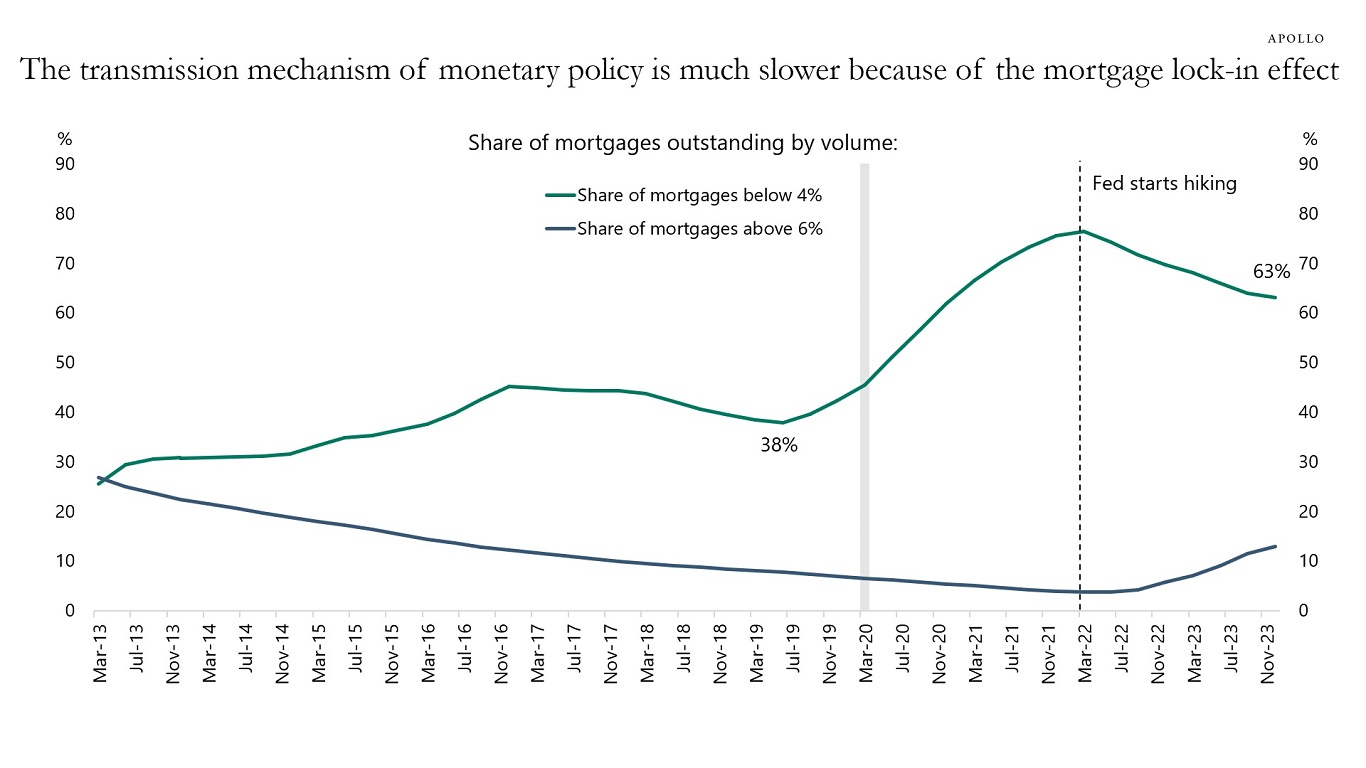
Before the pandemic, the share of outstanding mortgages with interest rates below 4% was 38%. Today it is 63%, see chart below.
In other words, housing is adjusting very slowly to Fed hikes. Millions of households still benefit from having locked-in low mortgage rates during the pandemic.
Put differently, the transmission mechanism of monetary policy is much slower than normal, and the Fed will need to keep interest rates higher for longer to get inflation under control.
Source: FHFA, Apollo Chief Economist See important disclaimers at the bottom of the page.
-
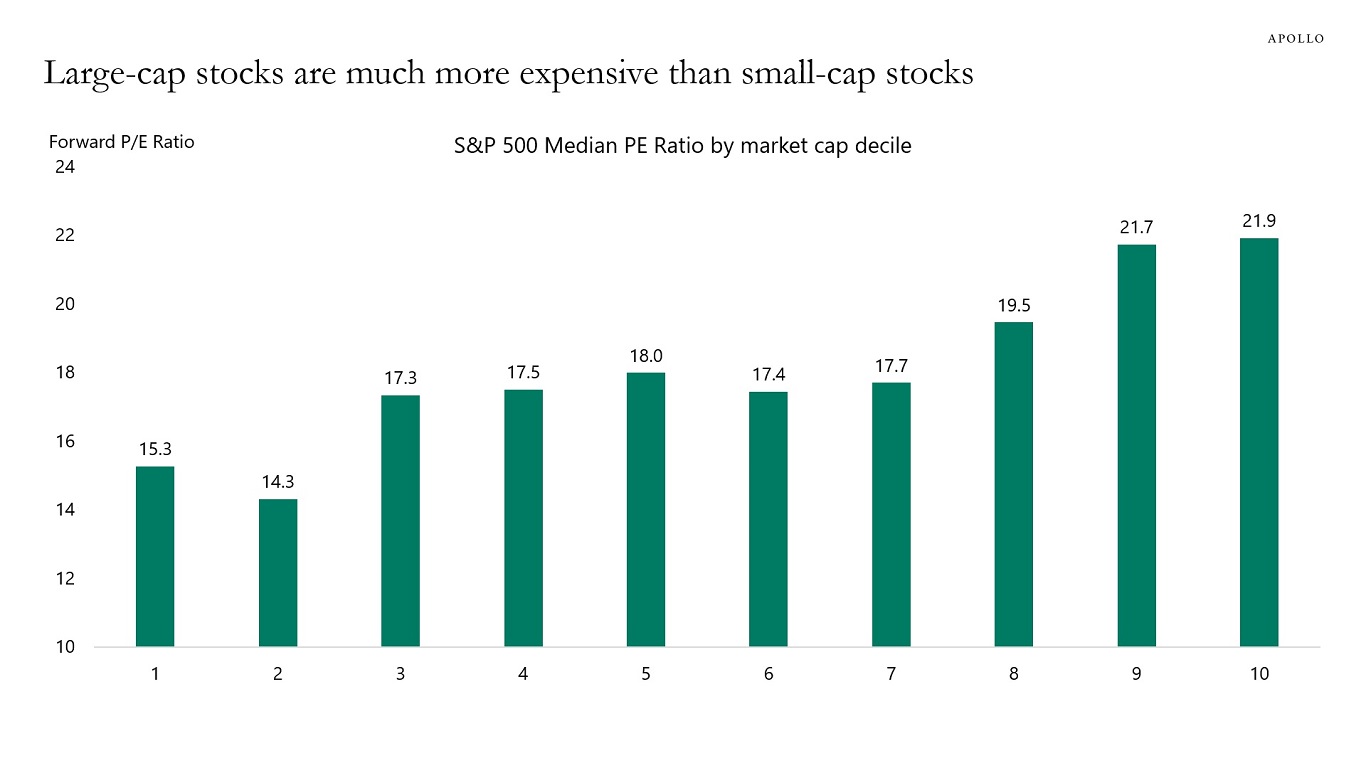
Looking at P/E ratios for companies in the S&P 500 ranked by market cap shows that large-cap companies are much more expensive than small-cap companies, see chart below.
Why are P/E ratios low for small-cap companies and high for large-cap companies?
Because Fed hikes and higher costs of capital are weighing on highly leveraged small-cap companies with low coverage ratios.
And the AI story has boosted valuations of mega-cap names.
With the Fed keeping interest rates higher for longer, and the AI narrative pushing valuations and index concentration to extreme levels, the downside risks to equities are growing.
Source: Bloomberg, Apollo Chief Economist See important disclaimers at the bottom of the page.
-
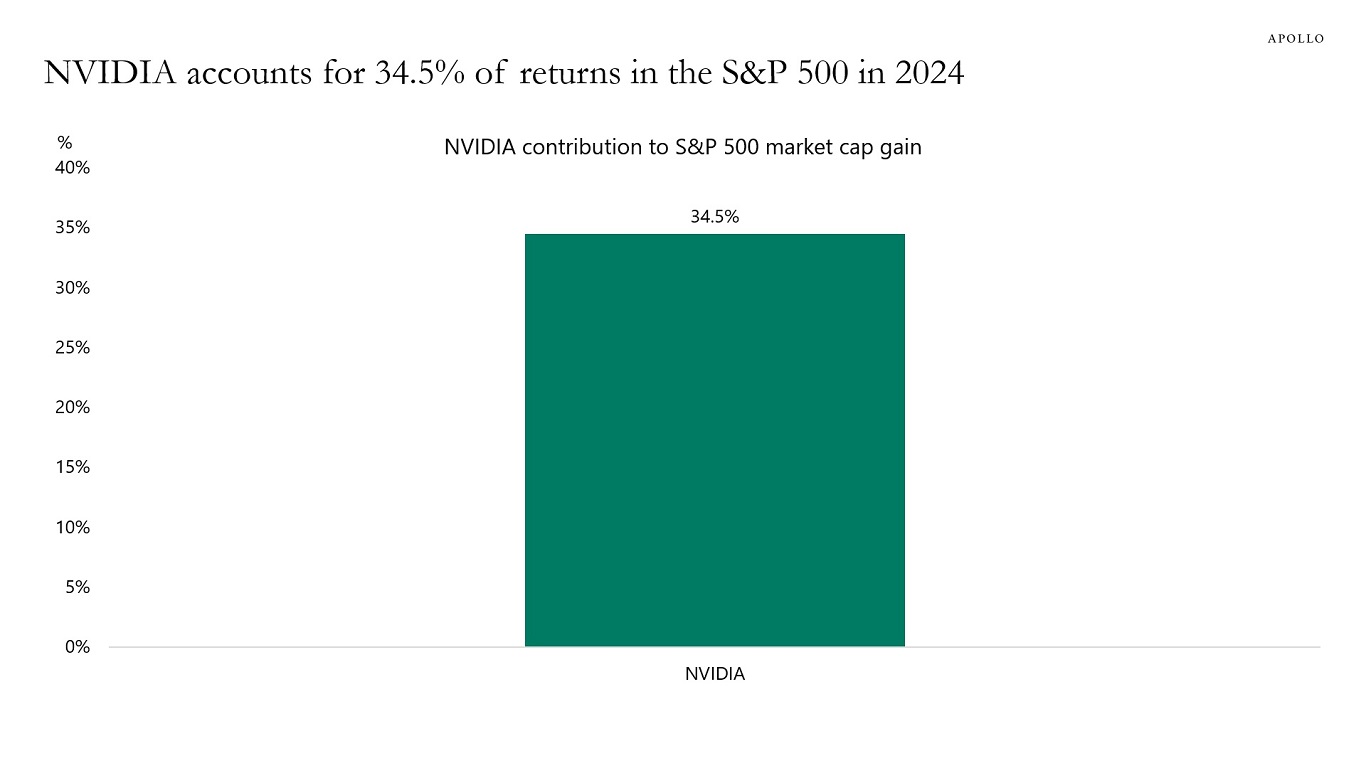
Thirty-five percent of the increase in the S&P 500’s market cap since the beginning of the year has come from one stock, see the chart below. Such a high concentration implies that if NVIDIA continues to rise, then things are fine. But if it starts to decline, then the S&P 500 will be hit hard.
The bottom line is that the extreme concentration of returns in the S&P 500 makes investors more vulnerable to single headlines impacting the one stock driving index returns.
Source: Bloomberg, Apollo Chief Economist. Note: Calculated as share of market cap growth since January 1, 2024. See important disclaimers at the bottom of the page.
-
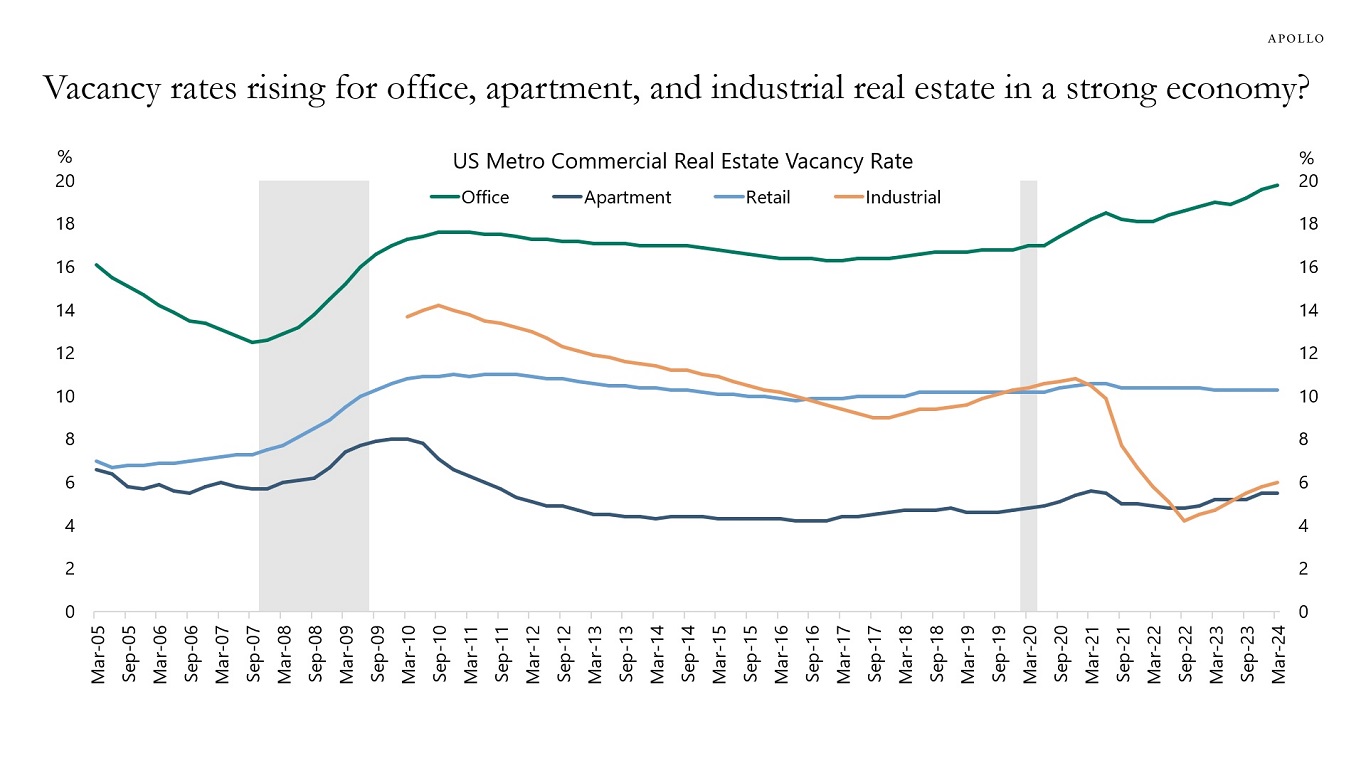
It is remarkable how vacancy rates for commercial real estate are moving sideways or higher in a strong economy, see the first chart below. You would have expected that the ongoing strong growth in employment and GDP would push vacancy rates lower. If the Fed succeeds with slowing the economy down, then all these lines will move higher, and potentially very quickly.
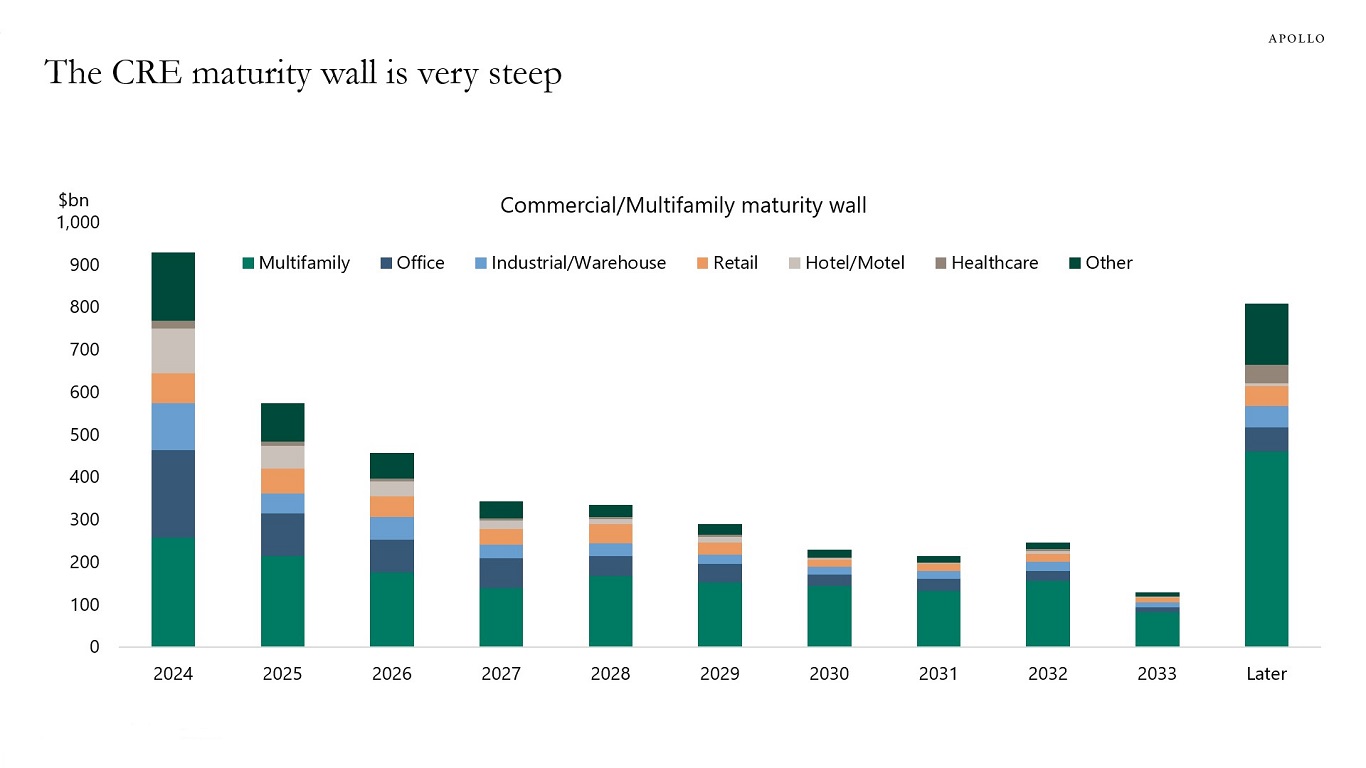
Combined with the steep maturity wall for CRE, see the second chart, the bottom line is that the pain in office, apartments, and industrial real estate continues.
Source: Bloomberg, Apollo Chief Economist 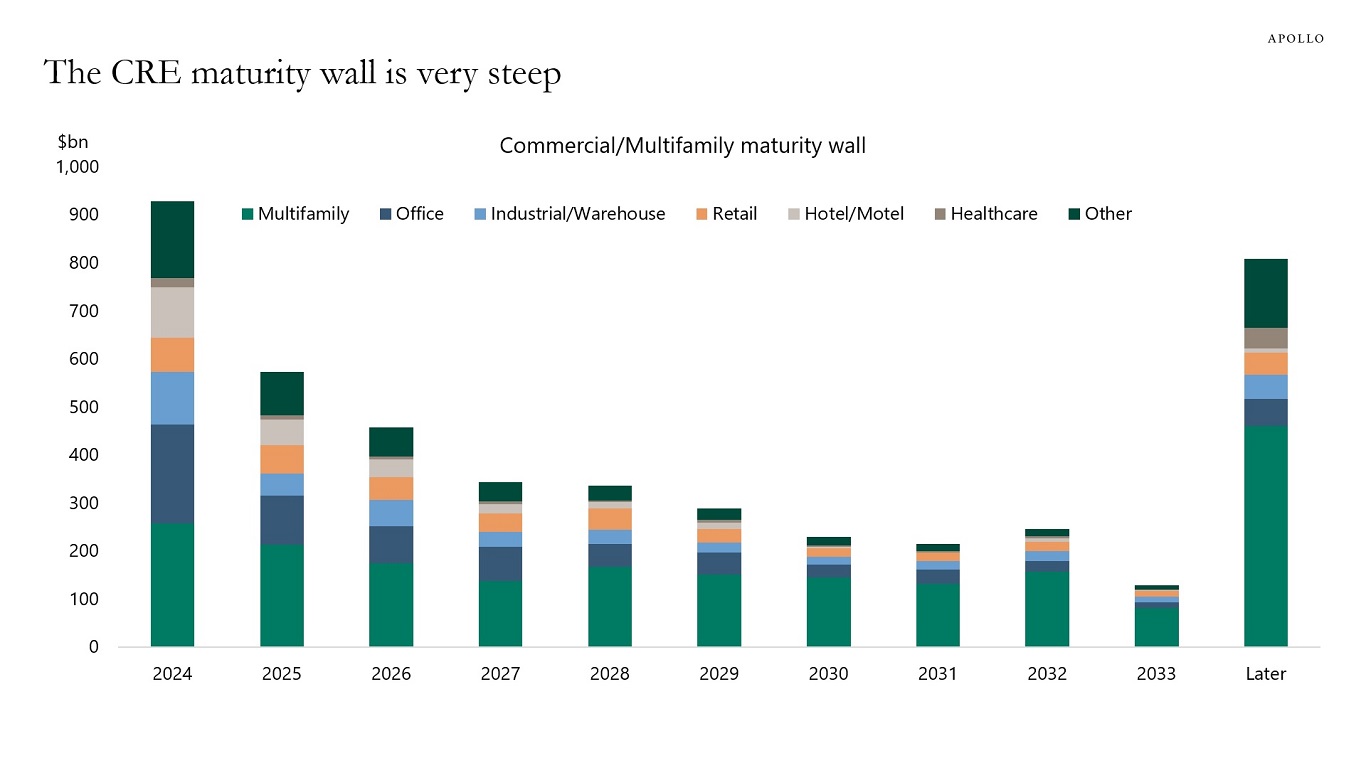
Source: MBA, Apollo Chief Economist See important disclaimers at the bottom of the page.
-
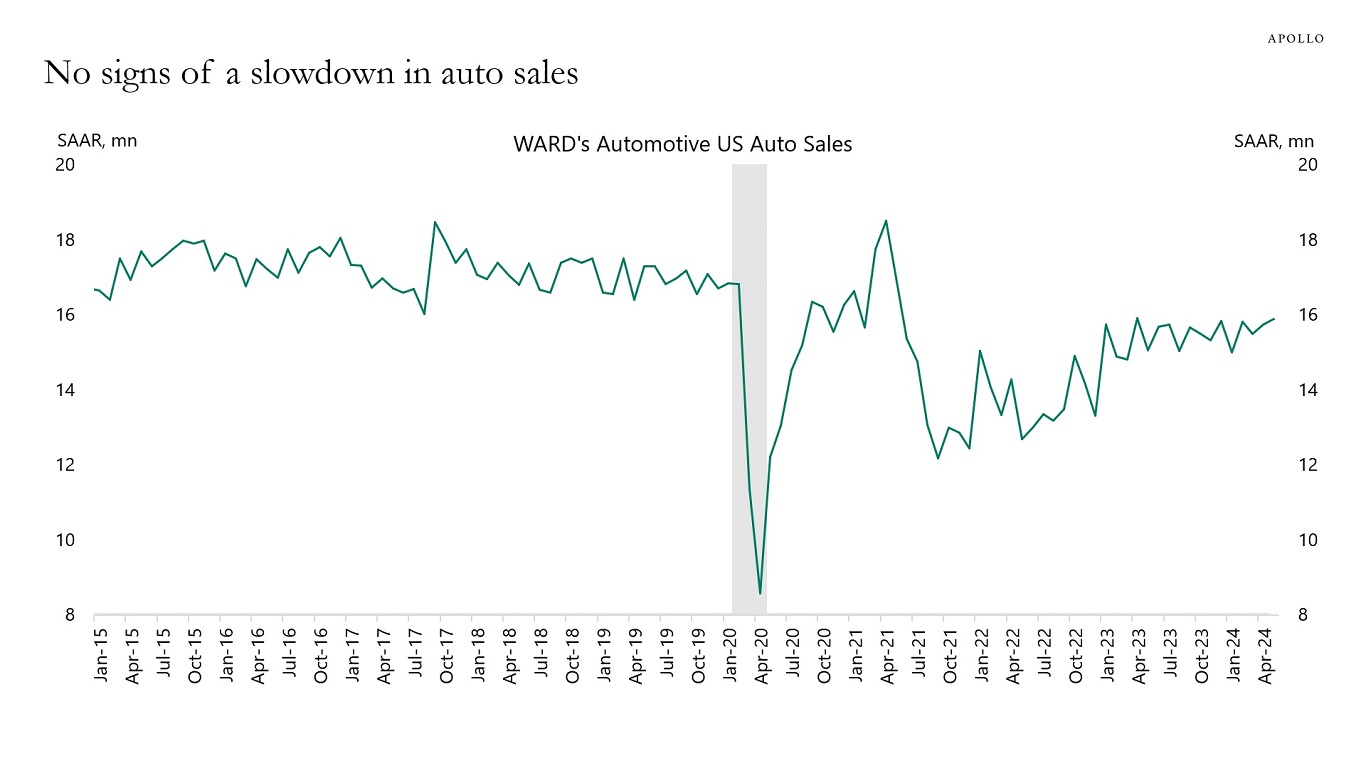
Although car sales are very sensitive to higher interest rates, the data for auto sales shows no signs of a slowdown. This suggests significant support for auto sales from wealth gains for households via higher stock prices, higher home prices, and higher cash flow from fixed income.
Source: Bloomberg, Apollo Chief Economist See important disclaimers at the bottom of the page.
-
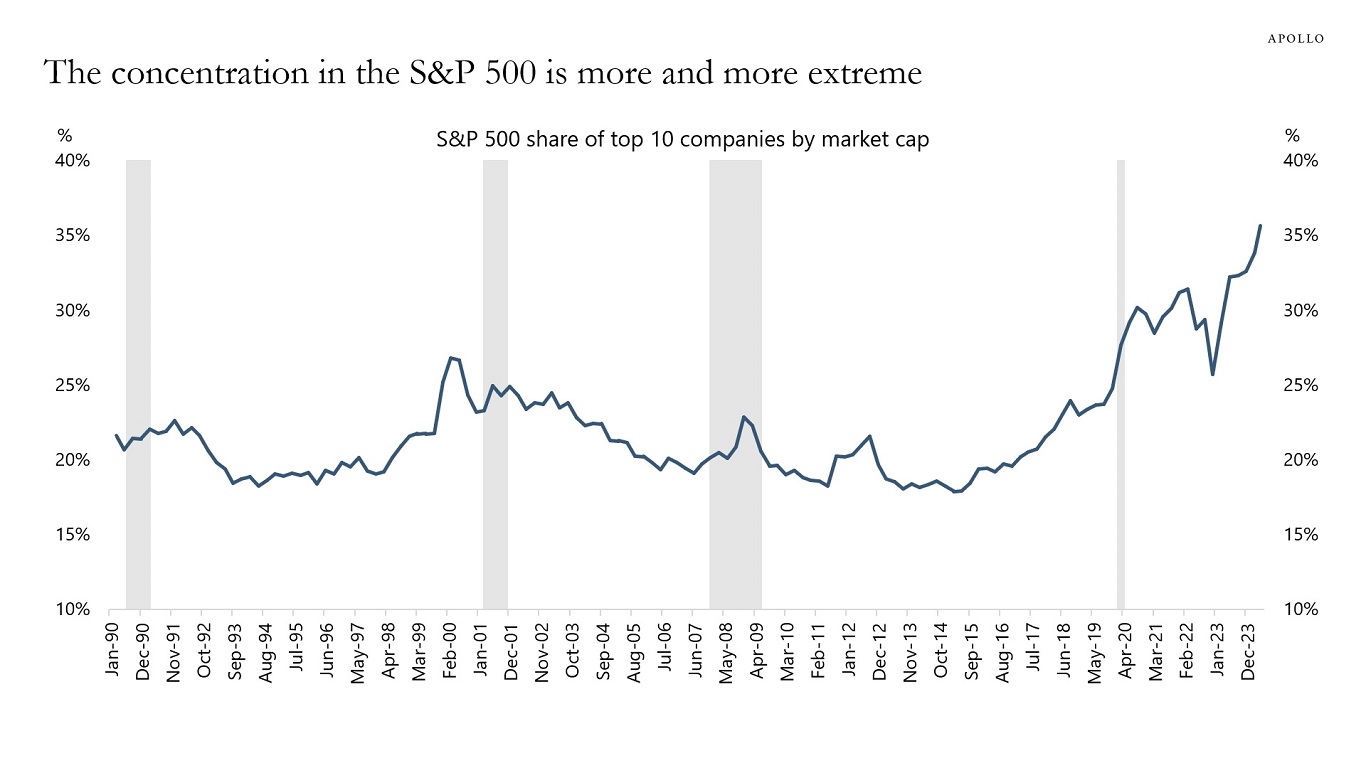
The top 10 stocks in the S&P 500 now make up a record-high 35% of the index, see chart below.
Source: Bloomberg, Apollo Chief Economist See important disclaimers at the bottom of the page.
-
There are a lot of commercial real estate investments that need to be refinanced in 2024, see chart below. And rates higher for longer continue to have a negative impact across CRE.
Source: MBA, Apollo Chief Economist See important disclaimers at the bottom of the page.
-
The consensus probability of a recession has declined significantly in recent months and now stands at 30% for the US, Europe, and UK, see chart below.

Source: Bloomberg, Apollo Chief Economist See important disclaimers at the bottom of the page.
-
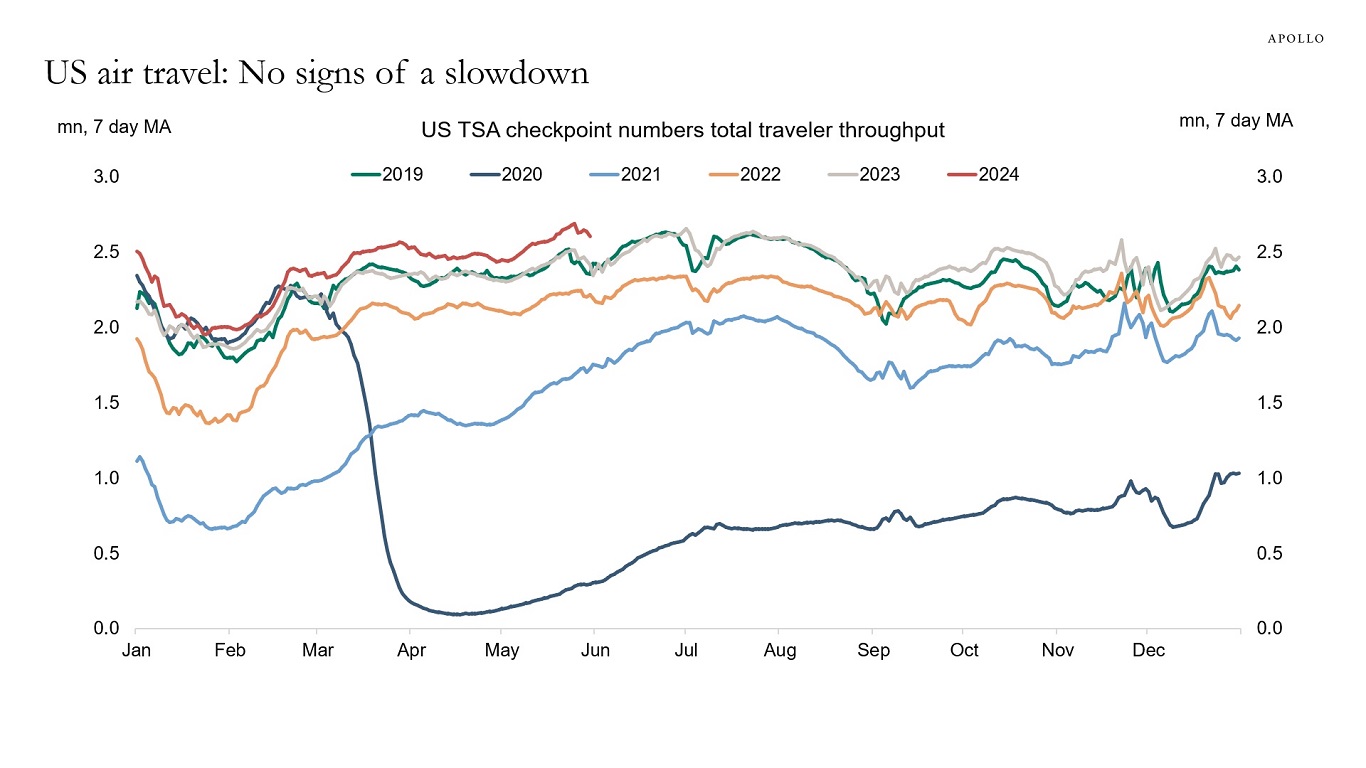
The TSA has daily data for the number of people scanning their boarding pass with a TSA agent, and it continues to show no signs of the economy slowing down, see chart below.
Source: TSA, Bloomberg, Apollo Chief Economist See important disclaimers at the bottom of the page.
This presentation may not be distributed, transmitted or otherwise communicated to others in whole or in part without the express consent of Apollo Global Management, Inc. (together with its subsidiaries, “Apollo”).
Apollo makes no representation or warranty, expressed or implied, with respect to the accuracy, reasonableness, or completeness of any of the statements made during this presentation, including, but not limited to, statements obtained from third parties. Opinions, estimates and projections constitute the current judgment of the speaker as of the date indicated. They do not necessarily reflect the views and opinions of Apollo and are subject to change at any time without notice. Apollo does not have any responsibility to update this presentation to account for such changes. There can be no assurance that any trends discussed during this presentation will continue.
Statements made throughout this presentation are not intended to provide, and should not be relied upon for, accounting, legal or tax advice and do not constitute an investment recommendation or investment advice. Investors should make an independent investigation of the information discussed during this presentation, including consulting their tax, legal, accounting or other advisors about such information. Apollo does not act for you and is not responsible for providing you with the protections afforded to its clients. This presentation does not constitute an offer to sell, or the solicitation of an offer to buy, any security, product or service, including interest in any investment product or fund or account managed or advised by Apollo.
Certain statements made throughout this presentation may be “forward-looking” in nature. Due to various risks and uncertainties, actual events or results may differ materially from those reflected or contemplated in such forward-looking information. As such, undue reliance should not be placed on such statements. Forward-looking statements may be identified by the use of terminology including, but not limited to, “may”, “will”, “should”, “expect”, “anticipate”, “target”, “project”, “estimate”, “intend”, “continue” or “believe” or the negatives thereof or other variations thereon or comparable terminology.


