


Want it delivered daily to your inbox?
-
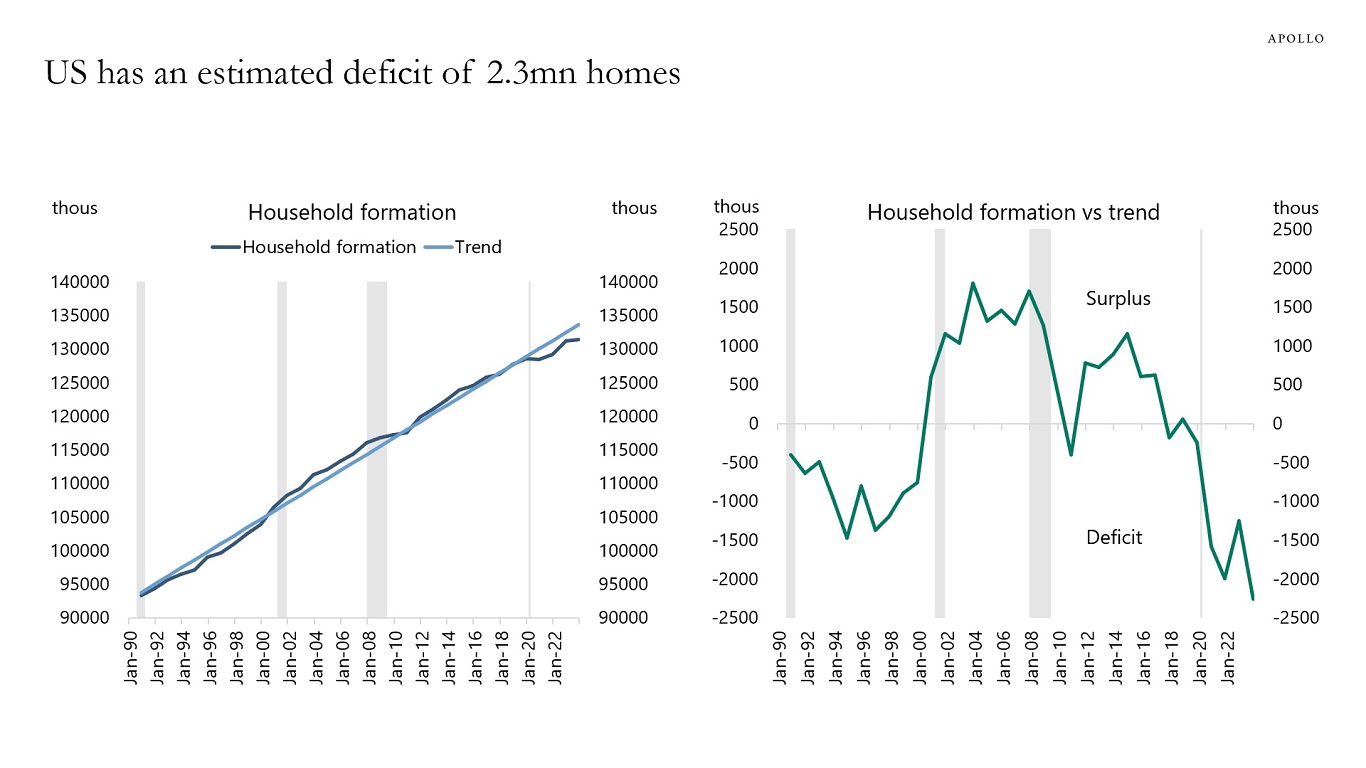
Ten reasons to be bullish on US housing:
1) Household formation is 2.3 million below its long-run trend, i.e., there is pent-up demand for 2.3 million homes in the US, see the first chart.
2) The share of homes without a mortgage is rising, and now at about 40%, see the second chart.
3) 30% of homes are selling above their list price, see the third chart.
4) The inventory of homes for sale remains very low, see the fourth chart.
5) The share of people planning to move to a new address has started to increase, see the fifth chart.
6) The share of homes built for rent is going up, see the sixth chart.
7) Employment in construction is rebounding, see the seventh chart.
8) The number of new foreclosures remains very low, see the eighth chart.
9) About half of mortgages have an interest rate below 4%, see the ninth chart.
10) After the Fed pivot in November 2023, asking rents have started to increase, see the tenth chart.
Our updated US housing chart book is available here.
Source: Census, Haver Analytics, Apollo Chief Economist 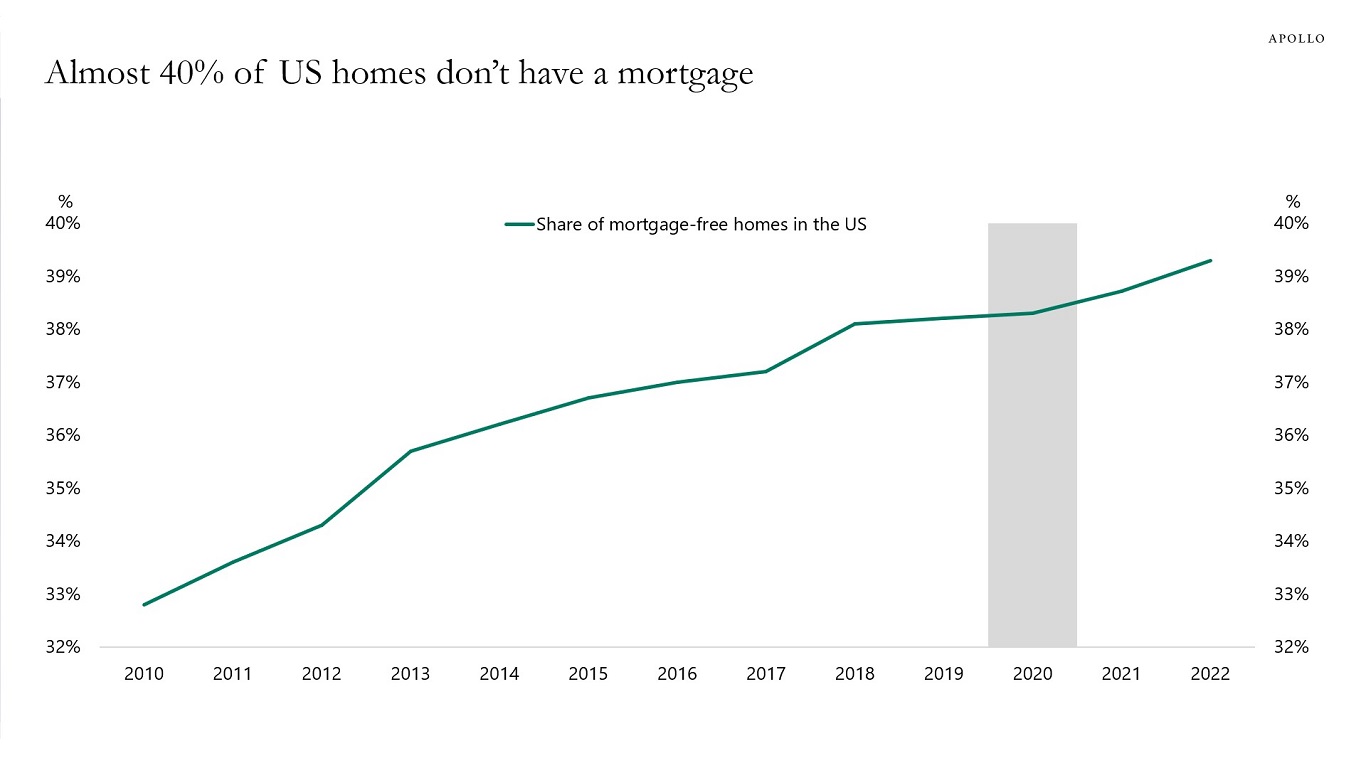
Source: US Census Bureau, Bloomberg, Apollo Chief Economist 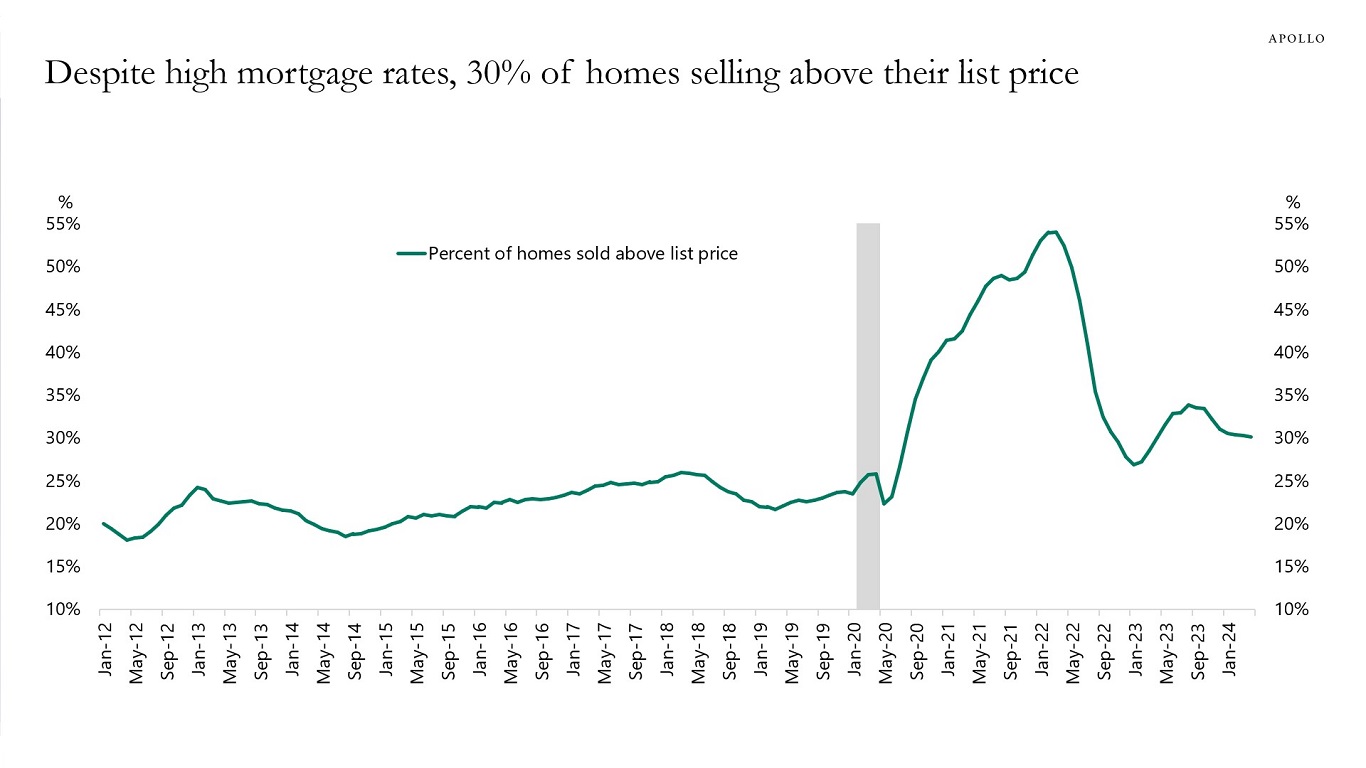
Source: Redfin, Apollo Chief Economist 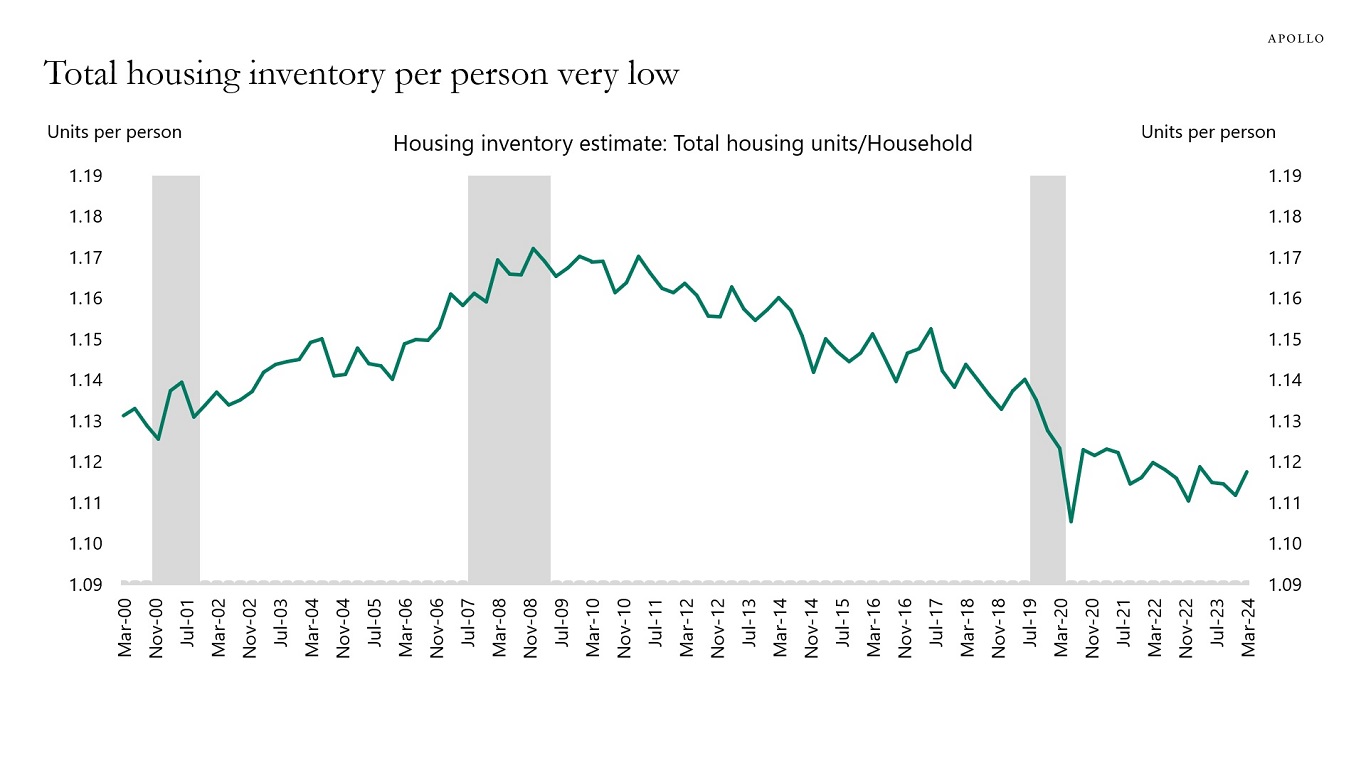
Source: Census Bureau, FRED, Apollo Chief Economist 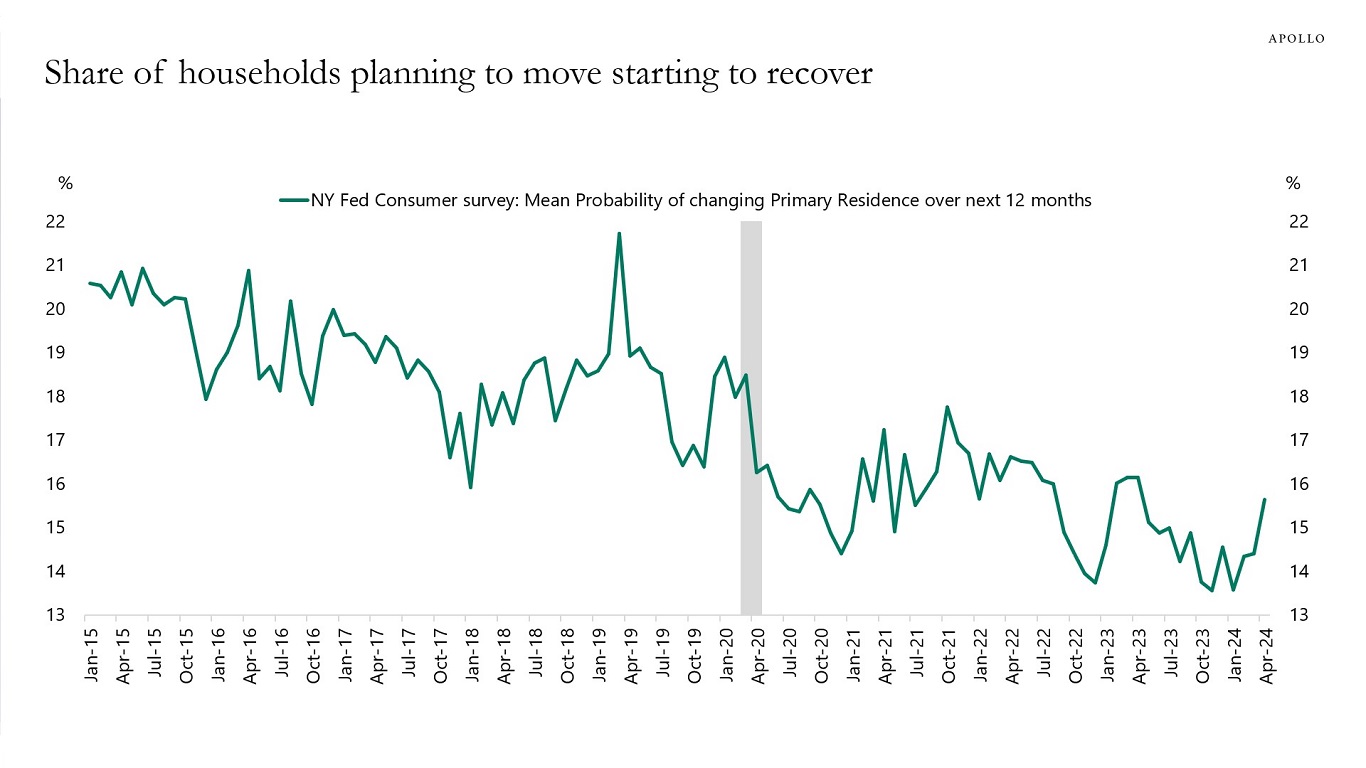
Source: FRB of NY, Haver Analytics, Apollo Chief Economist 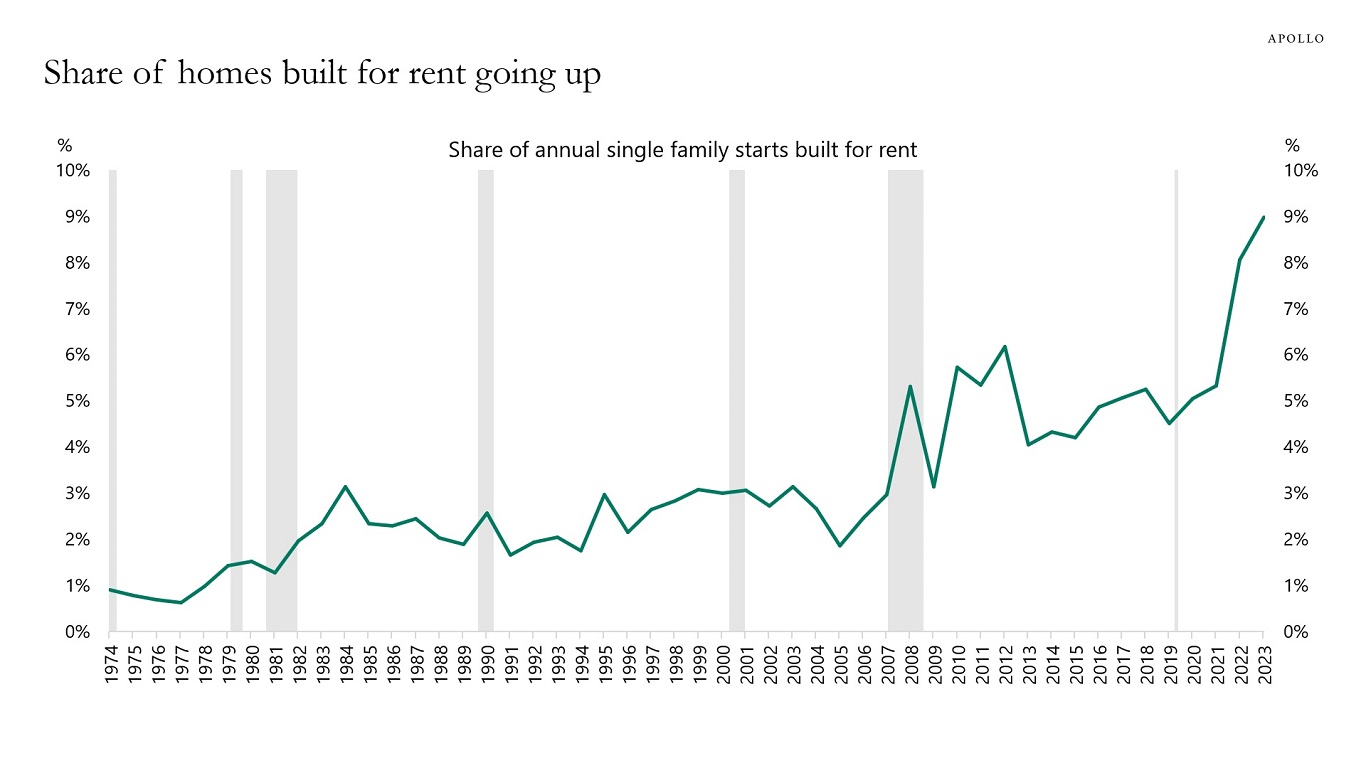
Source: Census Bureau, Haver Analytics, Apollo Chief Economist 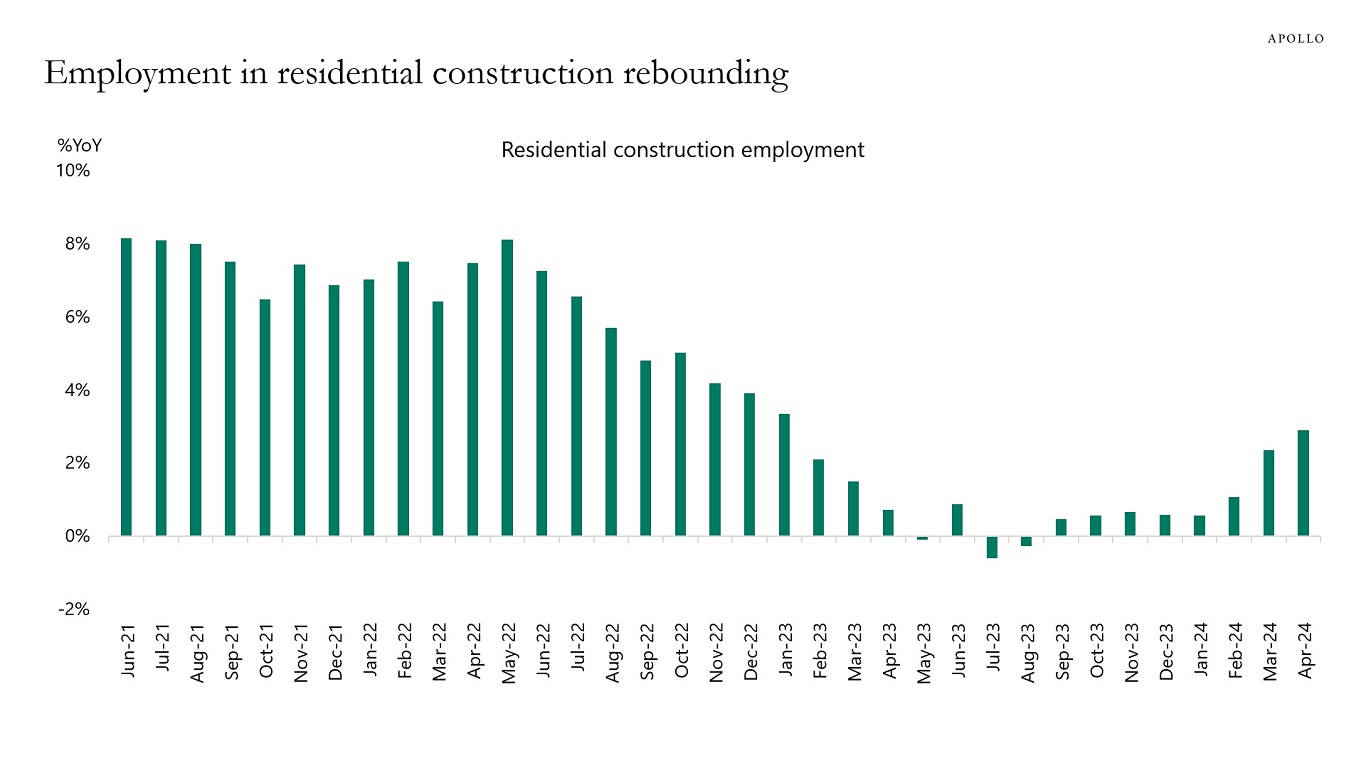
Source: BLS, Haver Analytics, Apollo Chief Economist 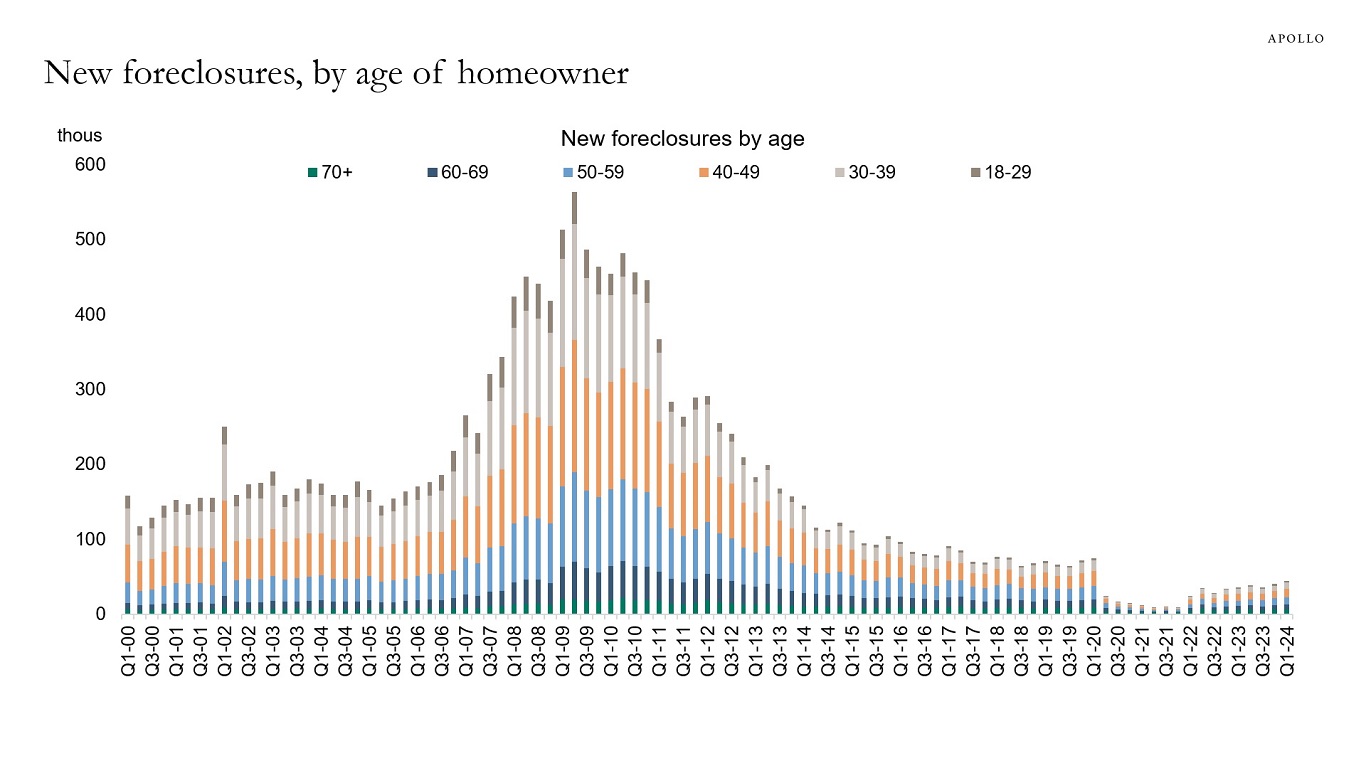
Source: FRBNY Consumer Credit Panel, Equifax, Haver Analytics, Apollo Chief Economist 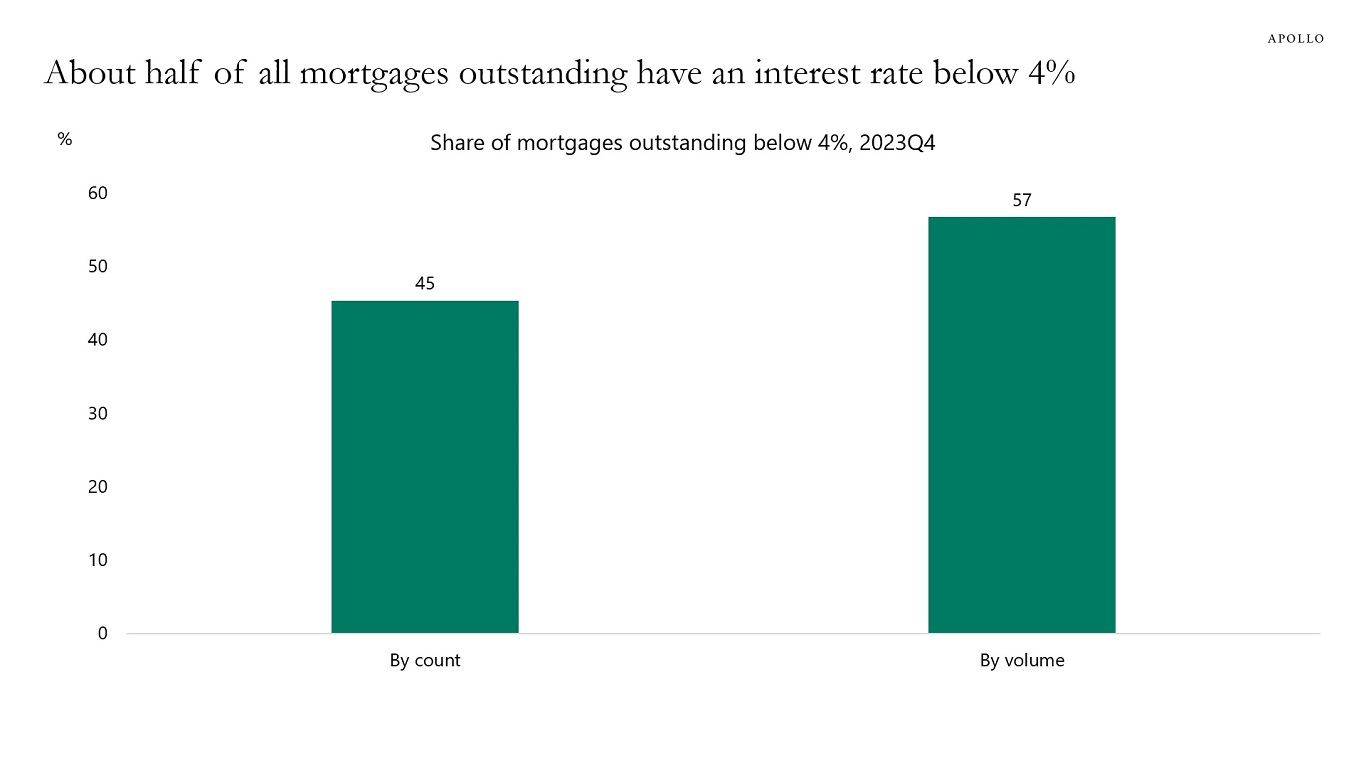
Source: FHFA, Apollo Chief Economist 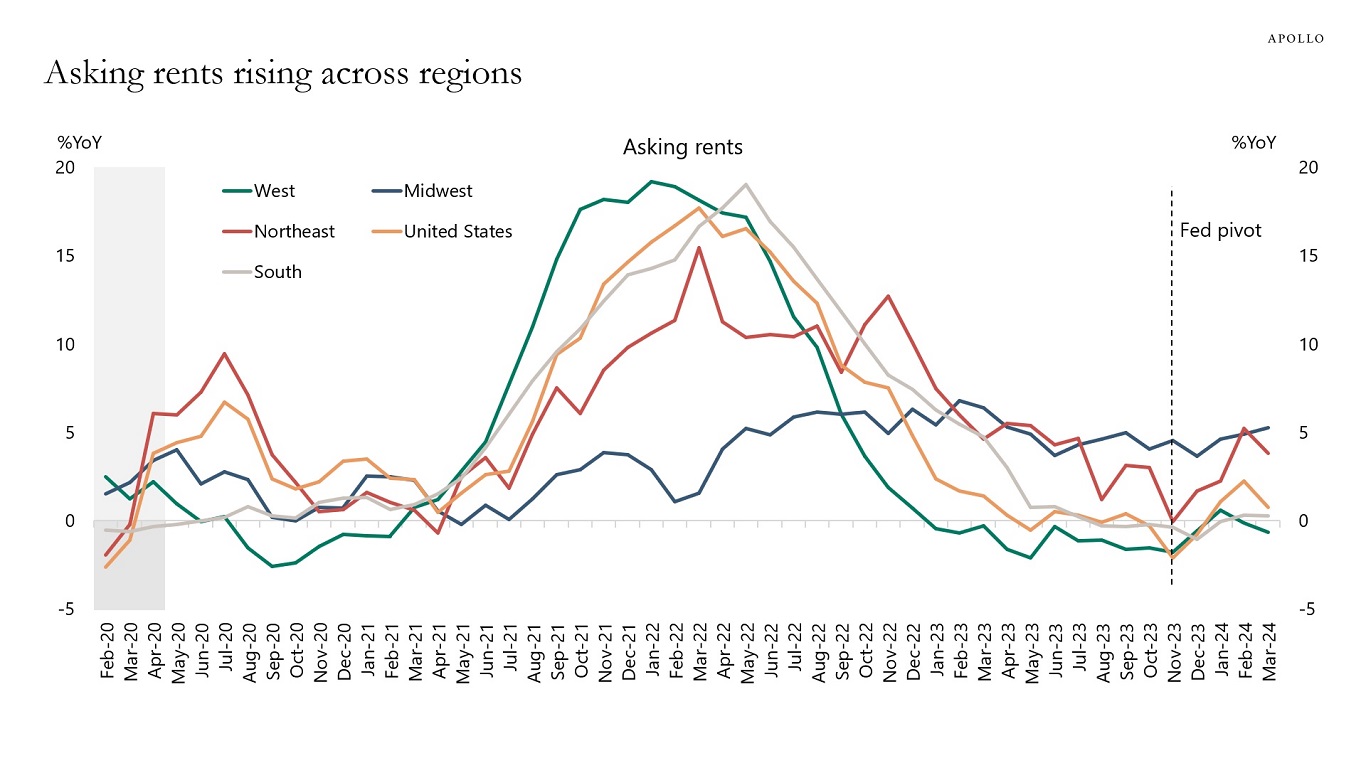
Source: Rent.com, Apollo Chief Economist See important disclaimers at the bottom of the page.
-
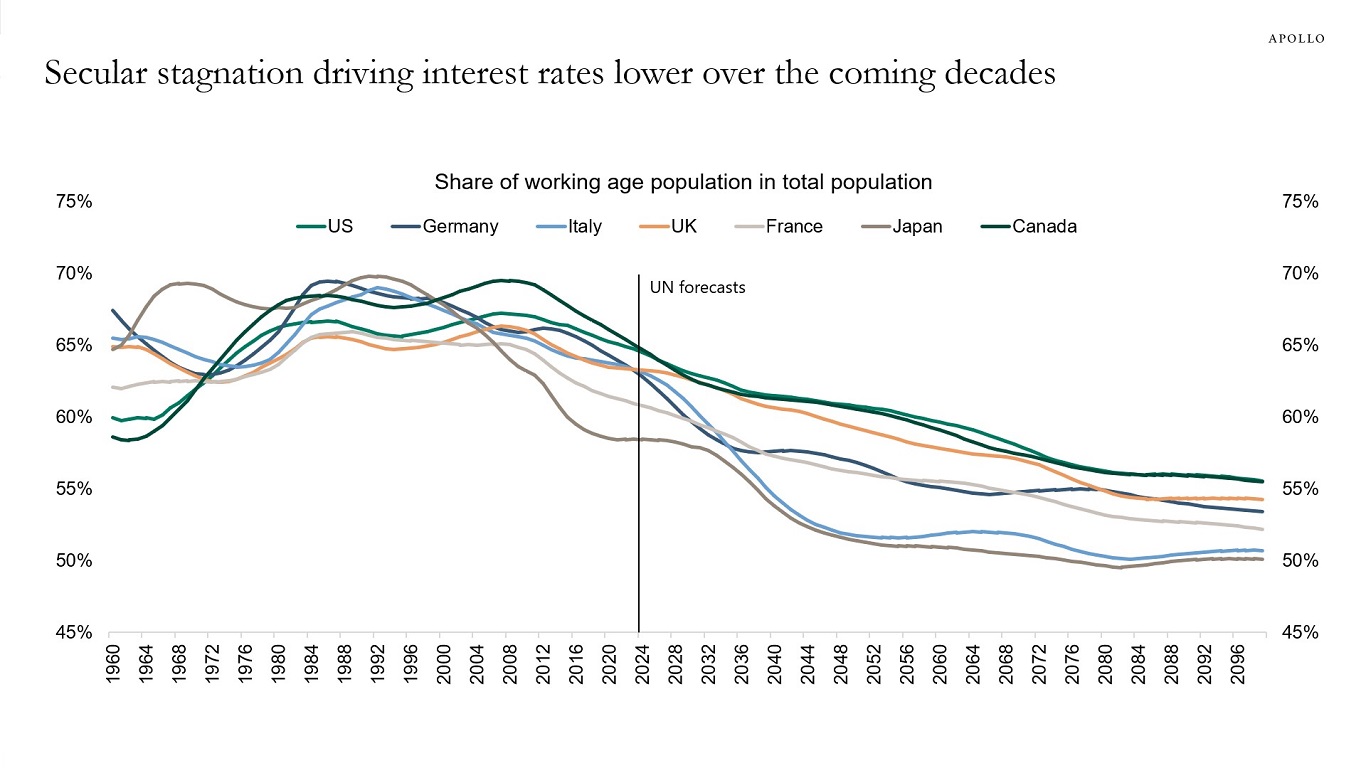
Demographic trends will weigh on inflation over the coming decades, but the secular stagnation forces pulling inflation down are currently being offset by upward pressures on inflation coming from deglobalization, energy transition, defense spending, restrictions on immigration, easy financial conditions, and easy fiscal policy.
Put differently, the structural forces pushing inflation down are currently being offset by cyclical forces putting upward pressure on inflation.
That’s the reason why interest rates will not only be higher for longer in the short term but also in the longer term, see also the second chart, which shows that the market is currently pricing that the Fed funds rate will be between 4% and 5% over the coming years.
Source: UN Population statistics, Haver Analytics, Apollo Chief Economist 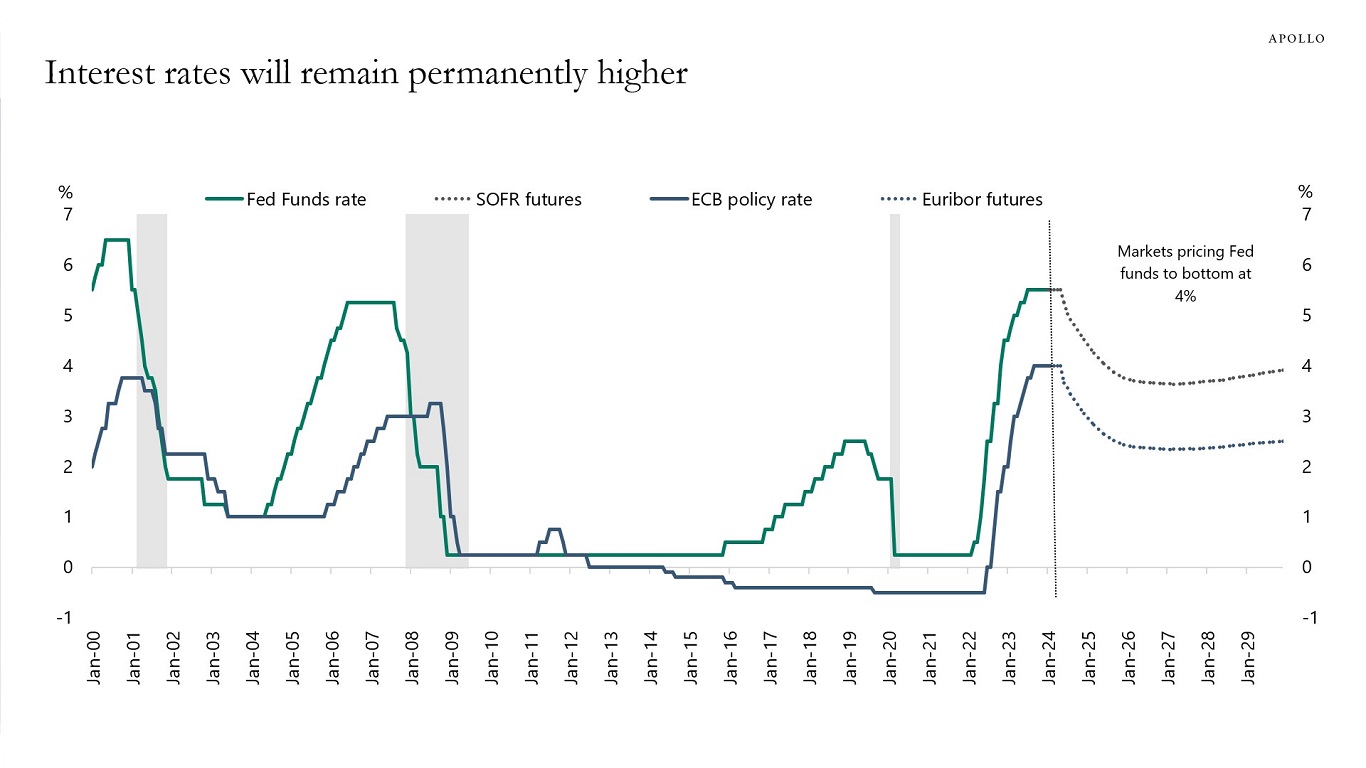
Source: Bloomberg, Apollo Chief Economist See important disclaimers at the bottom of the page.
-
The key reasons why supercore inflation remains high are auto insurance and hospital services, and it is a legitimate question to ask whether the Fed keeping interest rates higher for longer will slow down inflation in those two categories, see chart below.
The problem with that logic is that housing inflation is also high, and if the Fed were to lower interest rates, it would put new upward pressure on the demand-driven components of CPI, including housing inflation, airfares, hotel prices, restaurant prices, etc.
The bottom line is that if the Fed, instead of focusing on the overall CPI index, decides to put less weight on housing inflation, auto insurance, and hospital services, it runs the risk that Fed communication about what is important and what is not important becomes very difficult. This challenge is particularly difficult when the Fed is already being asked why it puts no weight on inflation in food and energy.

Source: BLS, Bloomberg, Apollo Chief Economist See important disclaimers at the bottom of the page.
-
Having a flexible labor market where it is easy to hire and fire workers increases potential growth and resilience to shocks. The US has the most flexible labor market among all OECD countries, see the chart below.
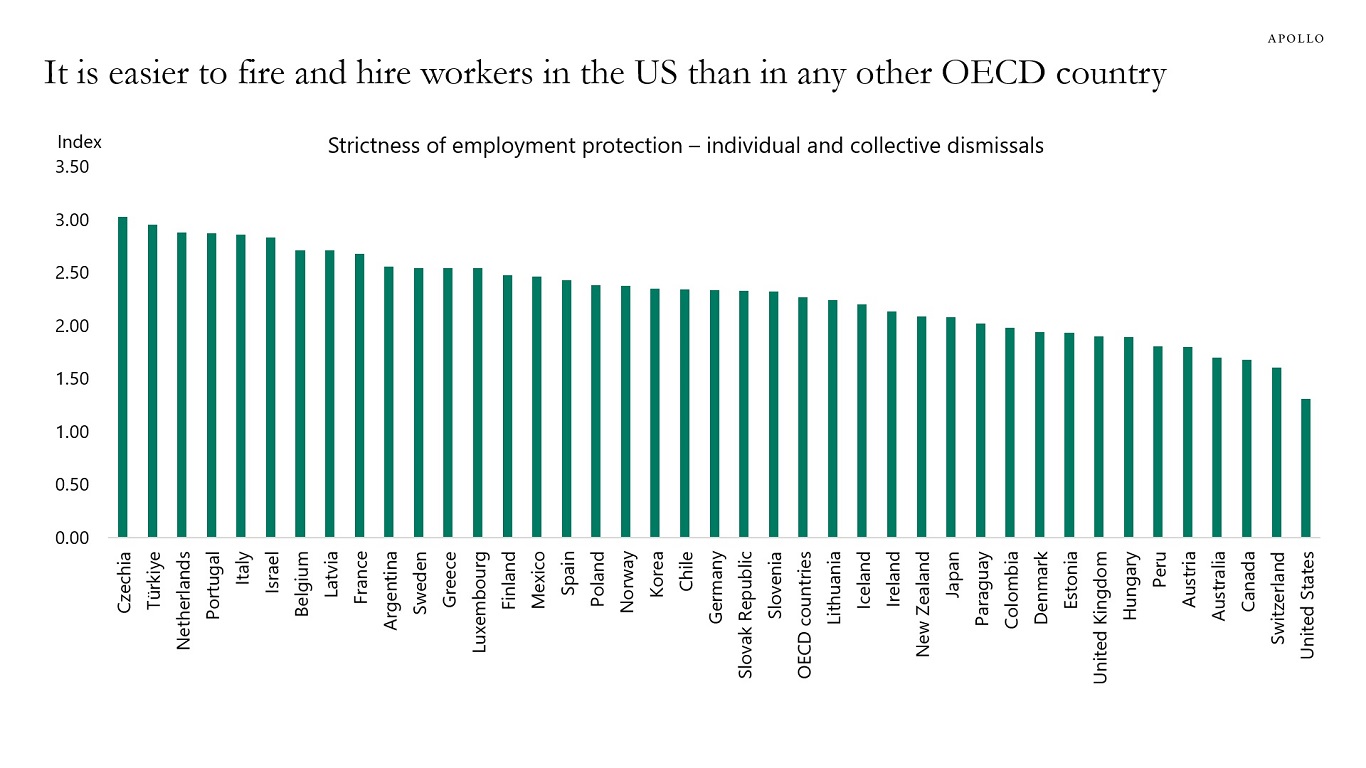
Source: OECD, Apollo Chief Economist. Note: The OECD indicators of employment protection are synthetic indicators of the strictness of regulation on dismissals and the use of temporary contracts. For each year, indicators refer to regulation in force on the first of January. Strictness of employment protection against individual and collective dismissals for workers with a regular contract is the weighted sum of sub-indicators concerning the regulations for individual dismissals (weight of 5/7) and provisions for collective dismissals (2/7). It incorporates 23 detailed data items. See important disclaimers at the bottom of the page.
-
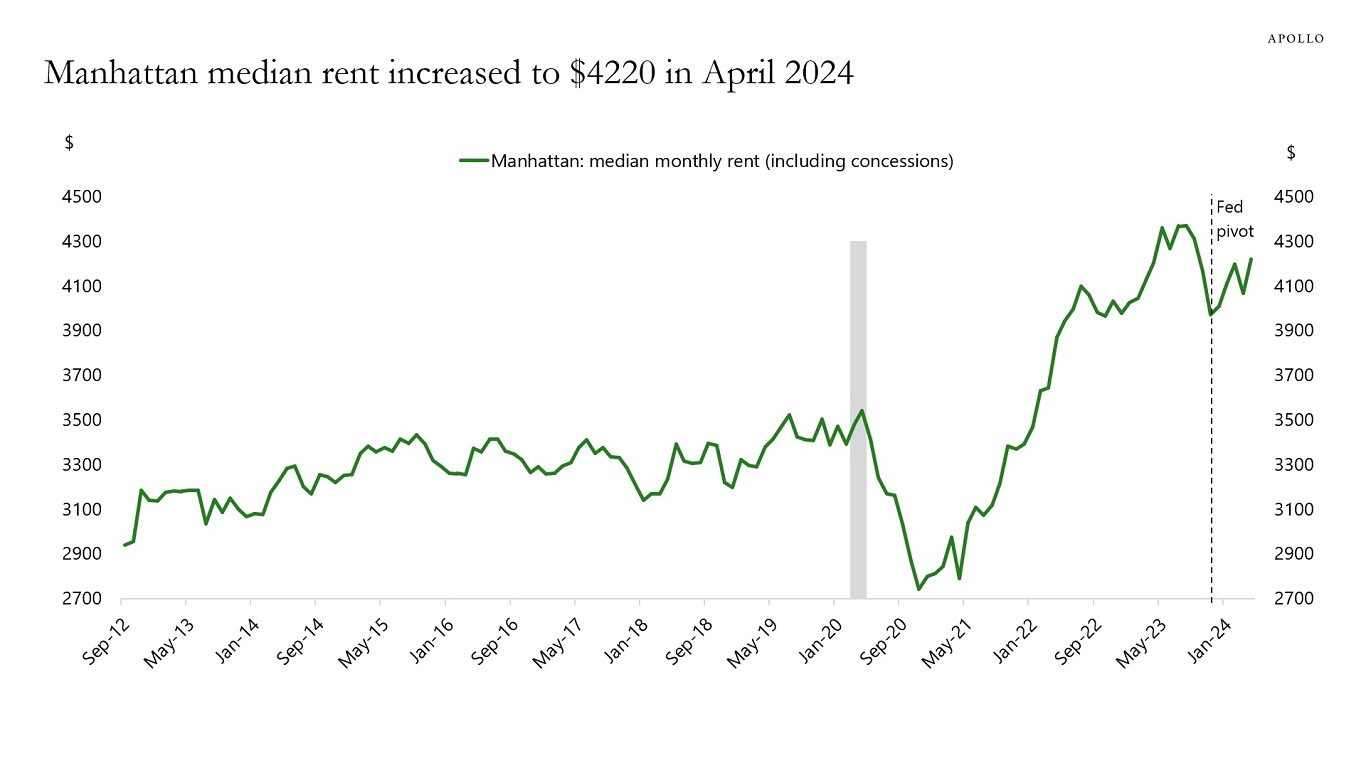
After the Fed pivot in November 2023, lower mortgage rates, rising stock prices, and increased activity in capital markets have put upward pressure on rents in Manhattan, see the first chart below.
Over the same period, easy financial conditions have boosted the housing market, with home prices currently up 7.3% over the past 12 months.
With this backdrop, the risks are rising that shelter inflation may begin to flatten out over the coming months and maybe even rise later this year, see the second chart.
The Fed will have to keep interest rates higher for longer to prevent housing inflation from becoming a problem again.
Source: Elliman, Apollo Chief Economist 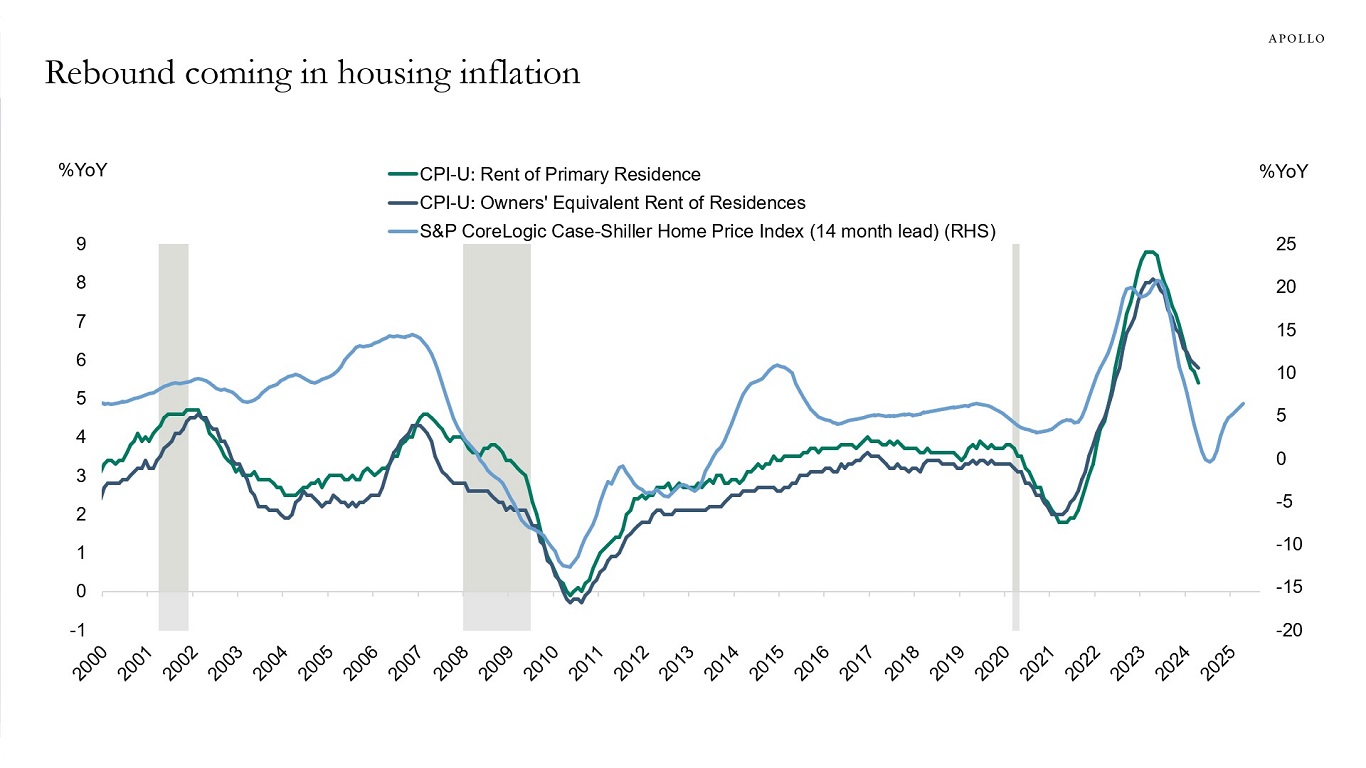
Source: Haver Analytics, BLS, S&P, Apollo Chief Economist See important disclaimers at the bottom of the page.
-
Weekly data for consumer spending continues to show no signs of a slowdown in private consumption, see chart below.
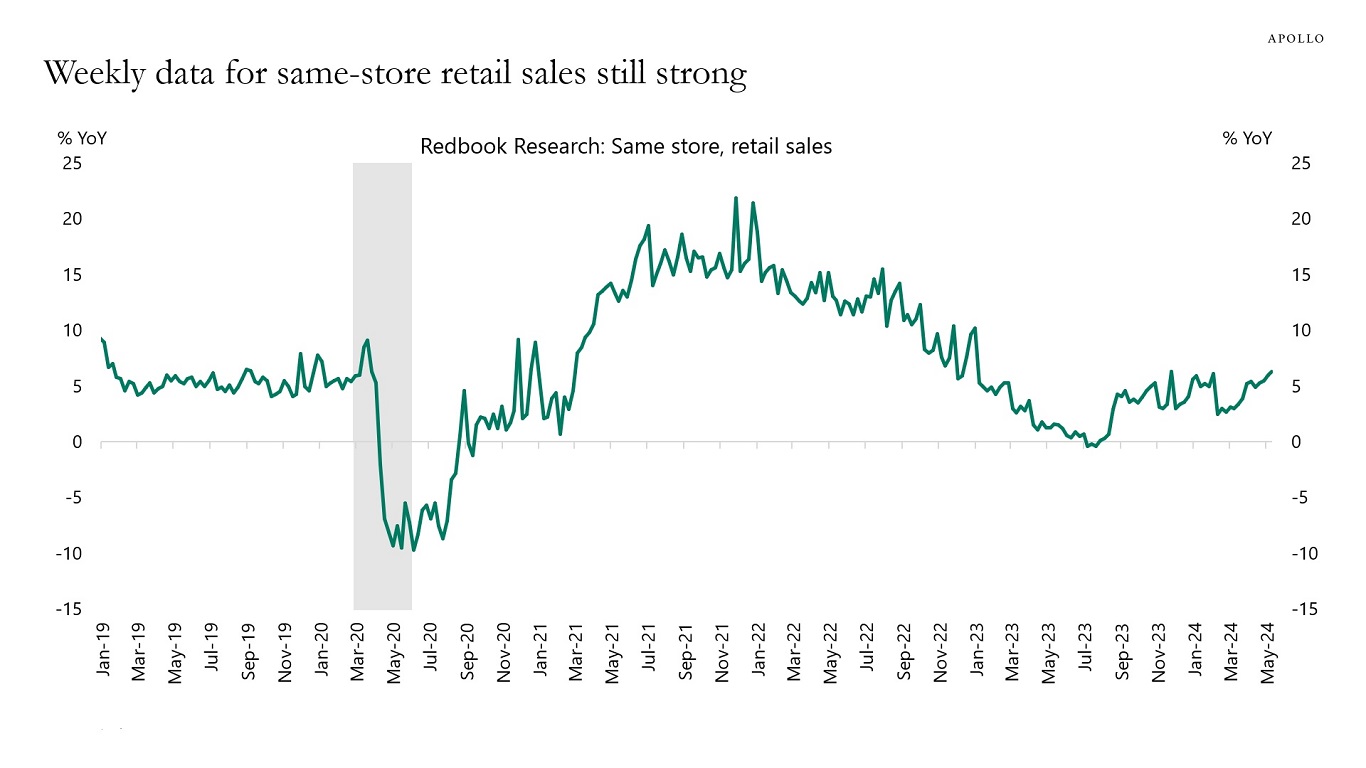
Source: Redbook, Bloomberg, Apollo Chief Economist See important disclaimers at the bottom of the page.
-
Most of the time in financial markets is spent on discussing Apple, Tesla, and Coca-Cola, but these firms and the rest of the S&P 500 companies only make up a very small part of the US economy, see our chart book available here.
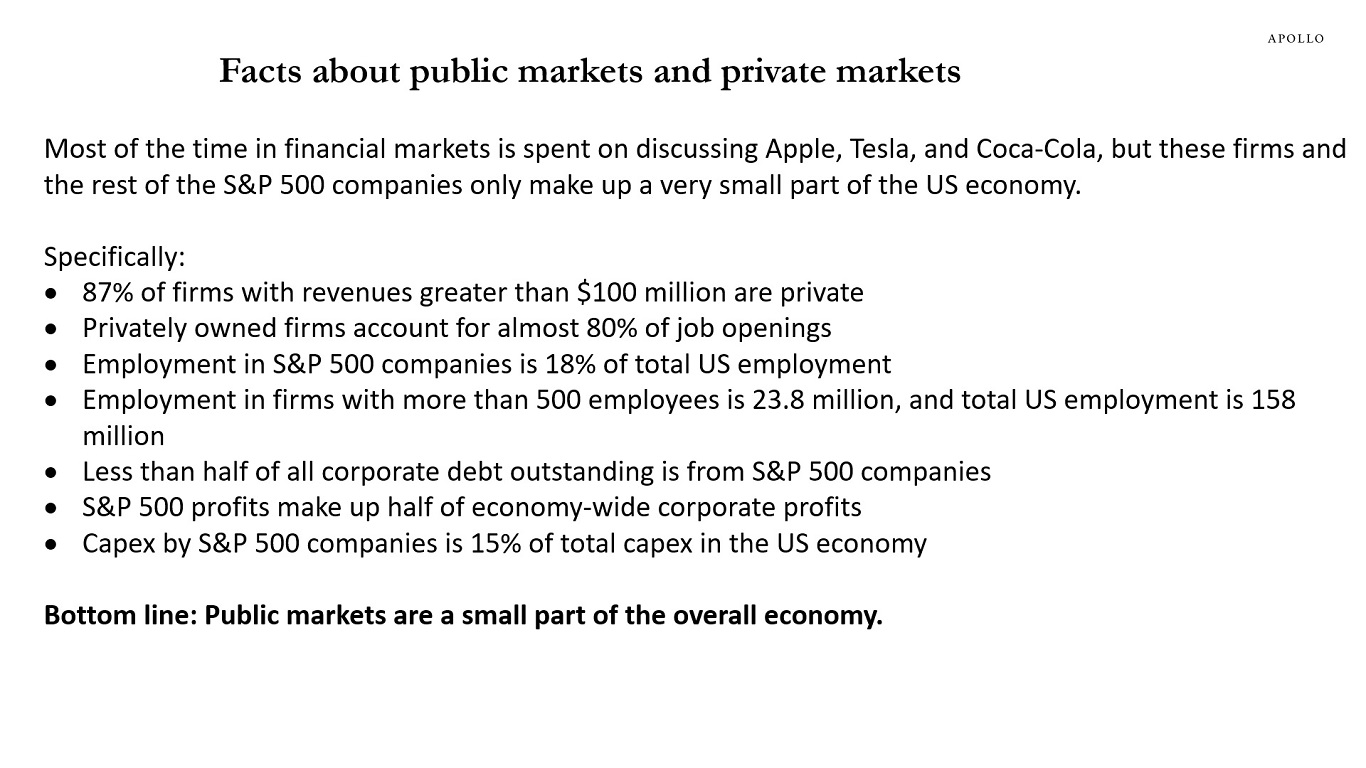
See important disclaimers at the bottom of the page.
-
Copper prices are rising due to supply shortages, hedge fund speculation, China demand, AI demand, and green energy demand. For more, see our chart book available here.

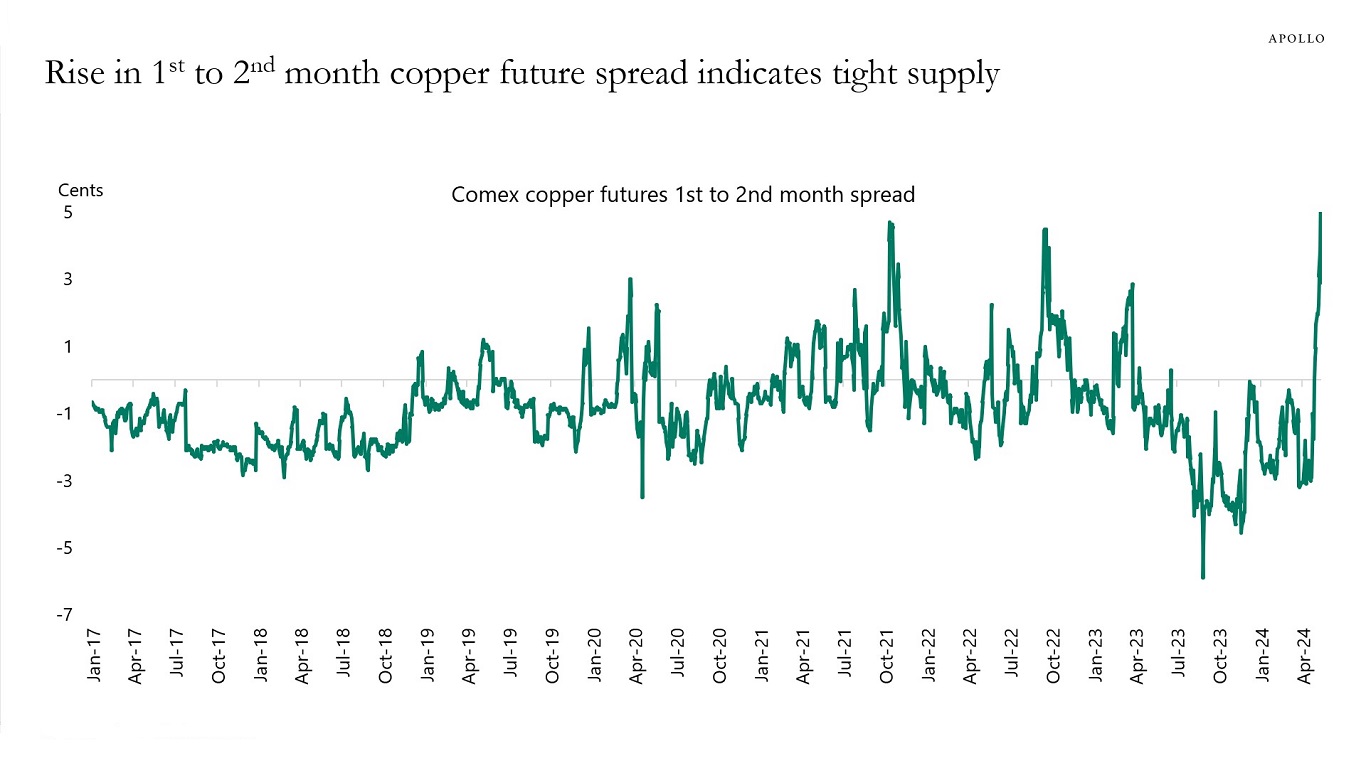
Source: Bloomberg, Apollo Chief Economist See important disclaimers at the bottom of the page.
-
The share of the population that owns their home varies across the G7 countries, with a homeownership rate in Germany at 41%, in the US at 65%, and in Italy 73%, see chart below.
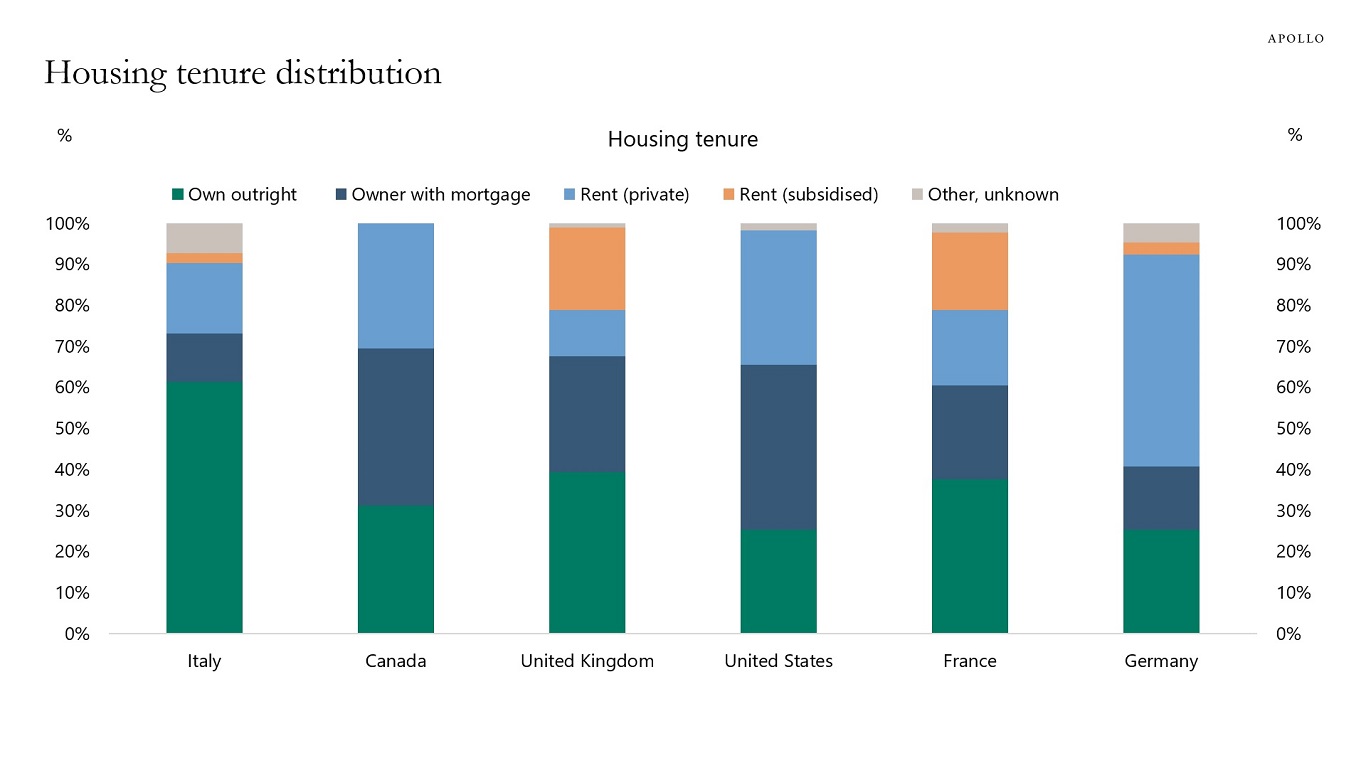
Source: OECD, Apollo Chief Economist. Note: 2022 or latest year available. See important disclaimers at the bottom of the page.
-
In Japan, the population is shrinking, and, as a result, the number of vacant homes is rising, see chart below.
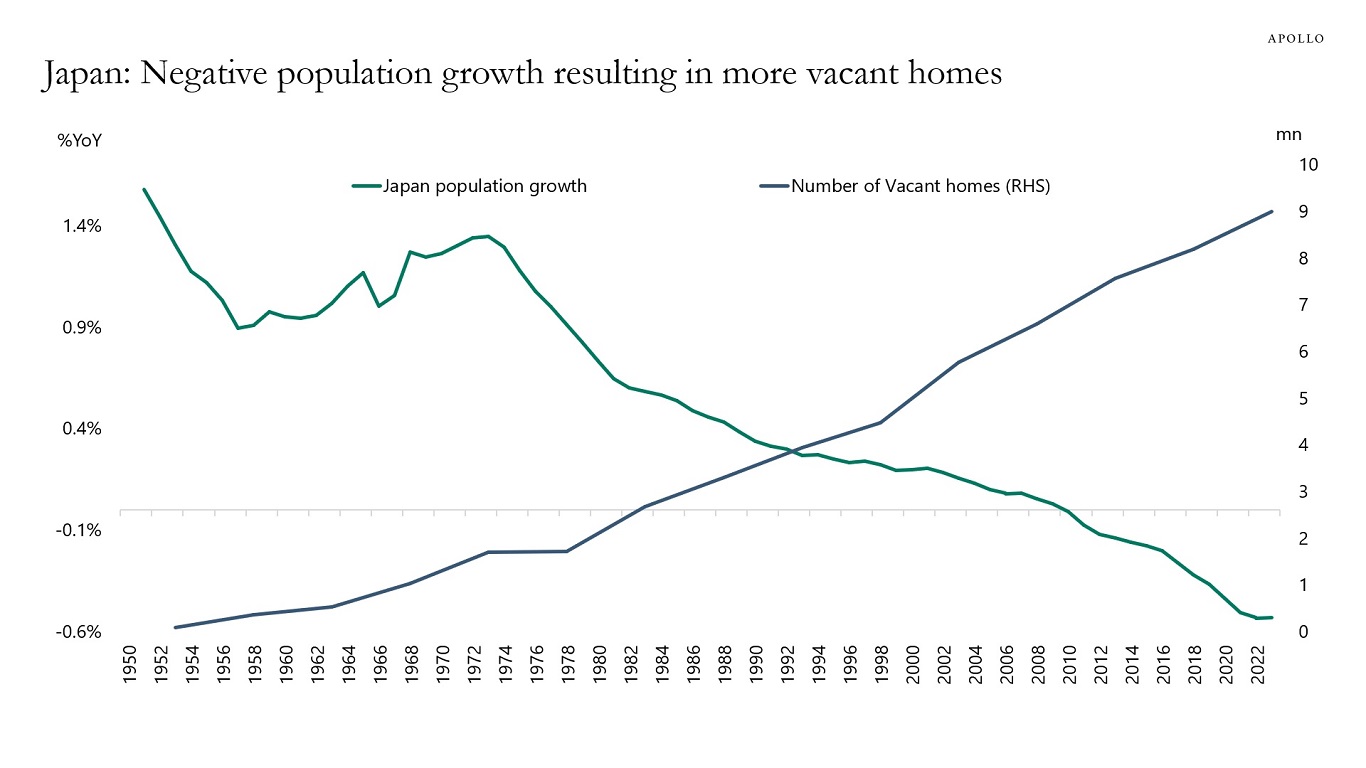
Source: UN Population Statistics, Housing and Land Survey Japan, Apollo Chief Economist See important disclaimers at the bottom of the page.

This presentation may not be distributed, transmitted or otherwise communicated to others in whole or in part without the express consent of Apollo Global Management, Inc. (together with its subsidiaries, “Apollo”).
Apollo makes no representation or warranty, expressed or implied, with respect to the accuracy, reasonableness, or completeness of any of the statements made during this presentation, including, but not limited to, statements obtained from third parties. Opinions, estimates and projections constitute the current judgment of the speaker as of the date indicated. They do not necessarily reflect the views and opinions of Apollo and are subject to change at any time without notice. Apollo does not have any responsibility to update this presentation to account for such changes. There can be no assurance that any trends discussed during this presentation will continue.
Statements made throughout this presentation are not intended to provide, and should not be relied upon for, accounting, legal or tax advice and do not constitute an investment recommendation or investment advice. Investors should make an independent investigation of the information discussed during this presentation, including consulting their tax, legal, accounting or other advisors about such information. Apollo does not act for you and is not responsible for providing you with the protections afforded to its clients. This presentation does not constitute an offer to sell, or the solicitation of an offer to buy, any security, product or service, including interest in any investment product or fund or account managed or advised by Apollo.
Certain statements made throughout this presentation may be “forward-looking” in nature. Due to various risks and uncertainties, actual events or results may differ materially from those reflected or contemplated in such forward-looking information. As such, undue reliance should not be placed on such statements. Forward-looking statements may be identified by the use of terminology including, but not limited to, “may”, “will”, “should”, “expect”, “anticipate”, “target”, “project”, “estimate”, “intend”, “continue” or “believe” or the negatives thereof or other variations thereon or comparable terminology.