


Want it delivered daily to your inbox?
-
Household expectations to future home price appreciation are currently at the highest level since 2007, see chart below.
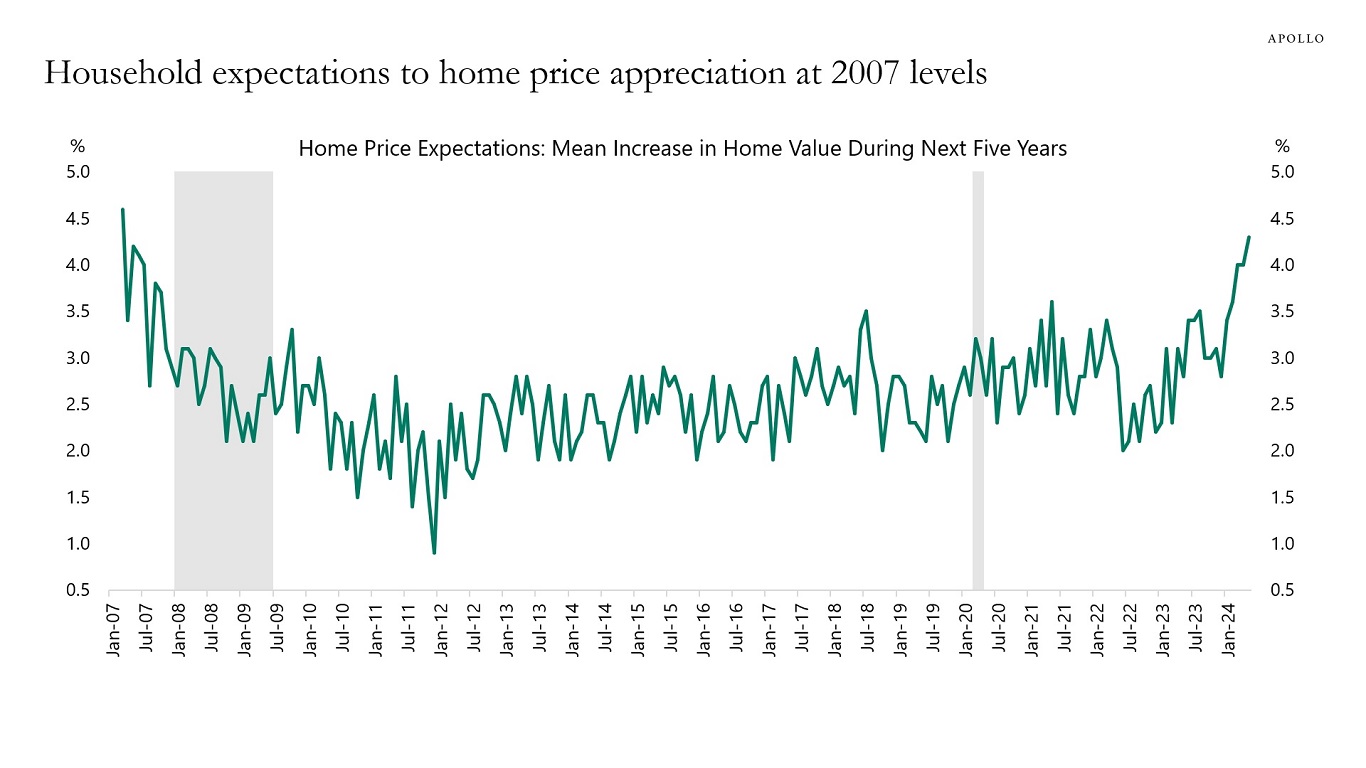
Source: University of Michigan, Haver Analytics, Apollo Chief Economist See important disclaimers at the bottom of the page.
-
US markets continue to outperform international markets, and the market cap of the S&P 500 is currently the biggest share of the global market cap in decades, see chart below.
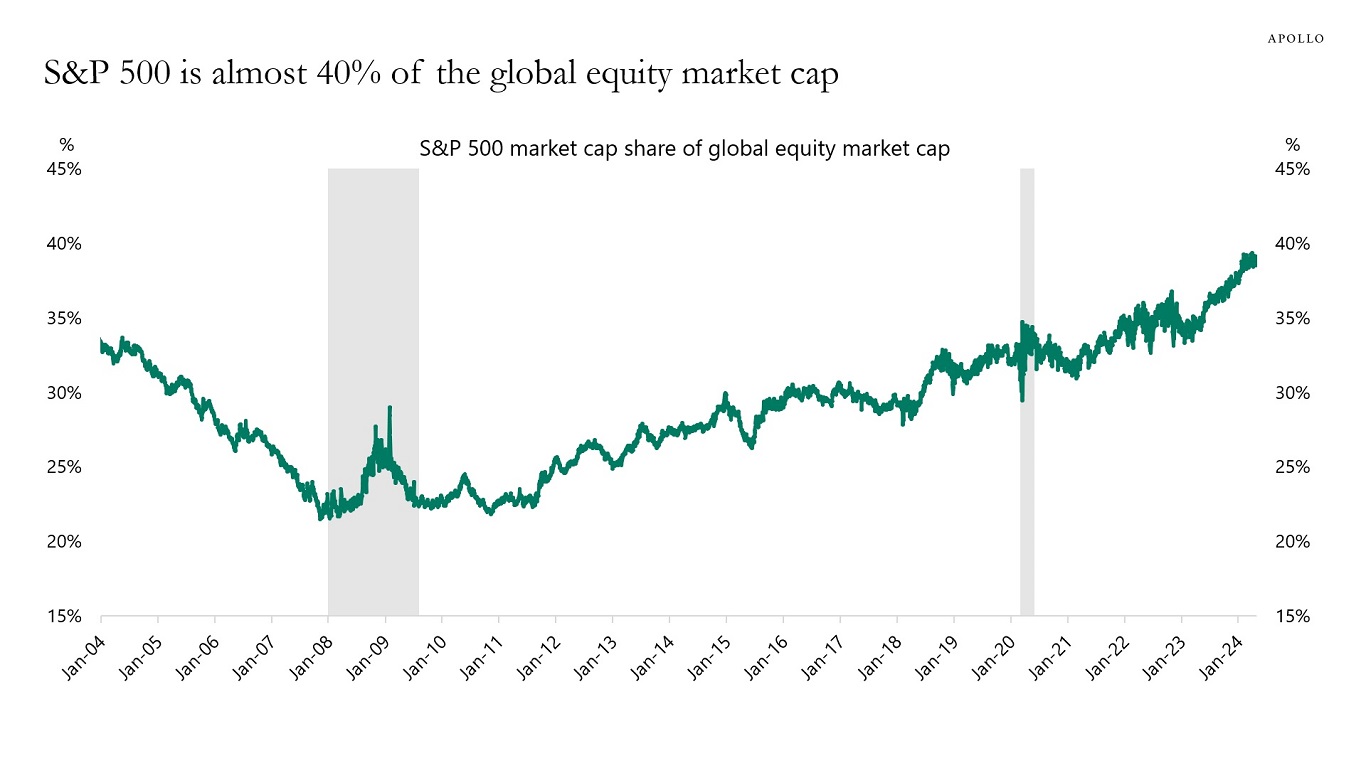
Source: Bloomberg, Apollo Chief Economist See important disclaimers at the bottom of the page.
-
The transmission mechanism of monetary policy is weaker because a rising share of US homes don’t have a mortgage, and about half of all mortgages have an interest rate locked in below 4%, see charts below.
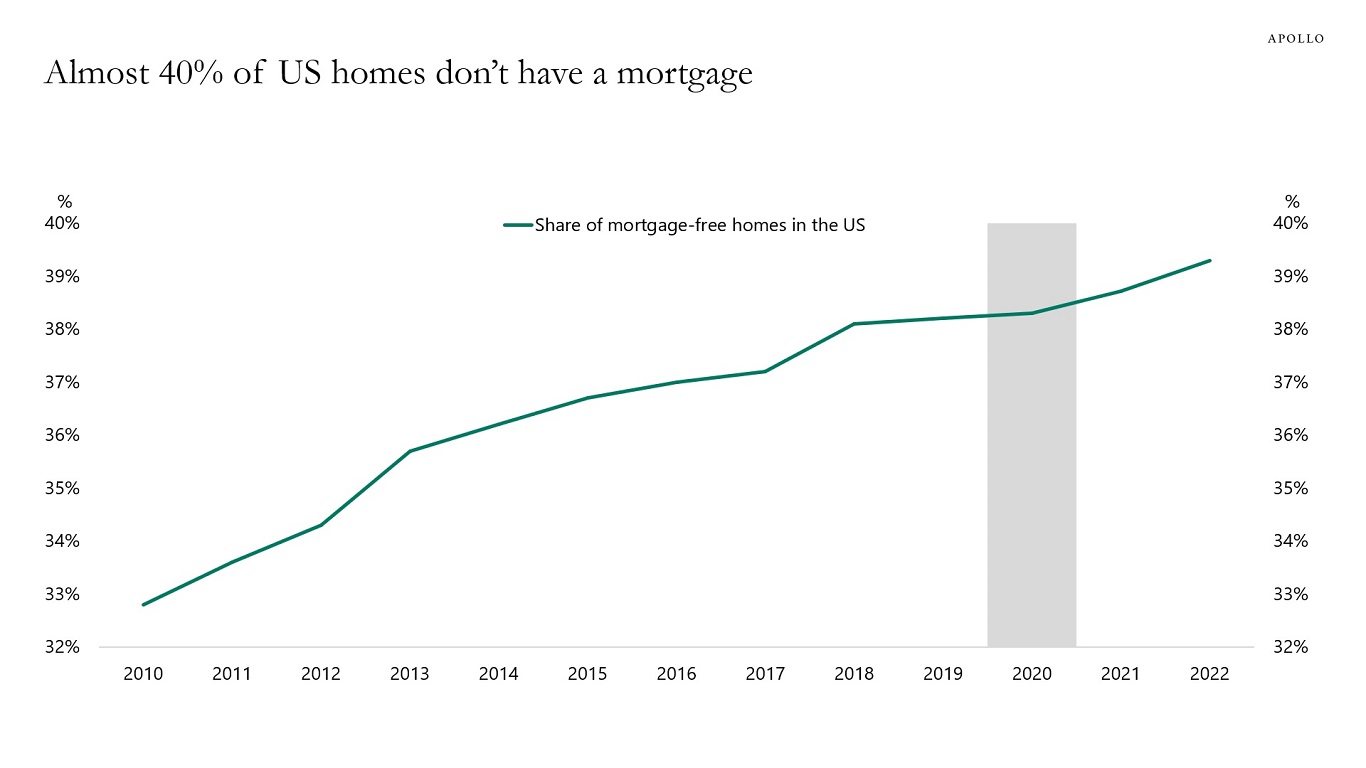
Source: US Census Bureau, Bloomberg, Apollo Chief Economist 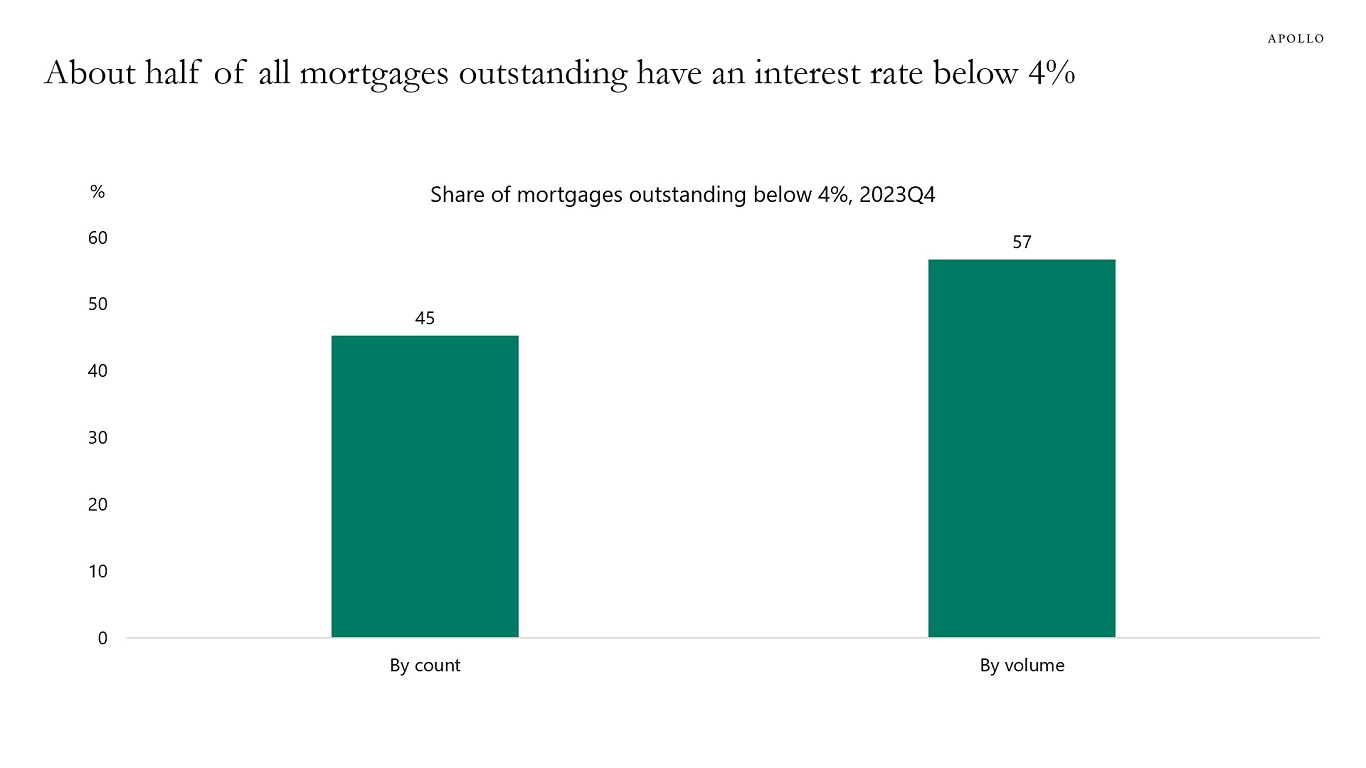
Source: FHFA, Apollo Chief Economist See important disclaimers at the bottom of the page.
-
See important disclaimers at the bottom of the page.
-
The rising market share of private credit is not coming from banks, it is coming from investment grade markets, high yield markets, and leveraged loan markets, see chart below.
A financial system with more sources of financing for firms has two macroeconomic benefits.
First, the more choices firms have when they need financing, the better. A more diversified financial system with competition between credit providers is better for economic growth, particularly when some players, such as banks, have high leverage and uncertainty about deposits as their source of financing.
Second, having different types of financing available creates more financial stability as more participants can stabilize the financial system and provide credit or buy equity in case of a sudden change in sentiment in financial markets or the economy.
The bottom line is that:
1) The growth in private credit is giving firms in need of financing more choice and thereby boosting long-run growth, and
2) The growth in private markets is improving financial stability with more capital willing to step in when there is distress.
For more discussion see also this OECD working paper and this IMF working paper.
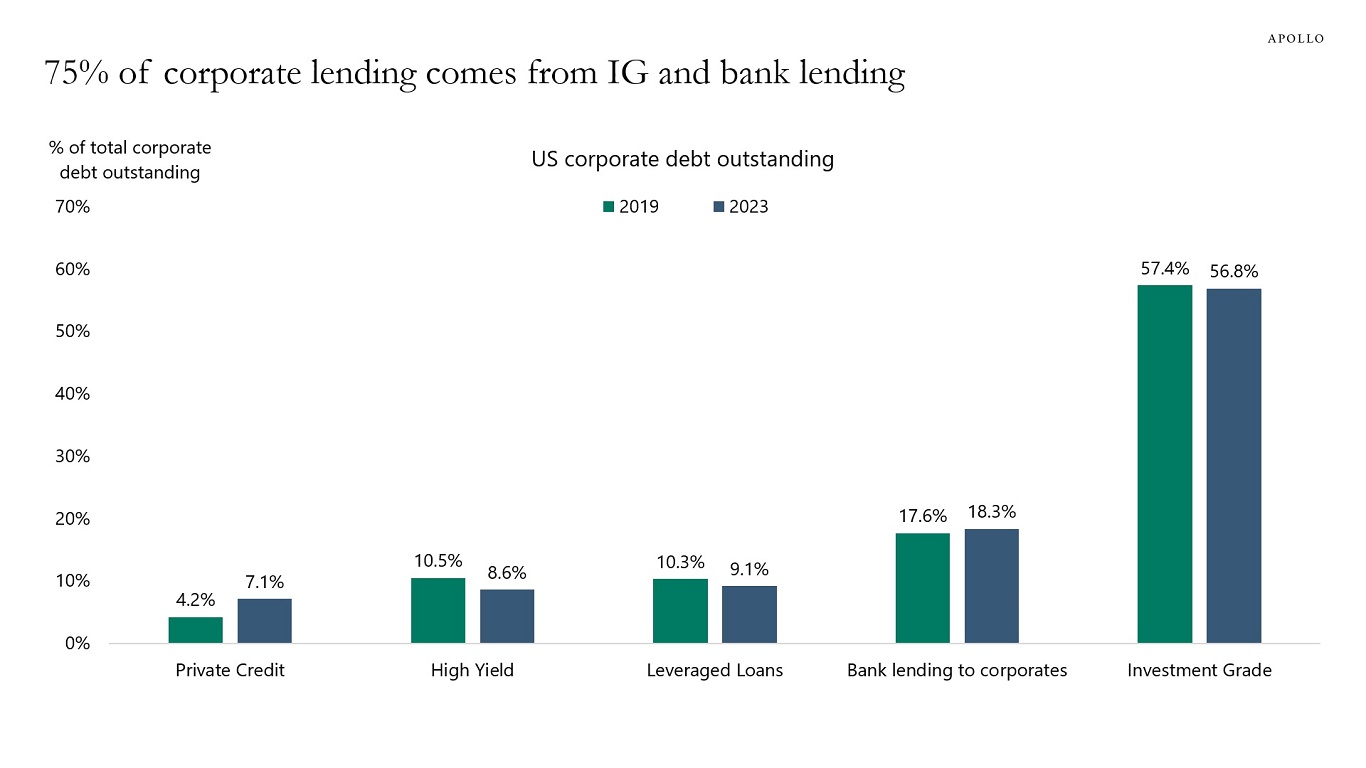
Source: Preqin, ICE BofA, FRB, PitchBook LCD, Apollo Chief Economist See important disclaimers at the bottom of the page.
-
Forty-one percent of companies in the Russell 2000 have negative earnings, see the first chart.
With this backdrop, it is unsurprising that Fed hikes have a more negative impact on small-cap and middle-market companies than on large-cap companies, see the second chart.
The negative impact can be felt in particular in tech, enterprise software, venture capital, and similar firms with no earnings and no revenue.
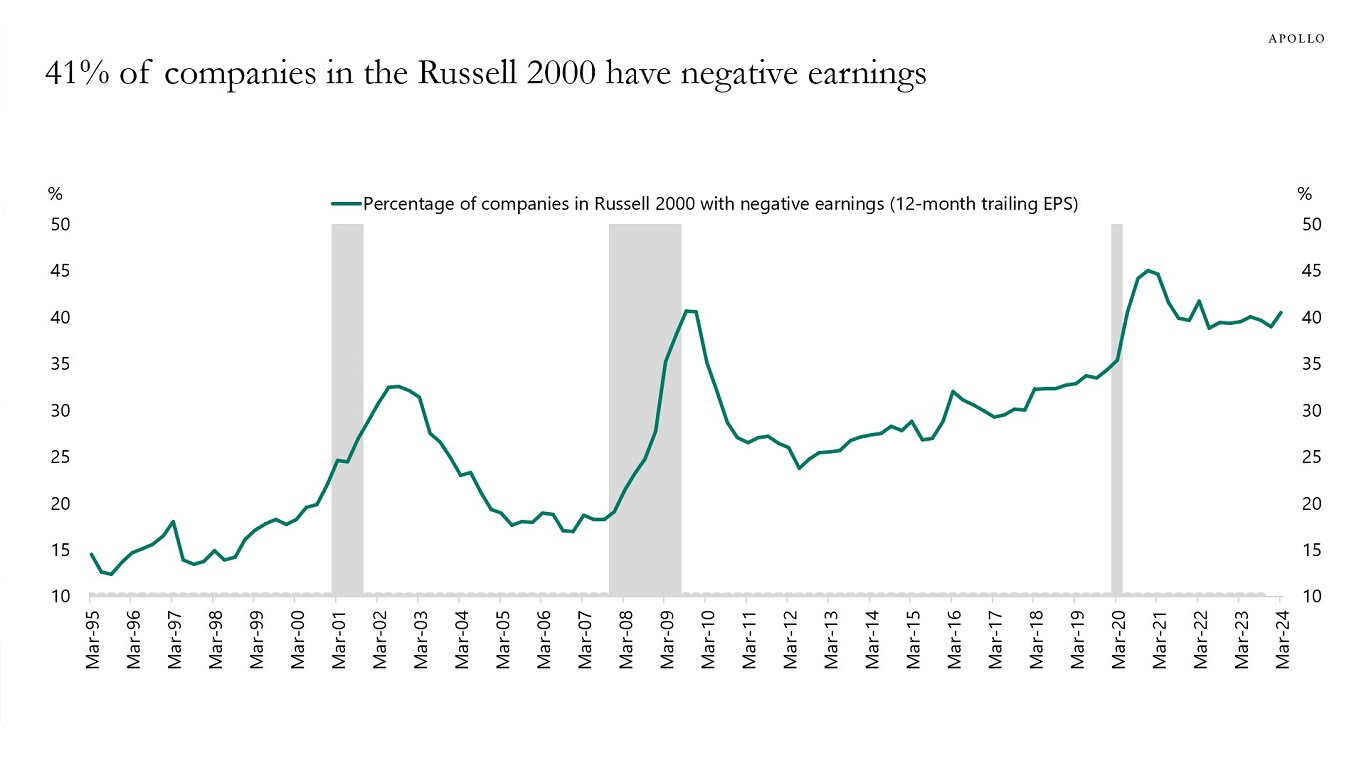
Source: Bloomberg, Apollo Chief Economist 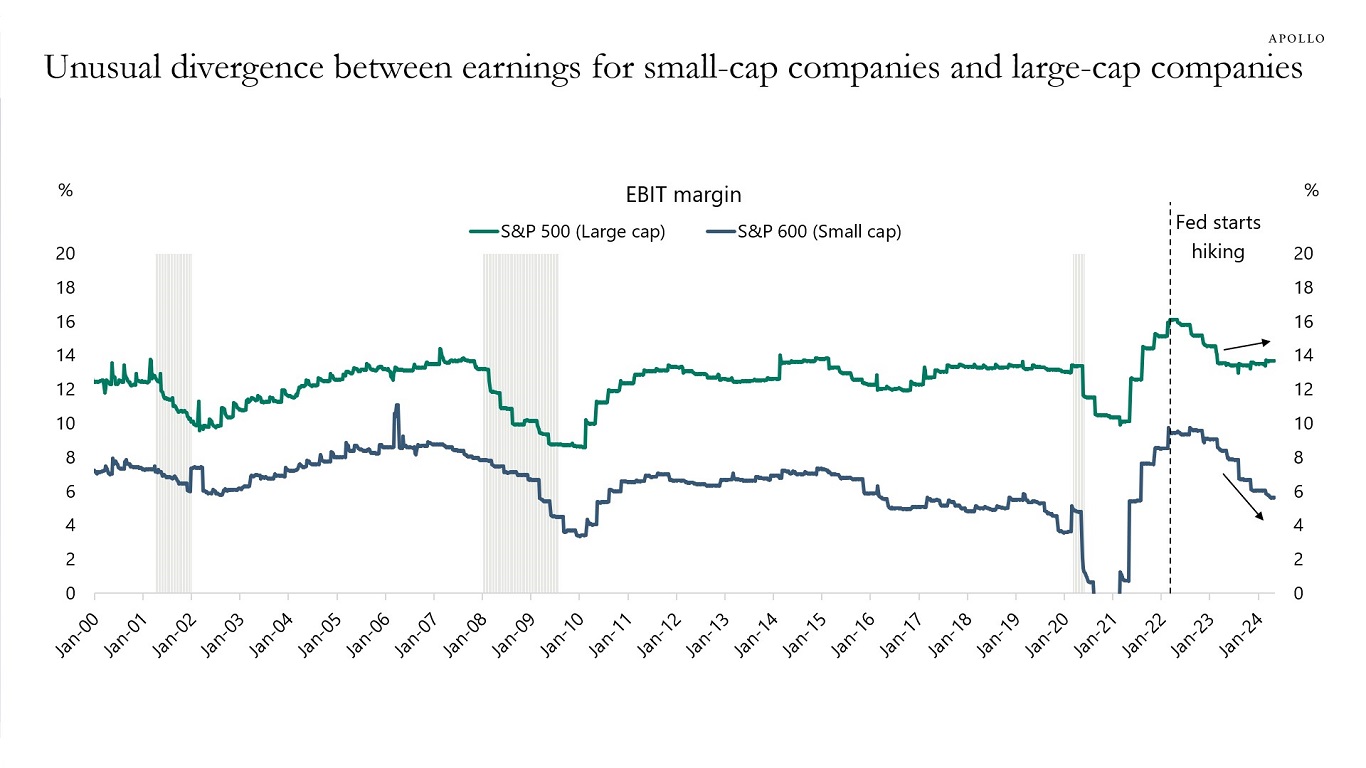
Source: Bloomberg, Apollo Chief Economist See important disclaimers at the bottom of the page.
-
The share of tech jobs in California has been declining and the share of tech jobs in Texas has been rising, see chart below.
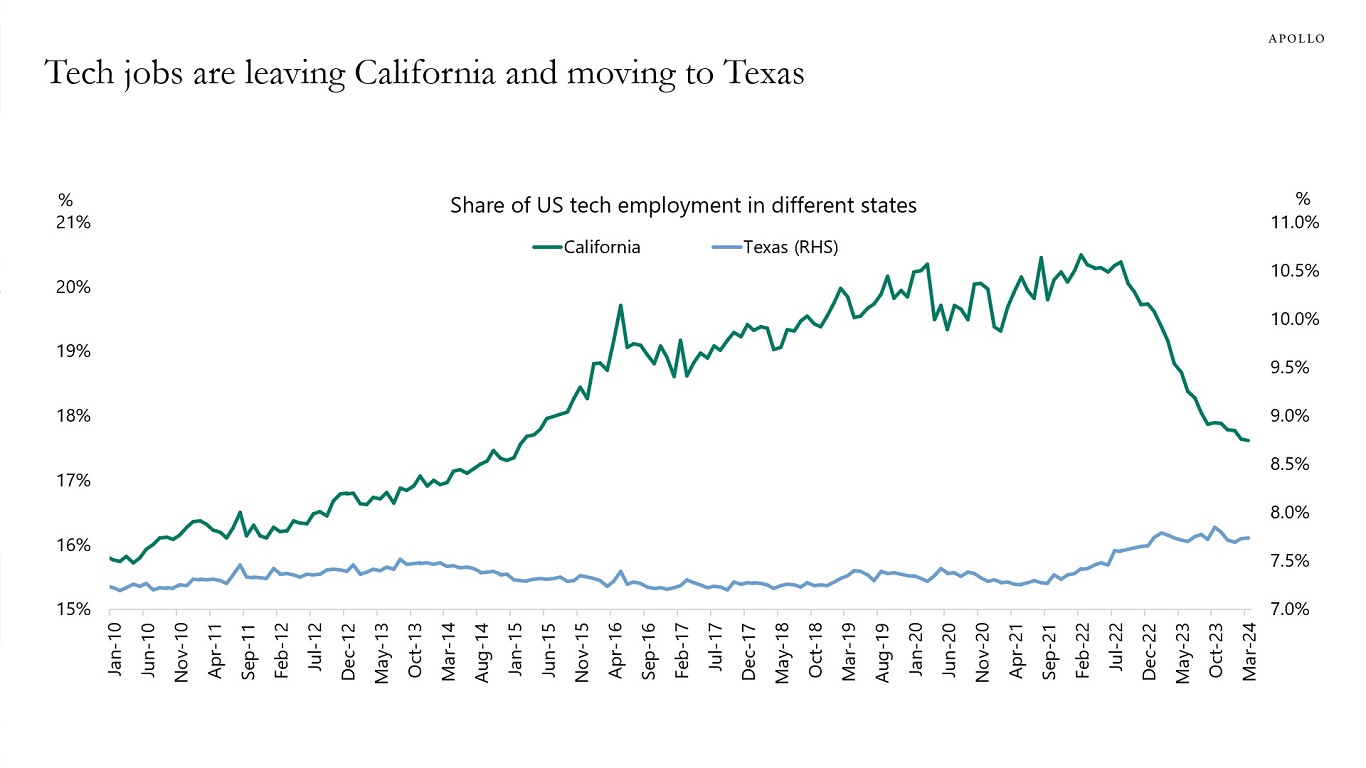
Source: BLS, Haver Analytics, Apollo Chief Economist. Note: Tech includes telecommunication, data processing, hosting and related services and other IT services, publishing industries, motion picture and sound recording industries, and broadcasting. See important disclaimers at the bottom of the page.
-
The December Fed pivot triggered a boom in dividend recaps, see chart below.
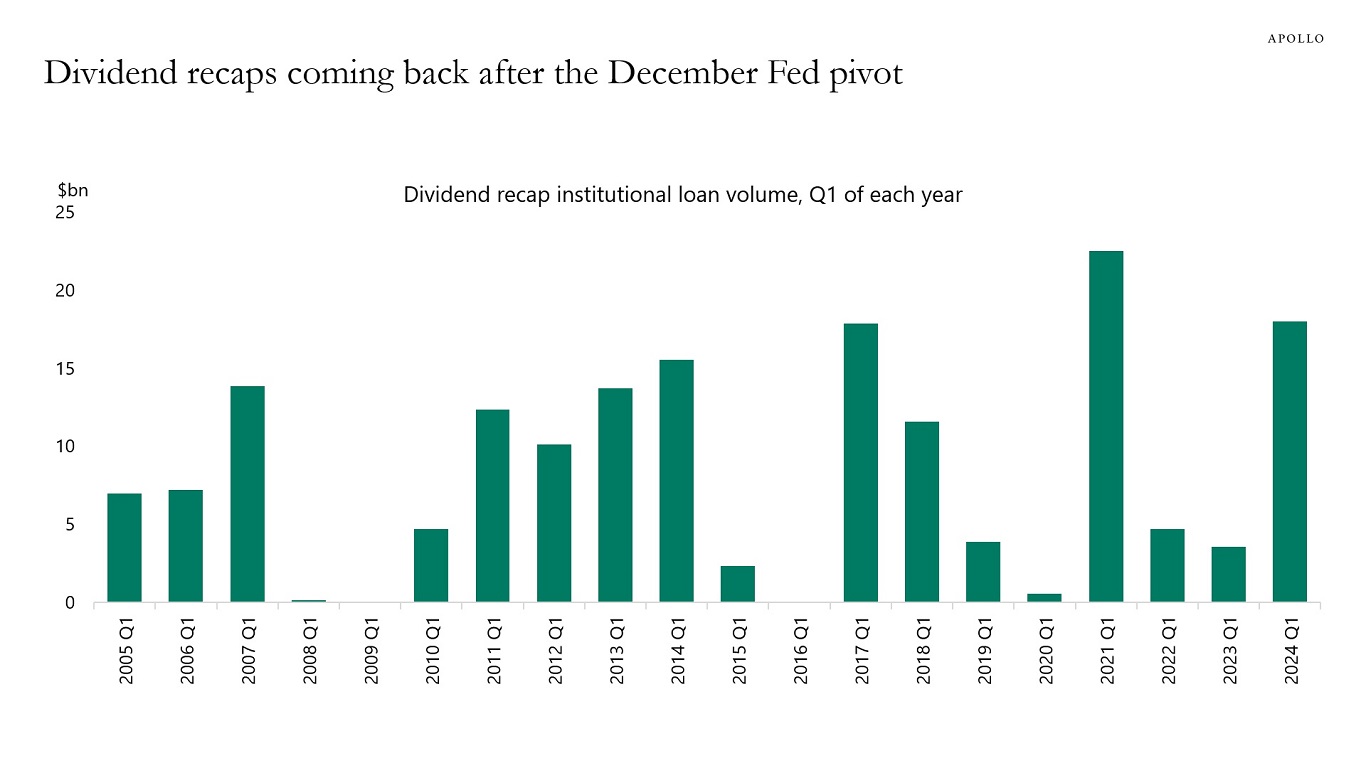
Source: PitchBook LCD, Apollo Chief Economist See important disclaimers at the bottom of the page.
-
The Fed started publishing the dot plot in 2012, and comparing the Fed’s forecasts with the forecasts from Fed funds futures yields three important conclusions, see charts below:
1) The Fed’s and the market’s forecasts about the future path of the Fed funds rate are almost always wrong.
2) The forecasts are very similar, and the Fed has managed to anchor market expectations about where it thinks the Fed funds rate is going.
3) The direction of the forecasting mistake is always identical, suggesting that the market is taking its cue about the future path of interest rates from the Fed’s dot plot.
The good news is that the Fed is able to anchor market expectations, and thereby reduce volatility in financial markets.
The bad news is that when the Fed’s forecast is wrong and the FOMC has to move from three cuts in 2024 to say, one cut, it will hurt Fed credibility.
The US economy’s lower interest-rate sensitivity, combined with strong structural and cyclical tailwinds to growth, brings us to the conclusion that the Fed will not cut interest rates in 2024.
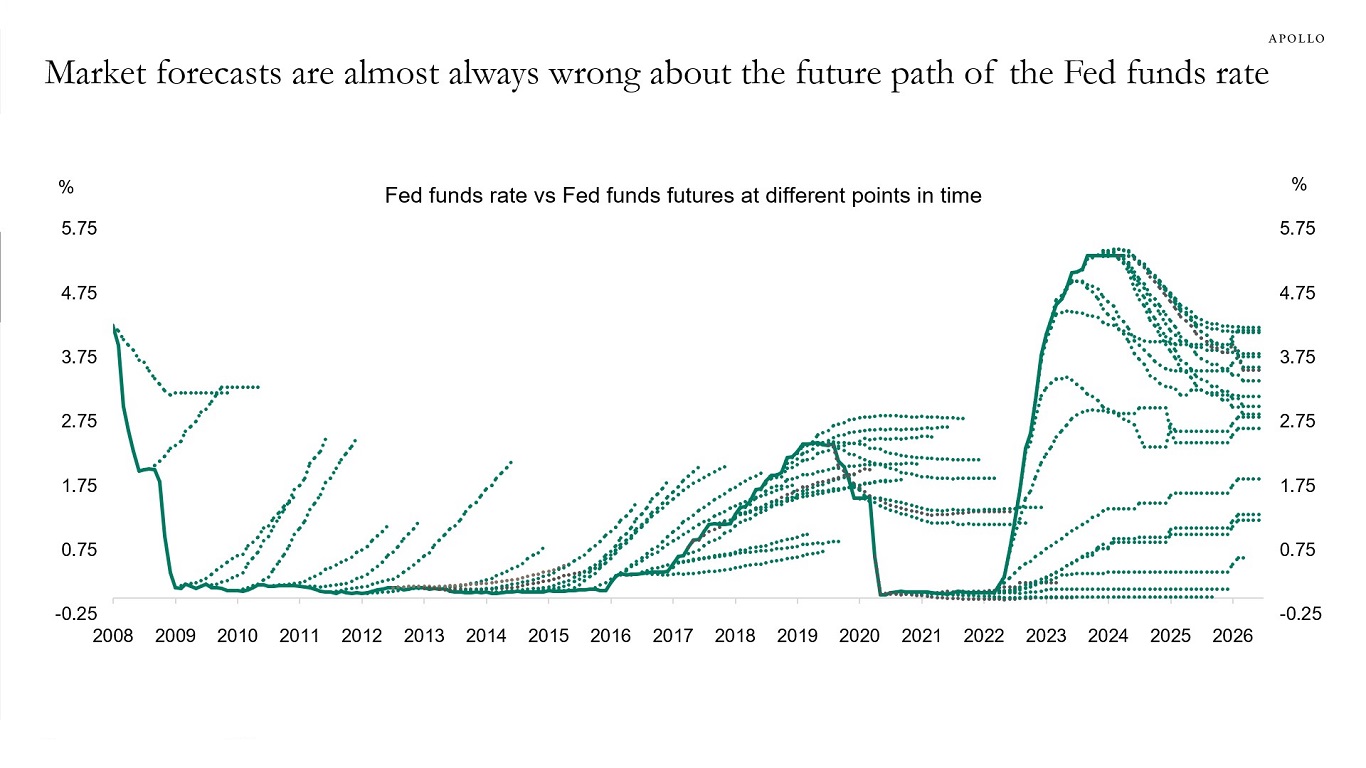
Source: Bloomberg, Apollo Chief Economist 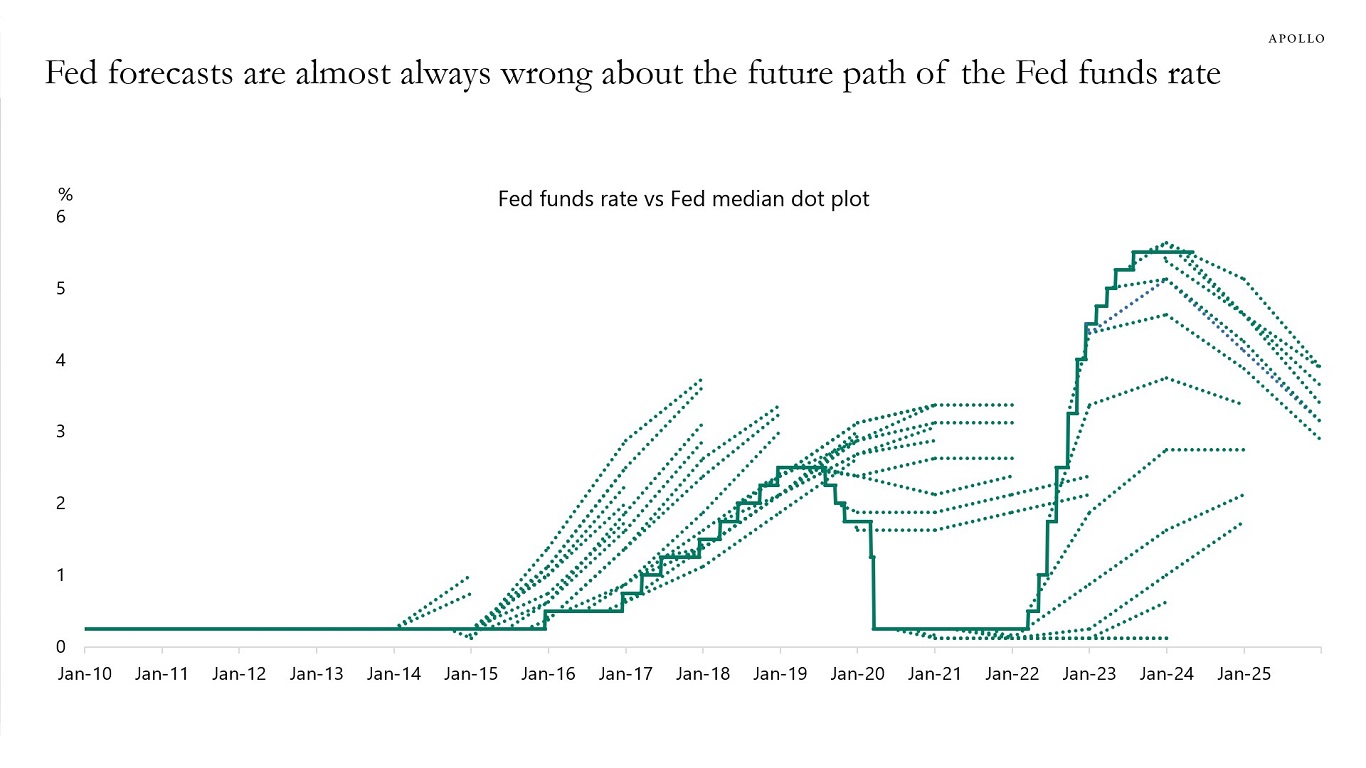
Source: FOMC, Bloomberg, Apollo Chief Economist See important disclaimers at the bottom of the page.
-
The sources of yen depreciation are the Fed keeping rates higher for longer, the BoJ keeping rates lower for longer, and worries about what higher Japanese interest rates mean for fiscal sustainability.
For more, see also our chart book available here.
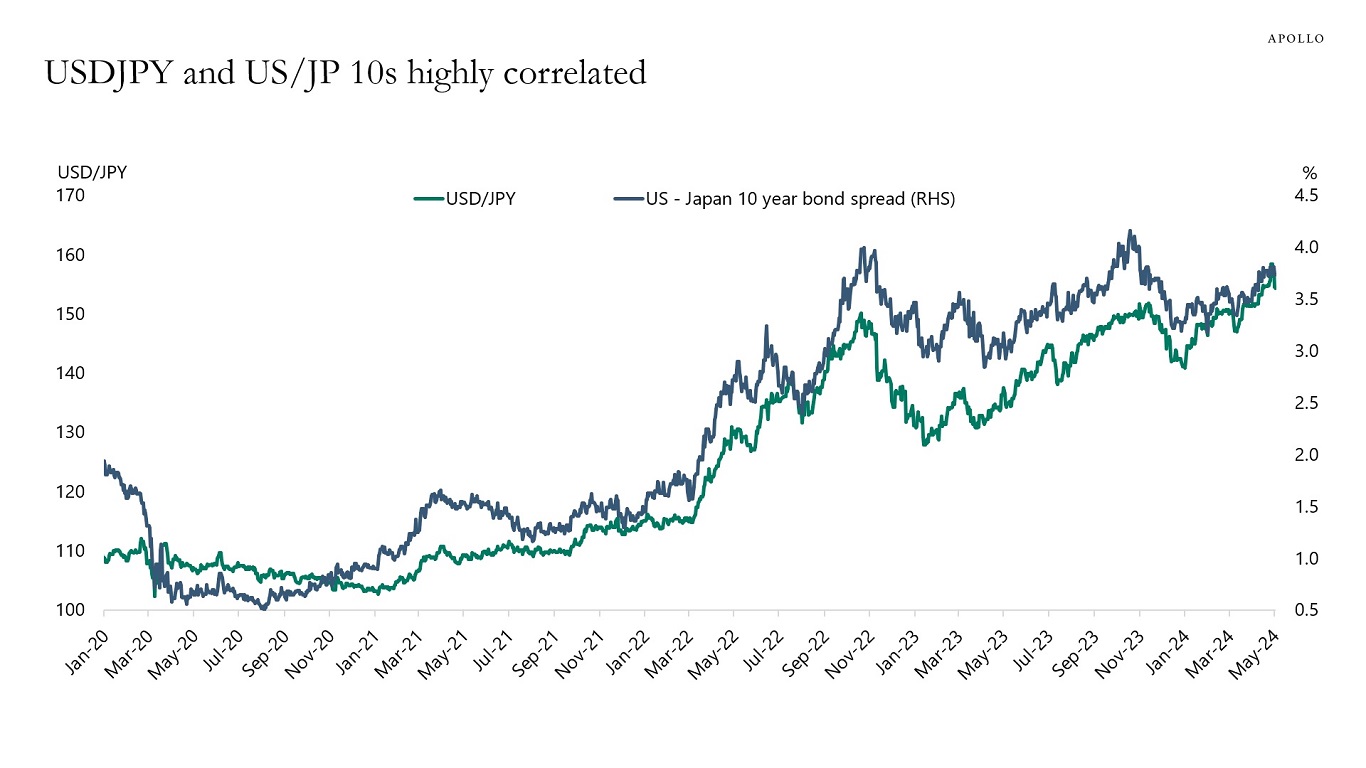
Source: Bloomberg, Apollo Chief Economist 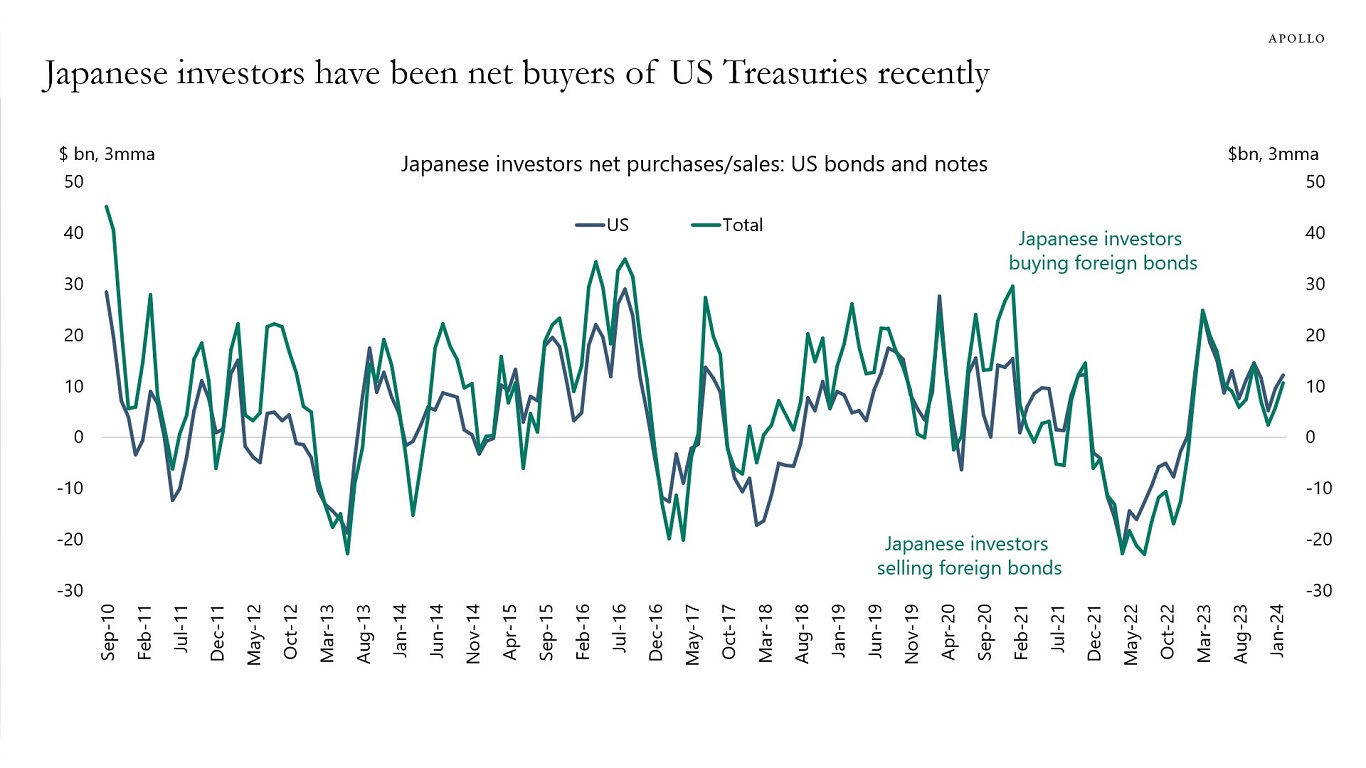
Source: Ministry of Finance Japan, Bloomberg, Apollo Chief Economist 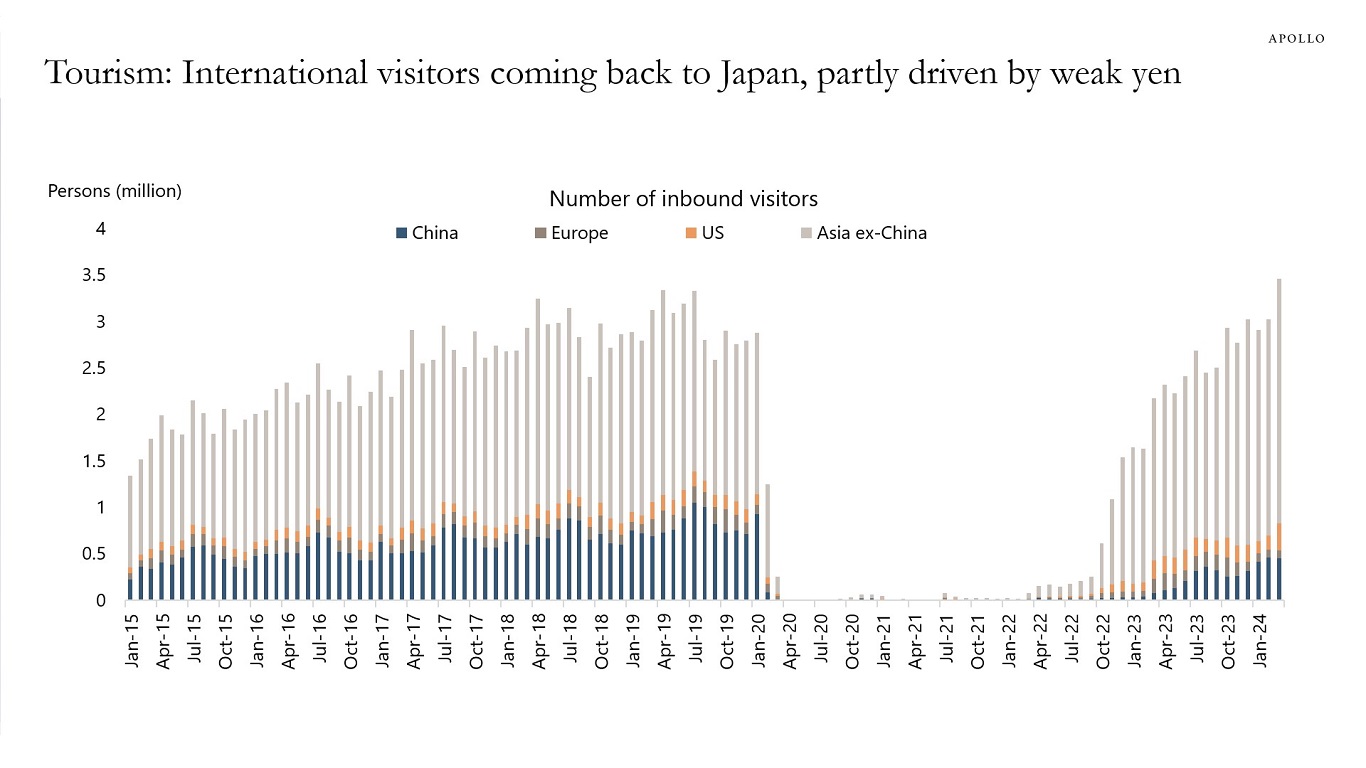
Source: Japan National Tourism Organization, Bloomberg, Apollo Chief Economist See important disclaimers at the bottom of the page.

This presentation may not be distributed, transmitted or otherwise communicated to others in whole or in part without the express consent of Apollo Global Management, Inc. (together with its subsidiaries, “Apollo”).
Apollo makes no representation or warranty, expressed or implied, with respect to the accuracy, reasonableness, or completeness of any of the statements made during this presentation, including, but not limited to, statements obtained from third parties. Opinions, estimates and projections constitute the current judgment of the speaker as of the date indicated. They do not necessarily reflect the views and opinions of Apollo and are subject to change at any time without notice. Apollo does not have any responsibility to update this presentation to account for such changes. There can be no assurance that any trends discussed during this presentation will continue.
Statements made throughout this presentation are not intended to provide, and should not be relied upon for, accounting, legal or tax advice and do not constitute an investment recommendation or investment advice. Investors should make an independent investigation of the information discussed during this presentation, including consulting their tax, legal, accounting or other advisors about such information. Apollo does not act for you and is not responsible for providing you with the protections afforded to its clients. This presentation does not constitute an offer to sell, or the solicitation of an offer to buy, any security, product or service, including interest in any investment product or fund or account managed or advised by Apollo.
Certain statements made throughout this presentation may be “forward-looking” in nature. Due to various risks and uncertainties, actual events or results may differ materially from those reflected or contemplated in such forward-looking information. As such, undue reliance should not be placed on such statements. Forward-looking statements may be identified by the use of terminology including, but not limited to, “may”, “will”, “should”, “expect”, “anticipate”, “target”, “project”, “estimate”, “intend”, “continue” or “believe” or the negatives thereof or other variations thereon or comparable terminology.