


Want it delivered daily to your inbox?
-
The US now produces more oil than Saudi Arabia and Russia, see chart below.
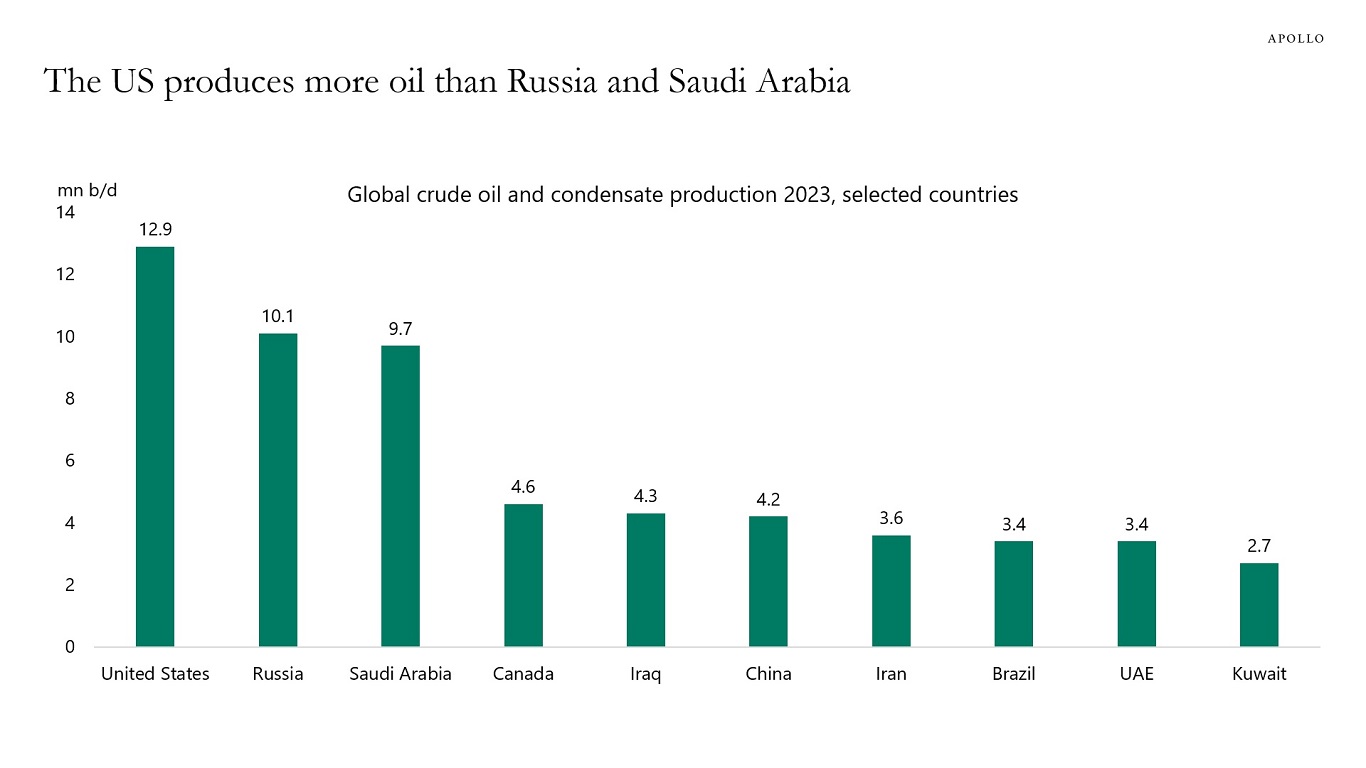
Source: EIA, International Energy Statistics, Apollo Chief Economist. Note: Rest of the world produces 22.8 million barrels per day. See important disclaimers at the bottom of the page.
-
The US has a relatively high share of domestic ownership of government bonds relative to European countries, see chart below.
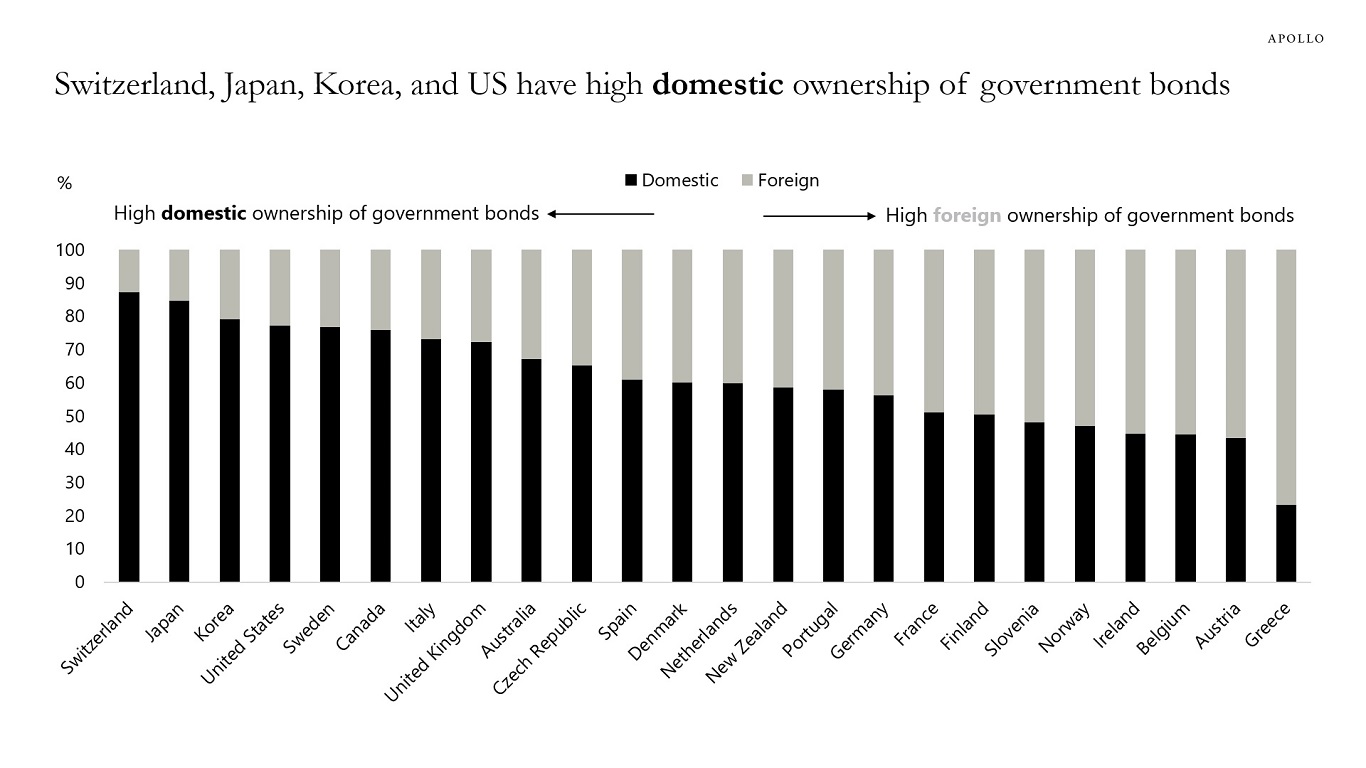
Source: IMF, Apollo Chief Economist. Note: Data as of Q2 2023. See important disclaimers at the bottom of the page.
-
The Conference Board’s consumer confidence survey asks households if they plan to travel to a foreign country, and the chart below shows that a record-high share of US consumers are planning to go on vacation to a foreign country within the next six months.
Because of the significant rise in the stock market and significant cash flows from fixed income, US households have more money to travel on airplanes, stay at hotels, eat at restaurants, go to sporting events, amusement parks, and concerts, and that is why inflation in the non-housing service sector continues to be so high.
The continued strong demand for consumer services is the reason why it is difficult for the Fed to get supercore inflation under control. The bottom line is that rates will stay higher for longer as strong gains in employment and wealth continue to provide a tailwind to consumer services.
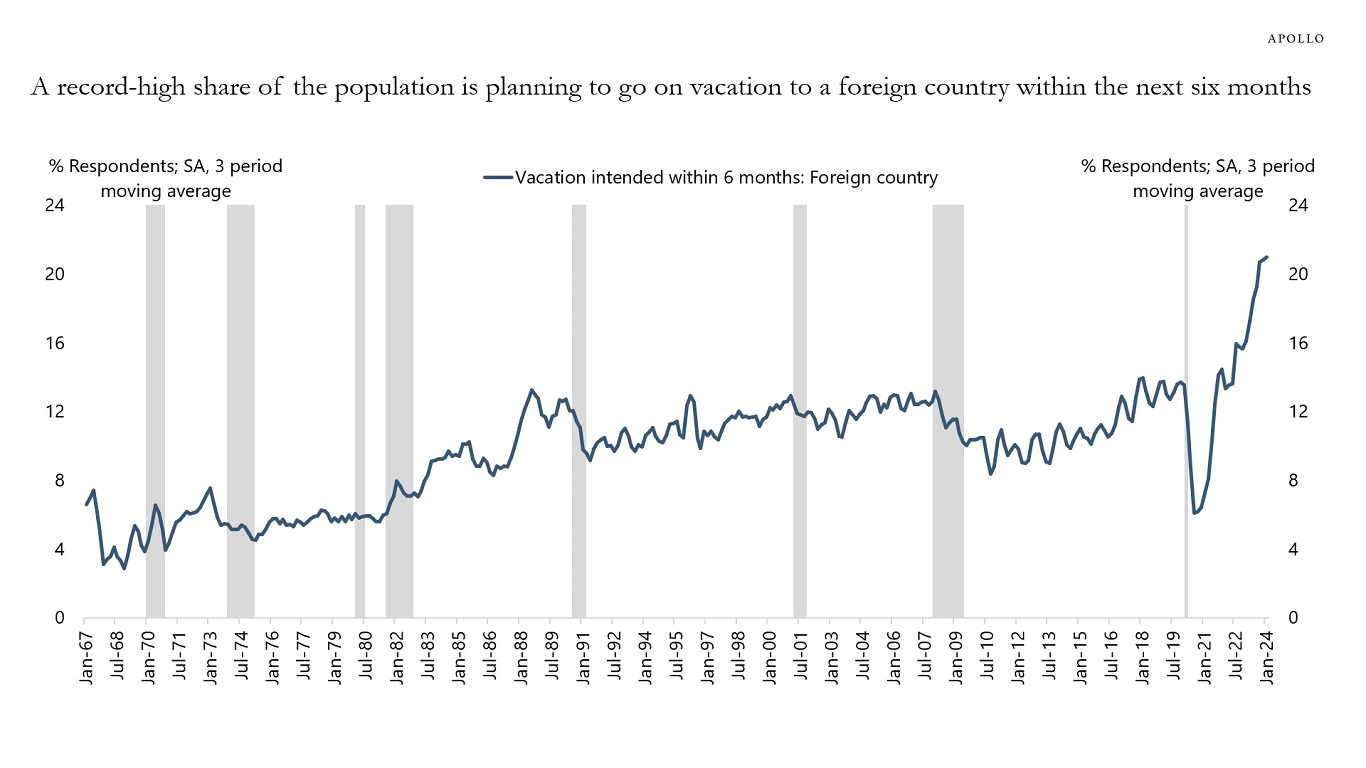
Source: The Conference Board, Haver Analytics, Apollo Chief Economist See important disclaimers at the bottom of the page.
-
Where would the first signs of US fiscal stress appear in markets?
1) Tailing Treasury auctions, lower bid-to-cover ratios, or softer demand from interest rate-sensitive buyers.
2) Rating agencies issuing opinions about the deteriorating US fiscal situation.
3) The term premium trending higher.
Our latest chart book looking at demand and supply of Treasuries is available here.

Source: FFUNDS, Haver, Apollo Chief Economist 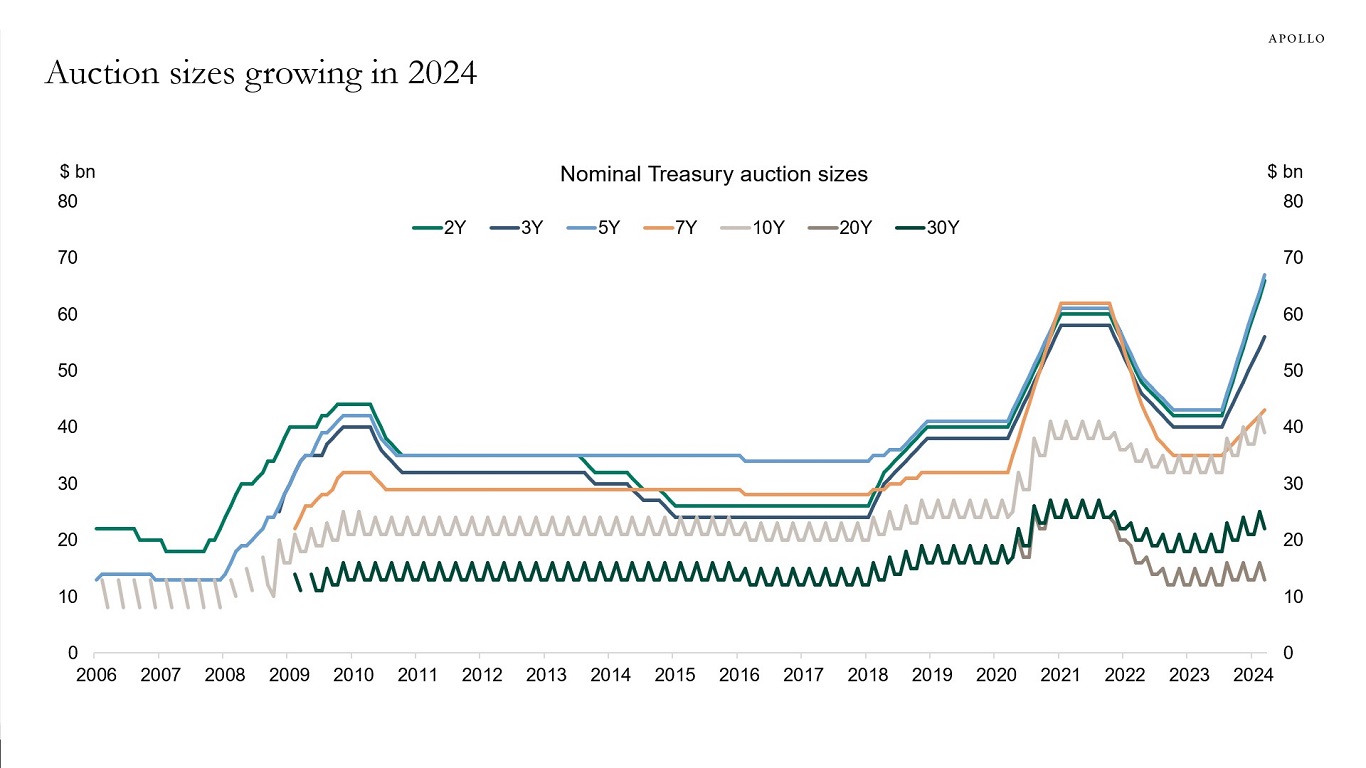
Source: Bureau of Public Debt, Haver Analytics, Apollo Chief Economist 
Source: Bureau of Public Debt, Haver Analytics, Apollo Chief Economist 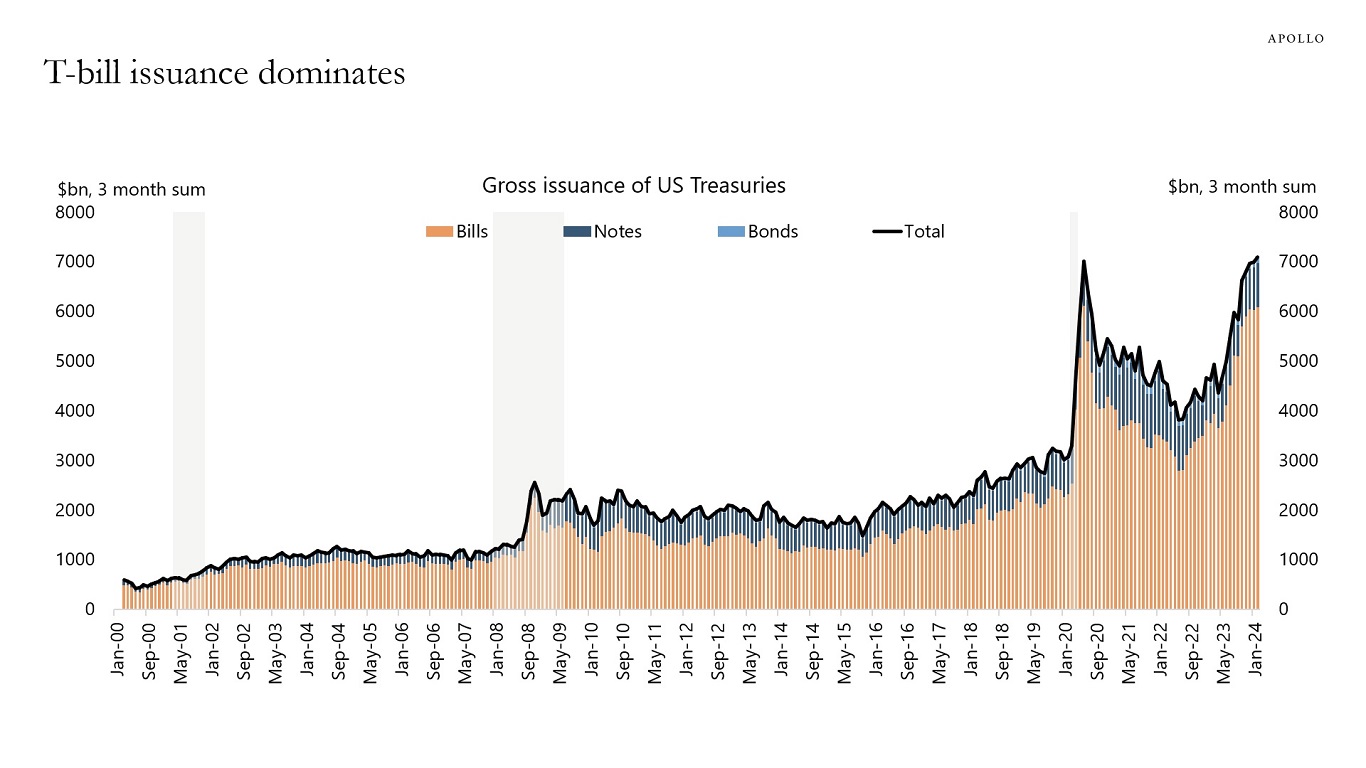
Source: SIFMA, Haver Analytics, Apollo Chief Economist 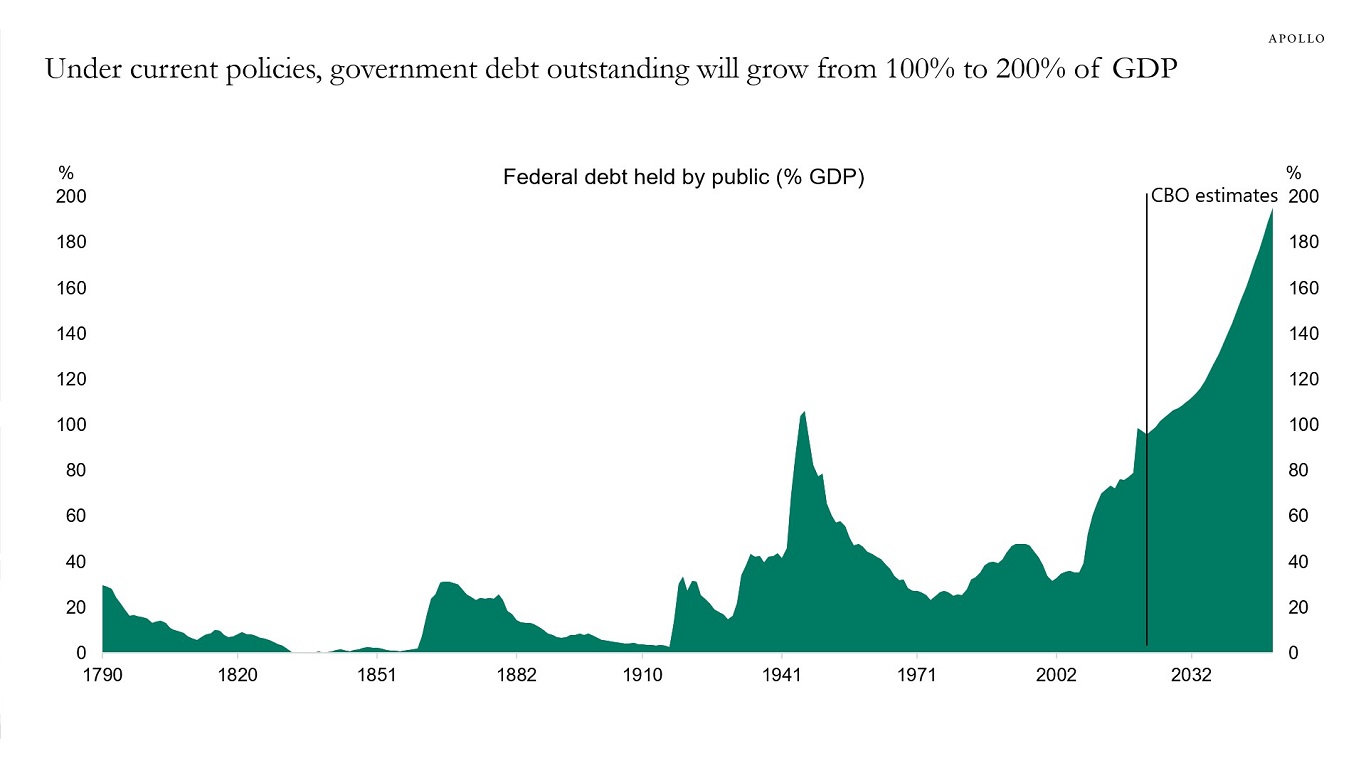
Source: CBO, Haver Analytics, Apollo Chief Economist 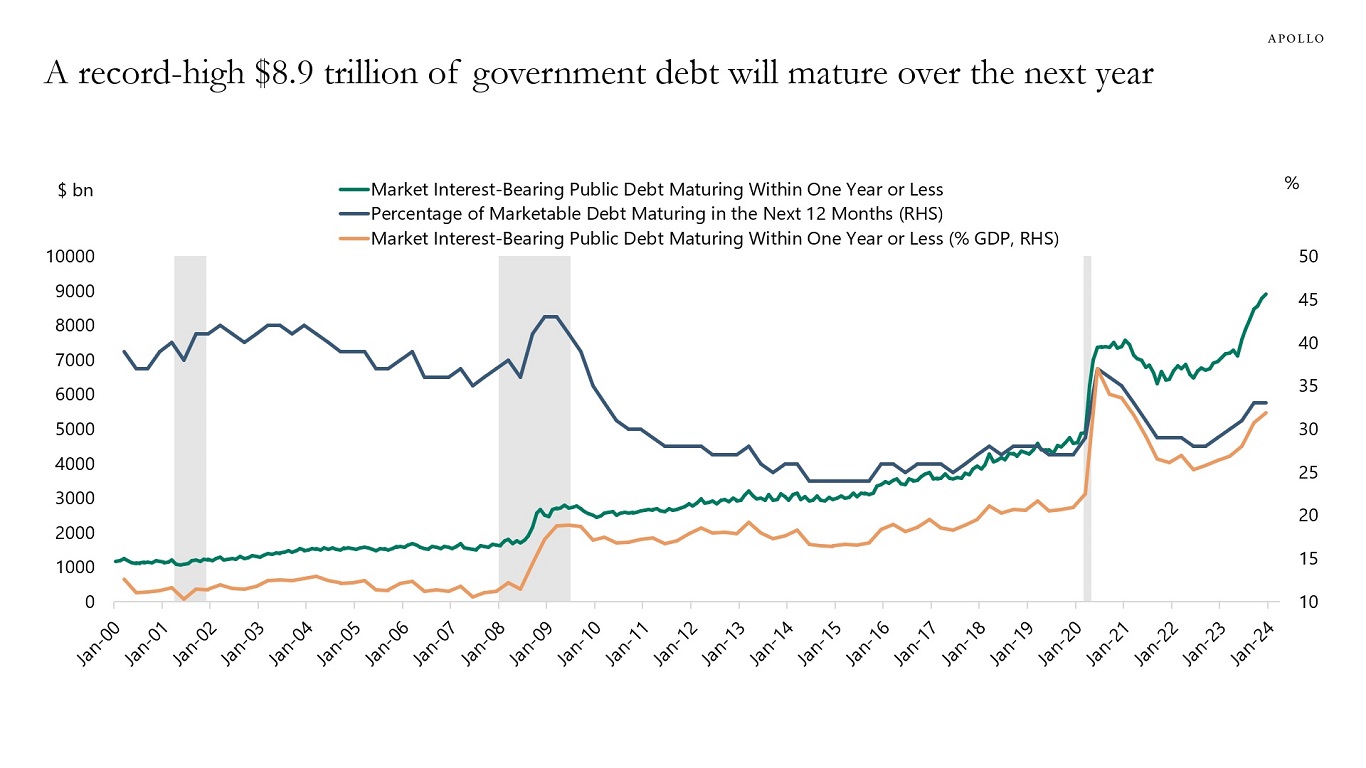
Source: Treasury, BEA, Haver Analytics, Apollo Chief Economist 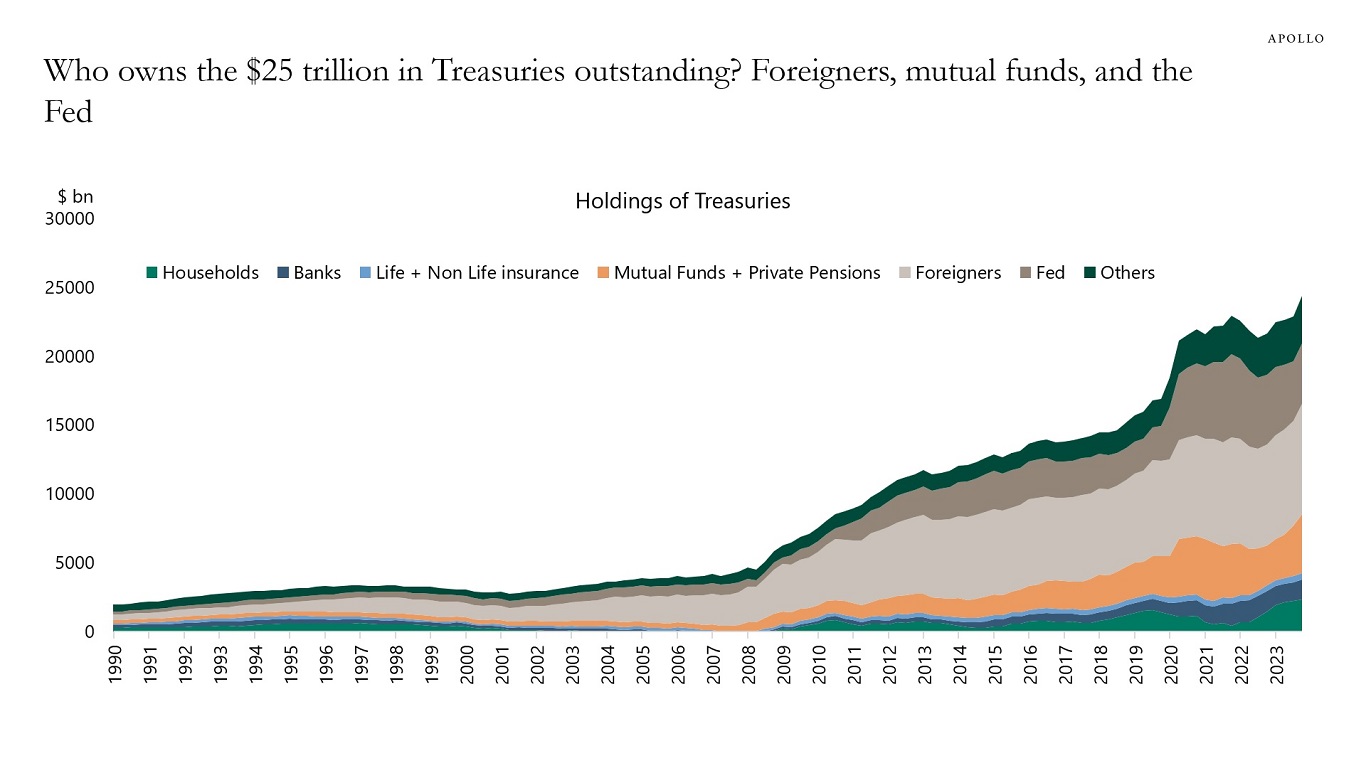
Source: FFUNDS, Haver, Apollo Chief Economist 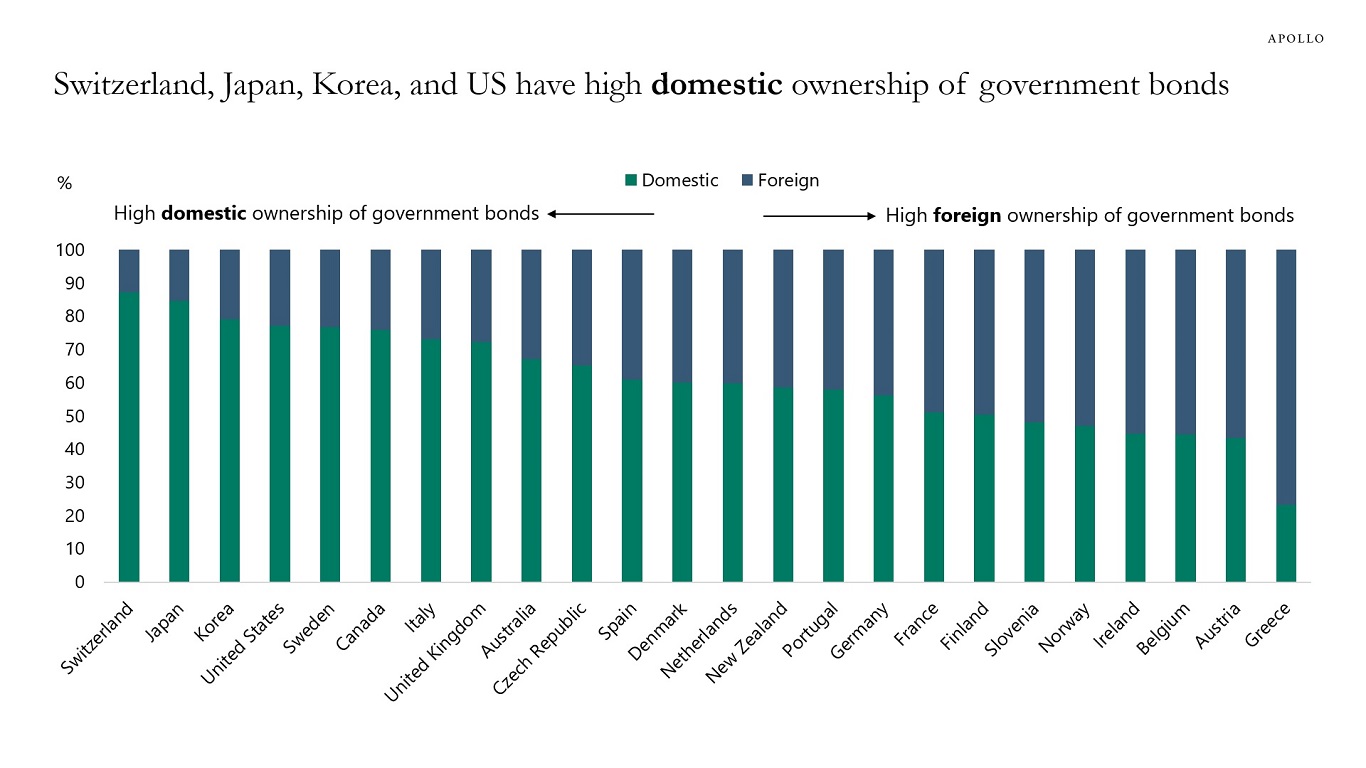
Source: IMF, Apollo Chief Economist. Note: Data as of Q2 2023. 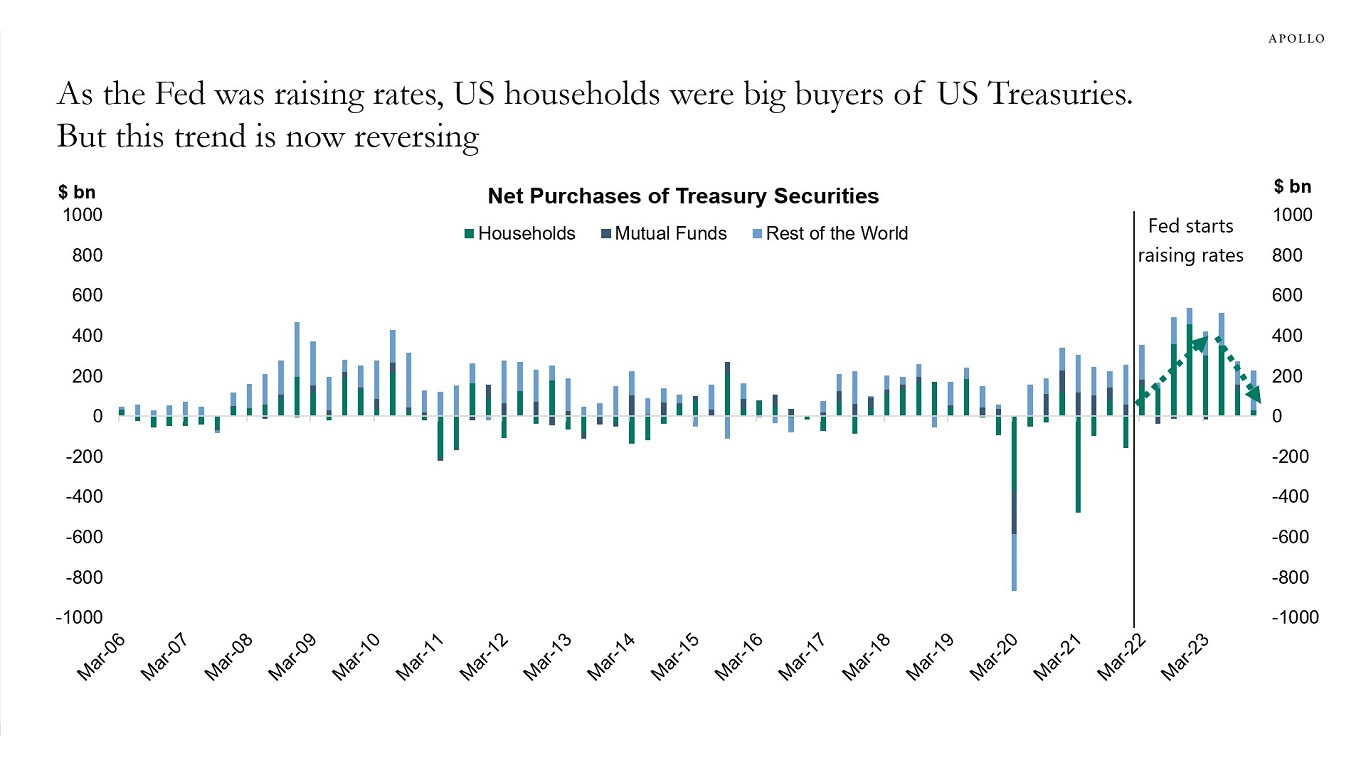
Source: FFUNDS, Haver, Apollo Chief Economist 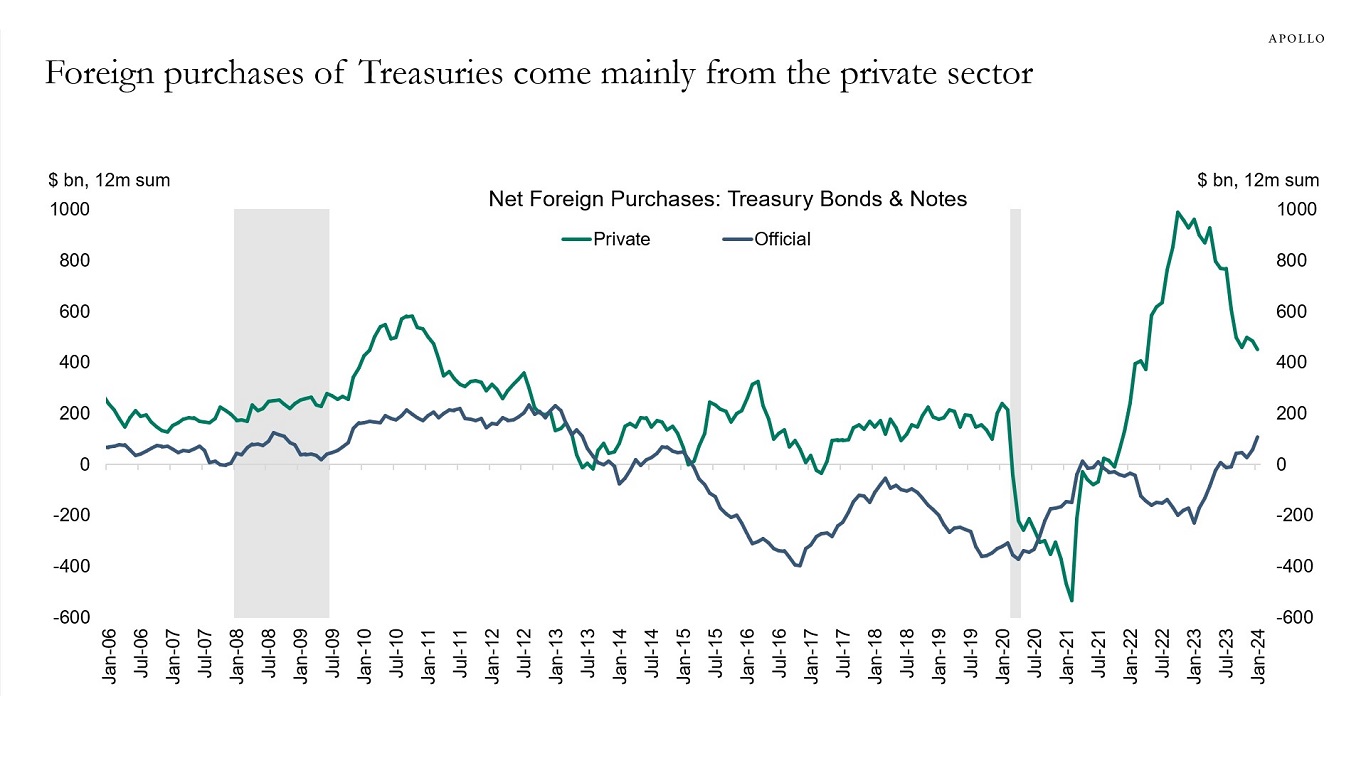
Source: Treasury, Haver Analytics, Apollo Chief Economist 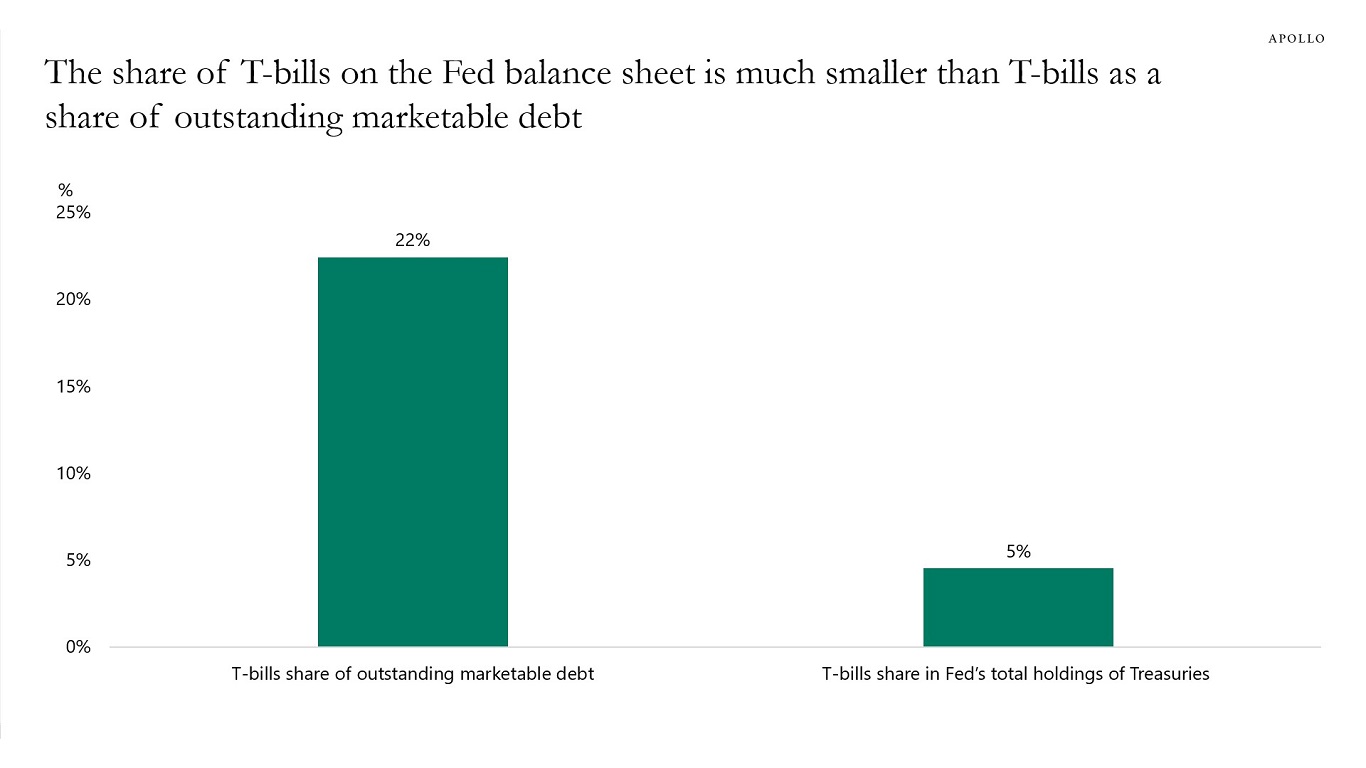
Source: Treasury, FRB, Haver Analytics, Apollo Chief Economist 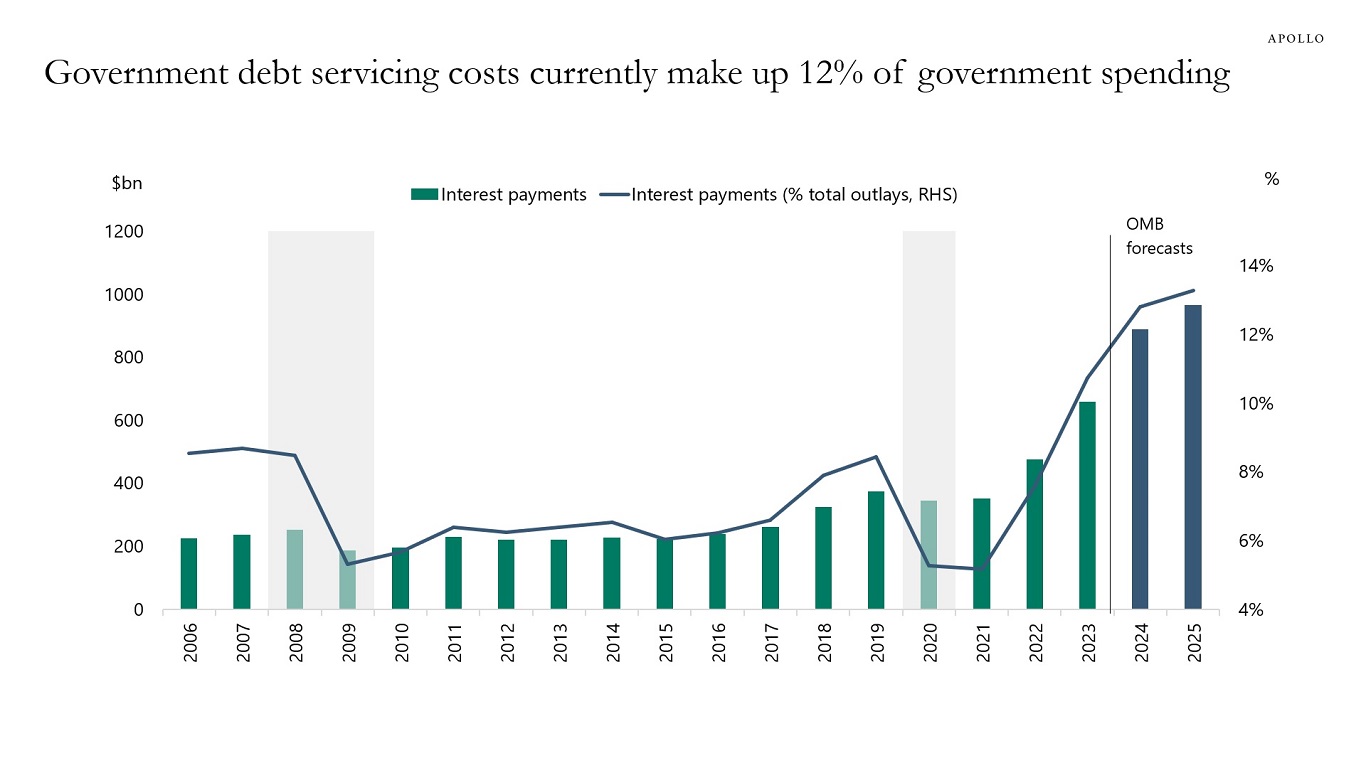
Source: Treasury, OMB, Haver Analytics, Apollo Chief Economist. Note: OMB estimates 10-year yield at around 3.5% in the next 10 years. 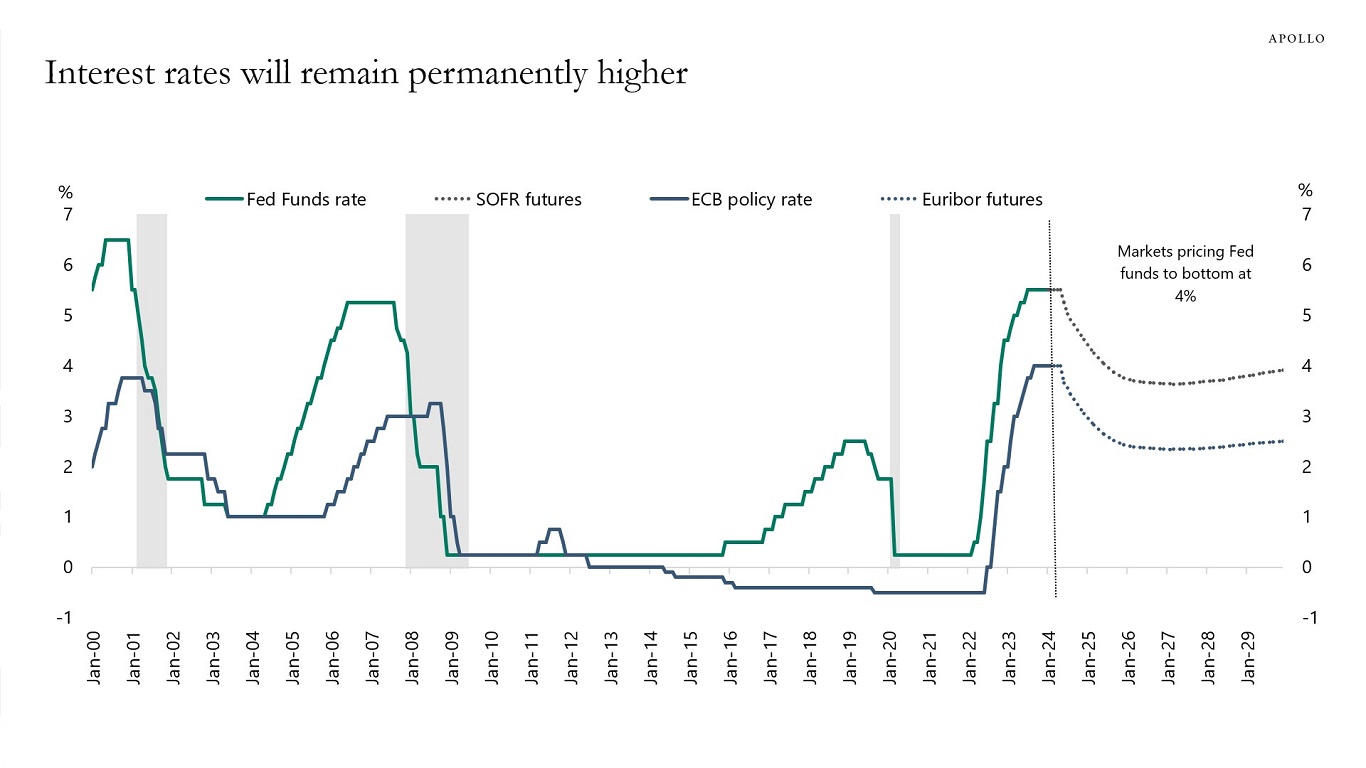
Source: Bloomberg, Apollo Chief Economist 
Source: Apollo Chief Economist See important disclaimers at the bottom of the page.
-
Capital market activity has increased significantly since the Fed meeting in December, with more issuance in IG and HY in January, February, and March, see charts below.
More M&A activity, more IPO activity, tighter credit spreads, and higher stock prices all contribute to stronger GDP growth and higher inflation over the coming quarters.
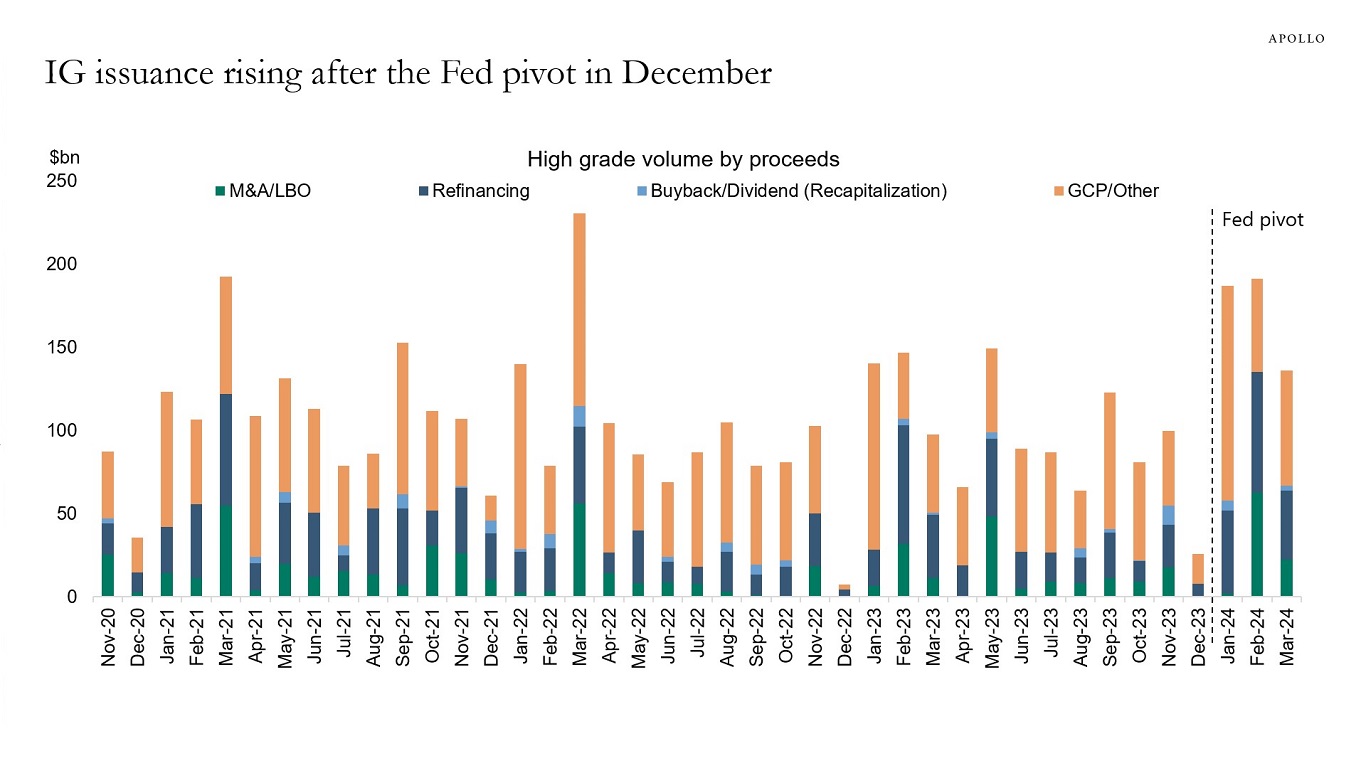
Source: Pitchbook LCD, Apollo Chief Economist. Note: GCP means general corporate purpose, which means making or financing any payment for working capital, capital expenditures, or any other general corporate purpose. 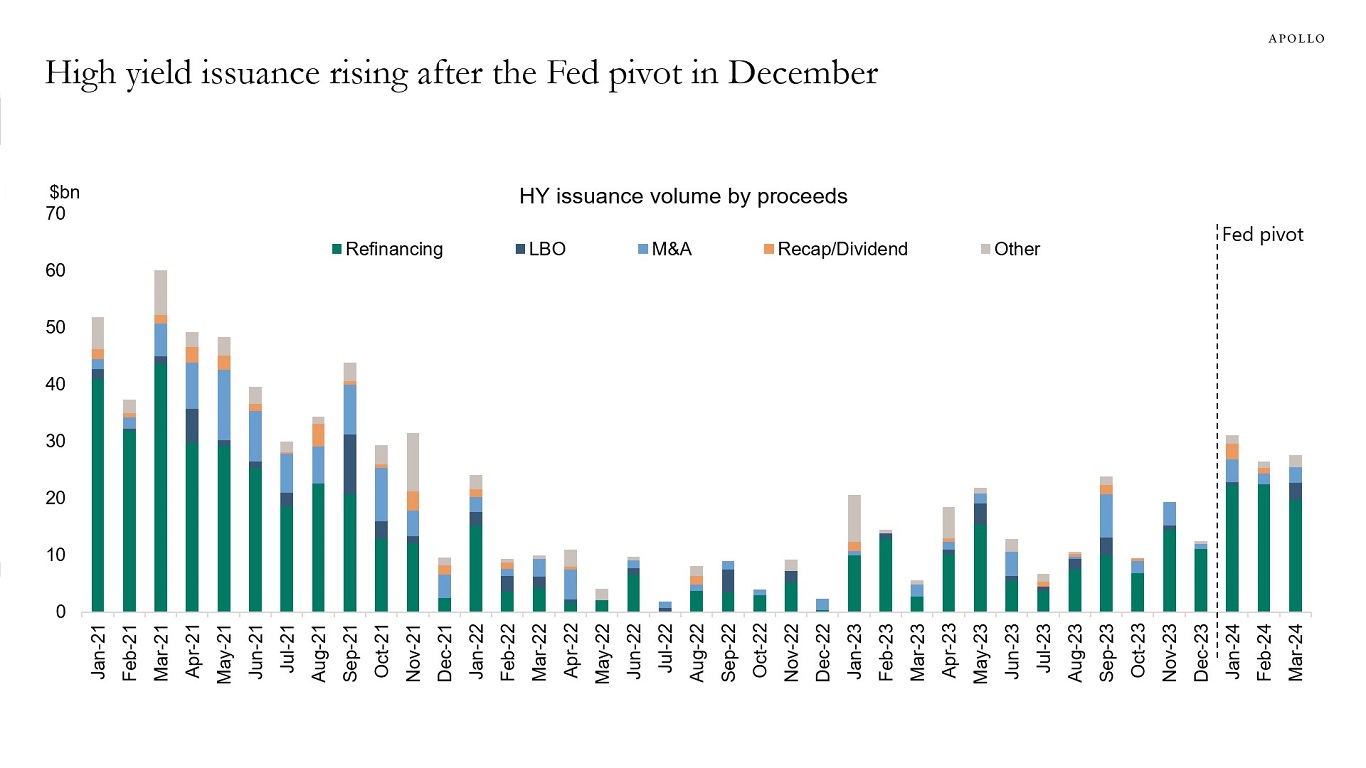
Source: Pitchbook LCD, Apollo Chief Economist See important disclaimers at the bottom of the page.
-
The consensus has been lowering the likelihood of a US recession over the next 12 months, see chart below.
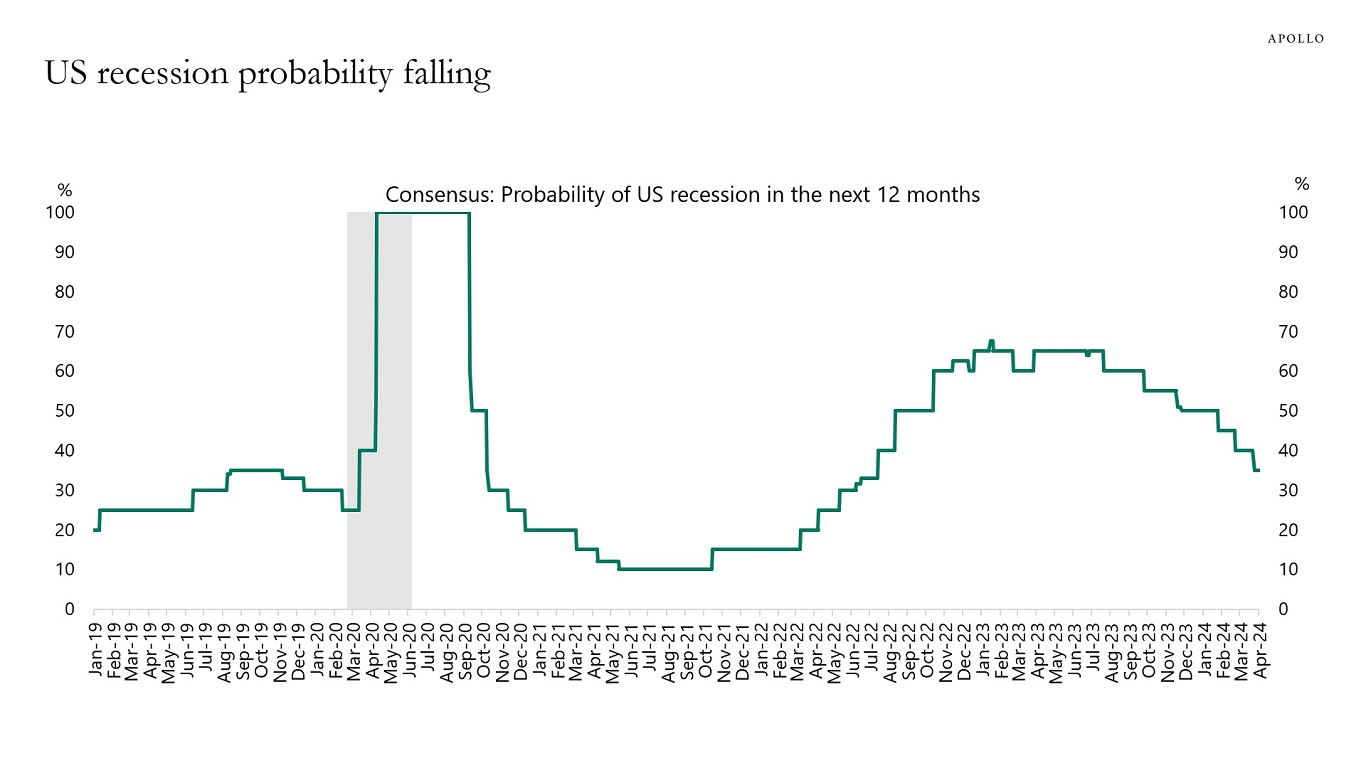
Source: Bloomberg, Apollo Chief Economist See important disclaimers at the bottom of the page.
-
The number of people going to Broadway shows has been rising faster than normal in recent weeks, likely driven by the strong labor market and strong household gains in financial wealth and housing wealth.
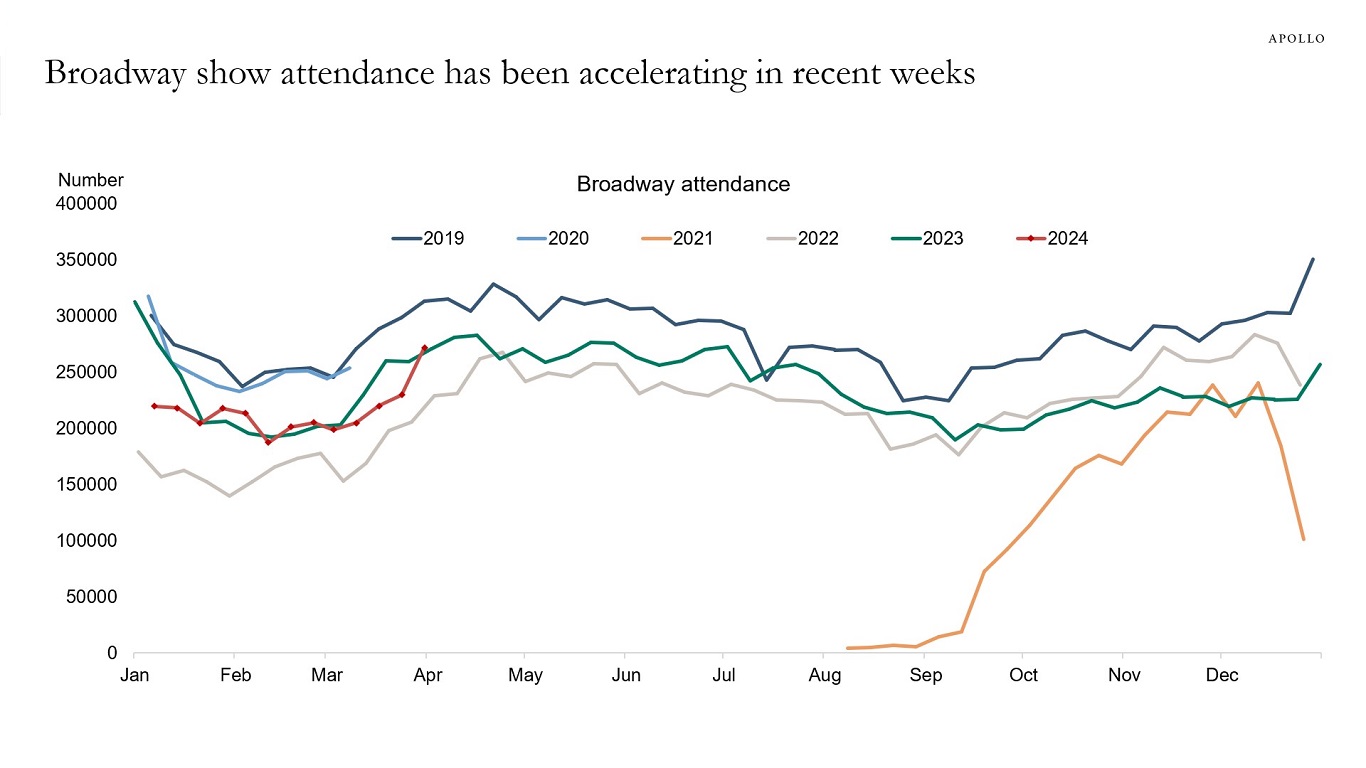
Source: Internet Broadway Database, Apollo Chief Economist See important disclaimers at the bottom of the page.
-
Looking at the average age of highways, streets, and power facilities, US infrastructure has never been in worse shape than it is at the moment, see chart below.
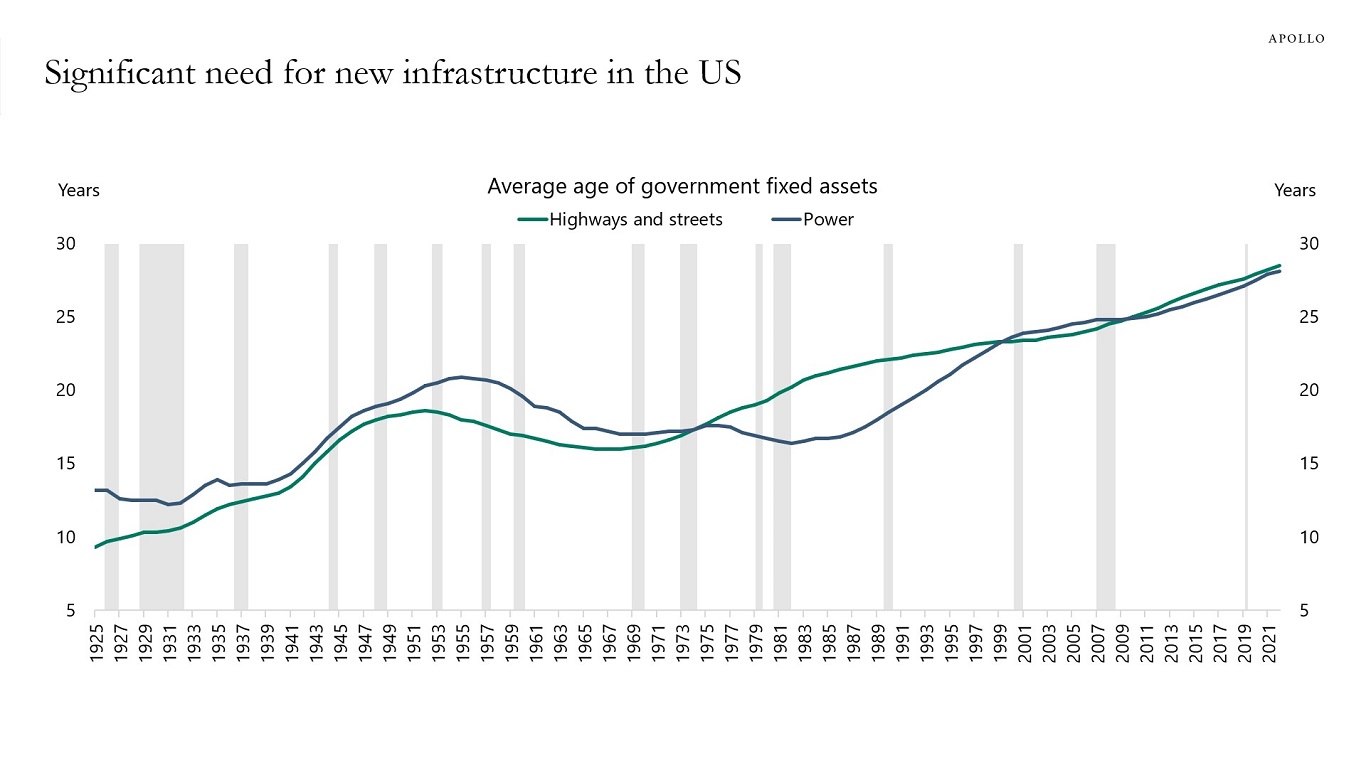
Source: BEA, Apollo Chief Economist See important disclaimers at the bottom of the page.
-
In 2023 it was all about the Magnificent Seven. Then it was the Fabulous Four. But now it is turning out that the story is actually a lot more complicated, see charts below.
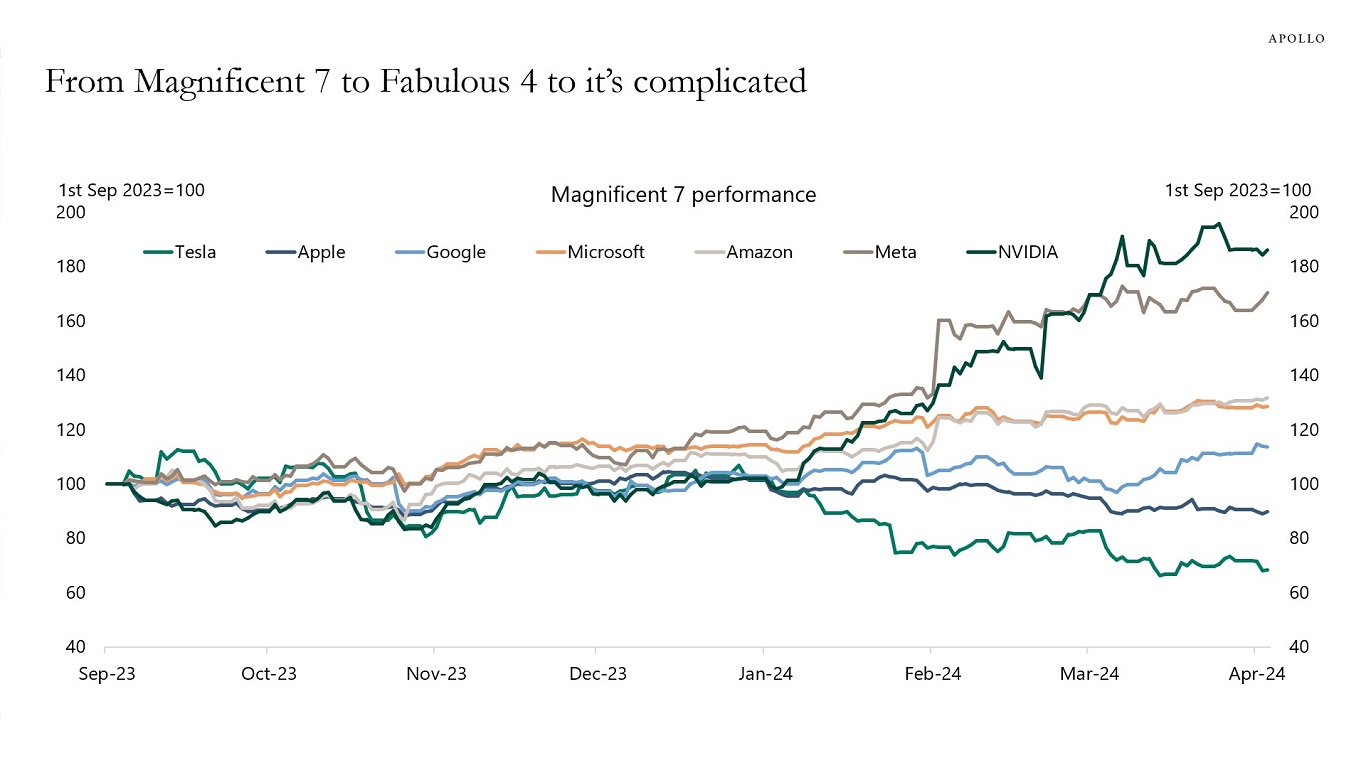
Source: Bloomberg, Apollo Chief Economist 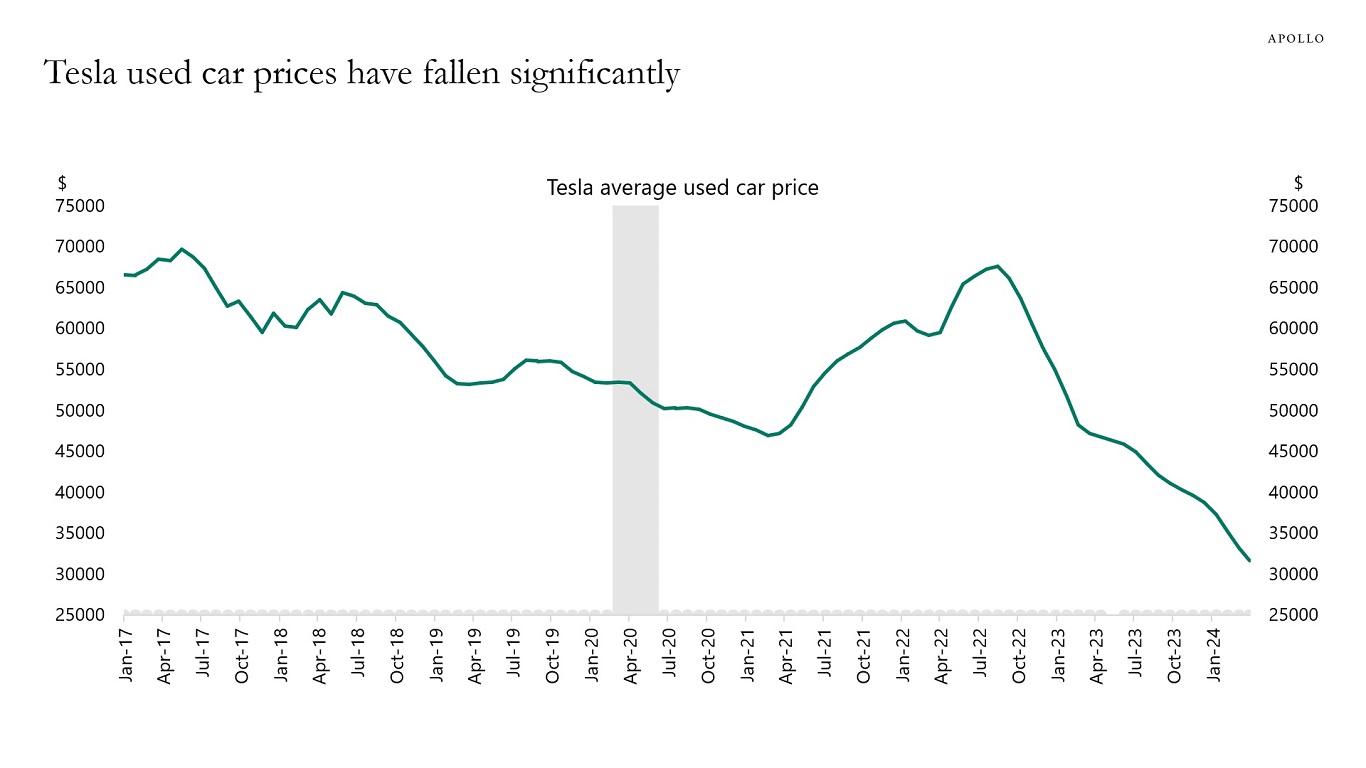
Source: Cargurus.com, Apollo Chief Economist See important disclaimers at the bottom of the page.
-
After the Fed started raising rates in March 2022, coverage ratios began to move lower, see chart below, and after the Fed turned dovish at the November 2023 FOMC meeting, coverage ratios have started to rebound.
The bottom line is that the strong economy and strong earnings combined with very easy financial conditions are helping companies manage their balance sheets, including high debt levels.
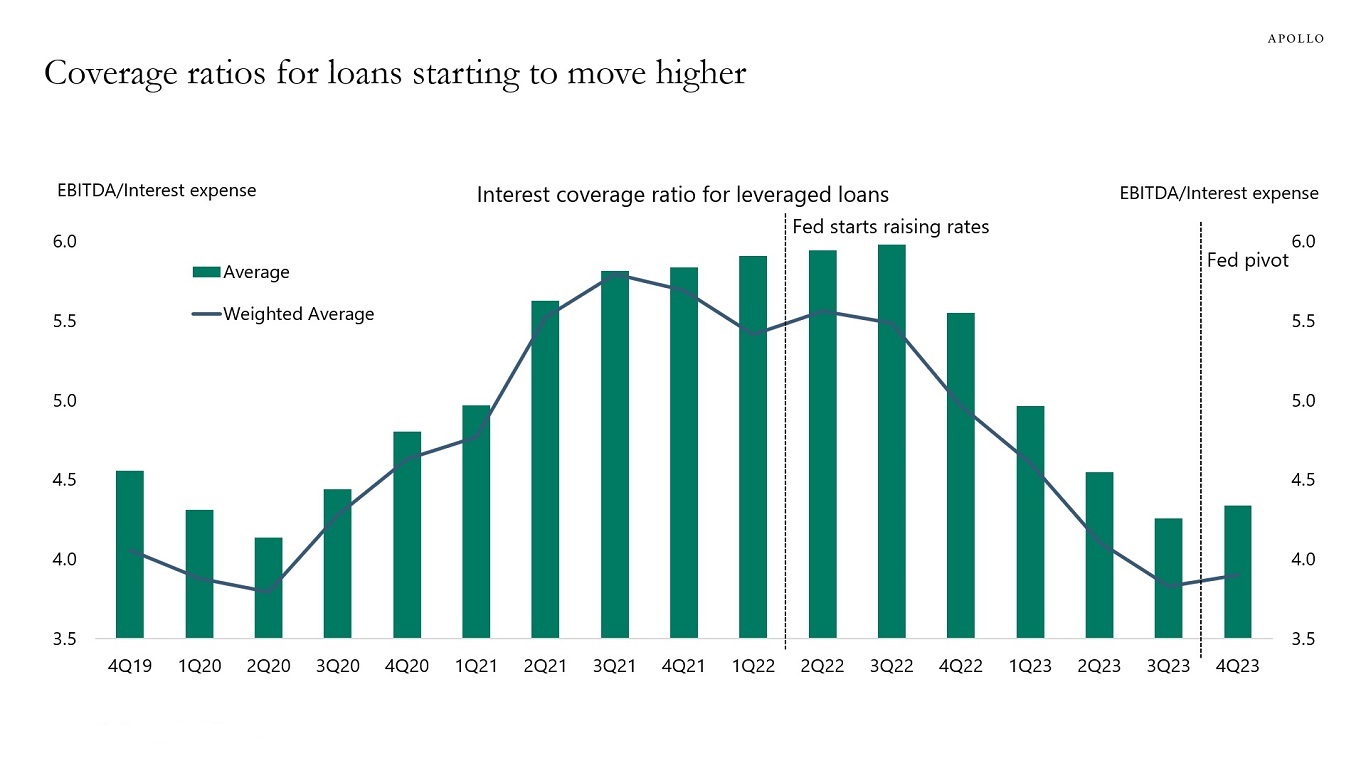
Source: Pitchbook LCD, Apollo Chief Economist See important disclaimers at the bottom of the page.

This presentation may not be distributed, transmitted or otherwise communicated to others in whole or in part without the express consent of Apollo Global Management, Inc. (together with its subsidiaries, “Apollo”).
Apollo makes no representation or warranty, expressed or implied, with respect to the accuracy, reasonableness, or completeness of any of the statements made during this presentation, including, but not limited to, statements obtained from third parties. Opinions, estimates and projections constitute the current judgment of the speaker as of the date indicated. They do not necessarily reflect the views and opinions of Apollo and are subject to change at any time without notice. Apollo does not have any responsibility to update this presentation to account for such changes. There can be no assurance that any trends discussed during this presentation will continue.
Statements made throughout this presentation are not intended to provide, and should not be relied upon for, accounting, legal or tax advice and do not constitute an investment recommendation or investment advice. Investors should make an independent investigation of the information discussed during this presentation, including consulting their tax, legal, accounting or other advisors about such information. Apollo does not act for you and is not responsible for providing you with the protections afforded to its clients. This presentation does not constitute an offer to sell, or the solicitation of an offer to buy, any security, product or service, including interest in any investment product or fund or account managed or advised by Apollo.
Certain statements made throughout this presentation may be “forward-looking” in nature. Due to various risks and uncertainties, actual events or results may differ materially from those reflected or contemplated in such forward-looking information. As such, undue reliance should not be placed on such statements. Forward-looking statements may be identified by the use of terminology including, but not limited to, “may”, “will”, “should”, “expect”, “anticipate”, “target”, “project”, “estimate”, “intend”, “continue” or “believe” or the negatives thereof or other variations thereon or comparable terminology.