


Want it delivered daily to your inbox?
-
Our latest outlook for the housing market is available here, key charts below.
Source: Apollo Chief Economist 
Source: Redfin, Haver Analytics, Apollo Chief Economist 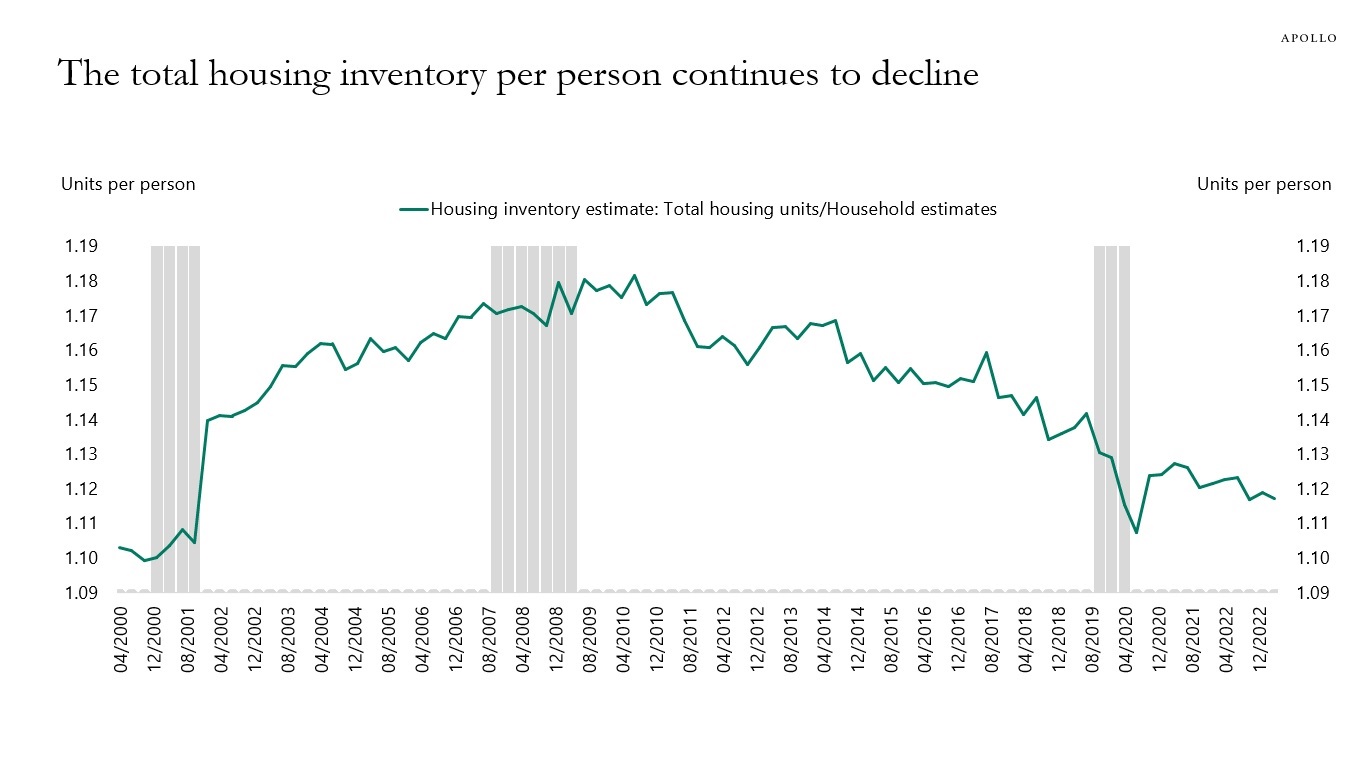
Source: Census Bureau, FRED, Apollo Chief Economist 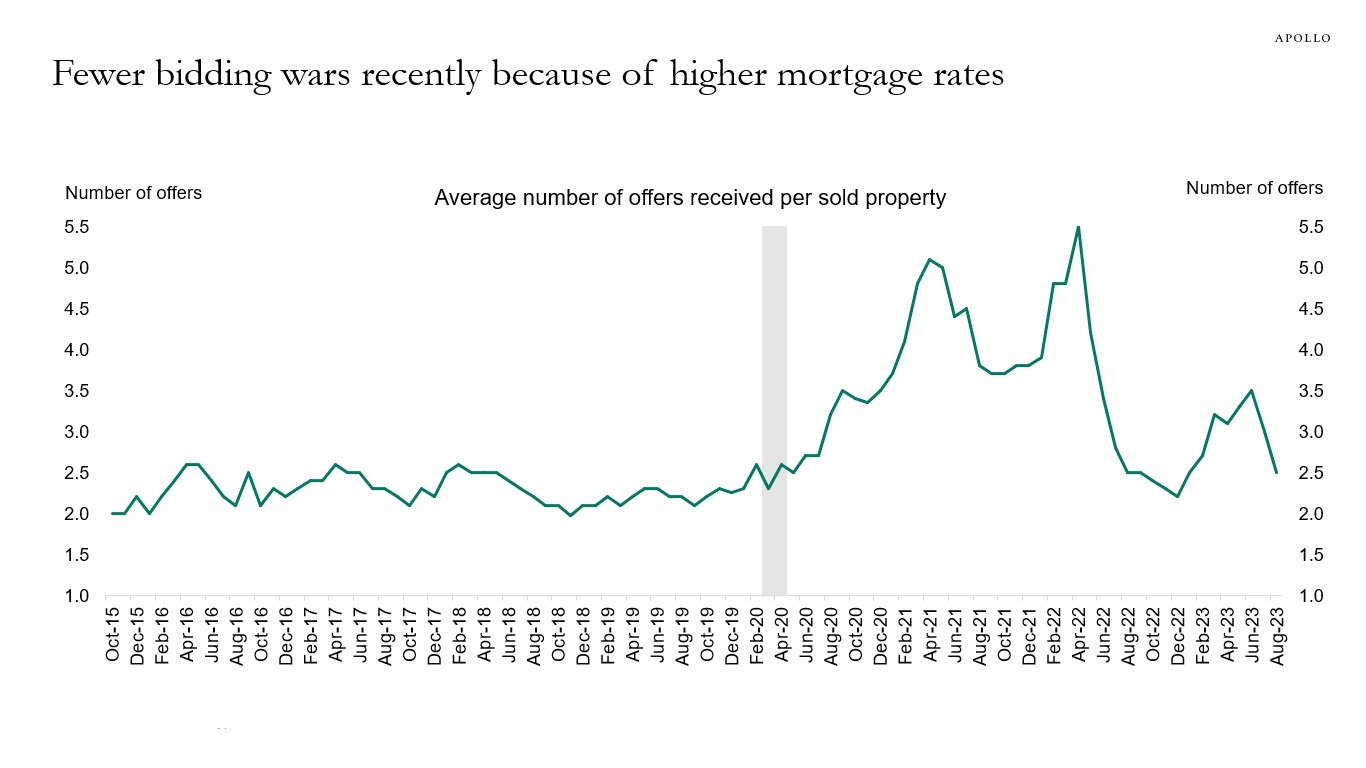
Source: NAR, Apollo Chief Economist 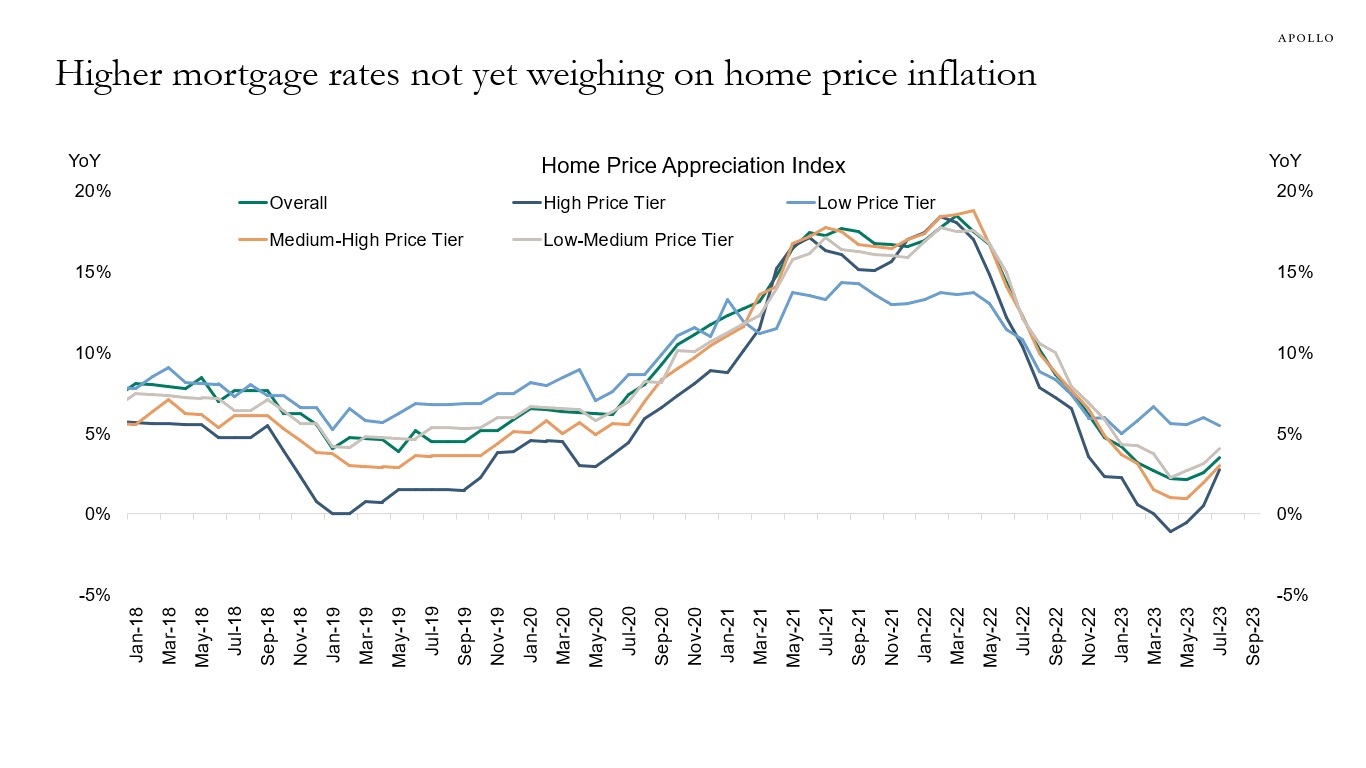
Source: American Enterprise Institute, Haver, Apollo Chief Economist 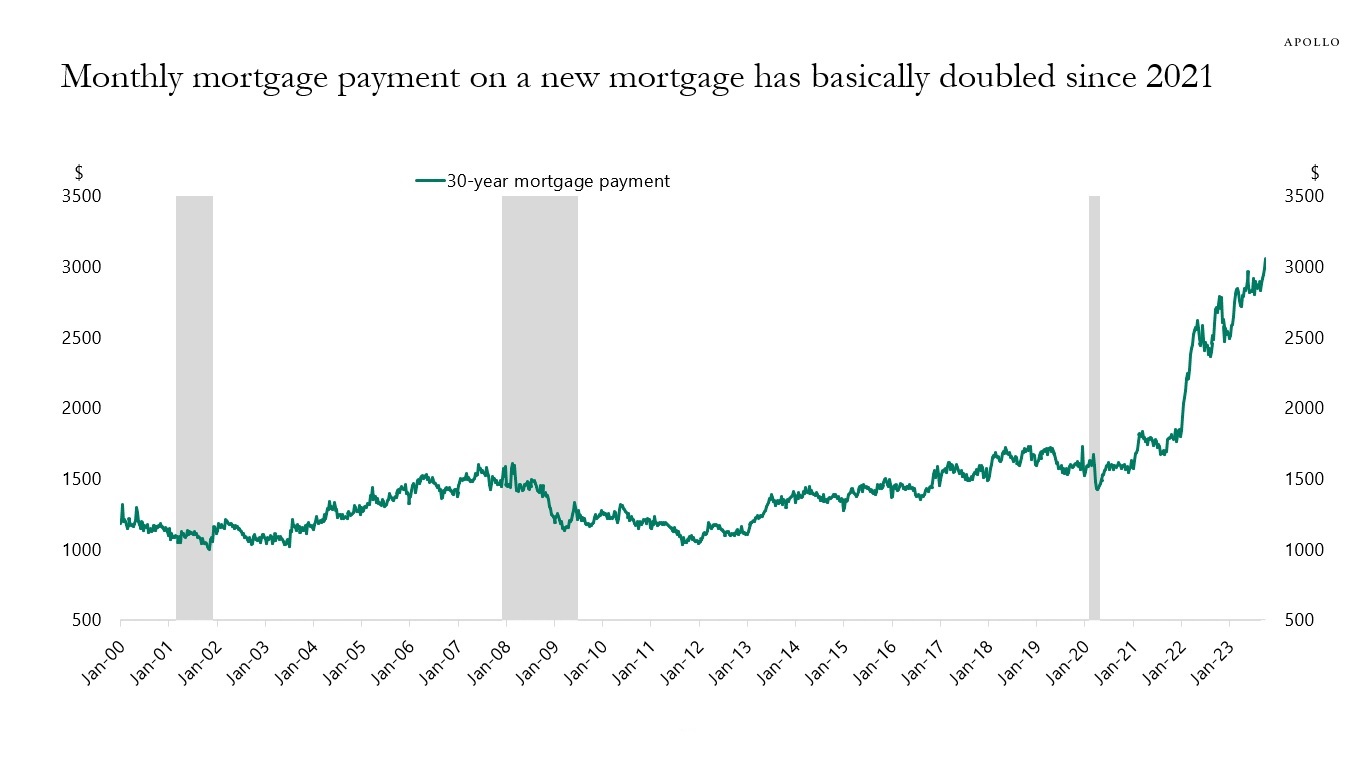
Source: Bloomberg L.P., Apollo Chief Economist (Note: Calculation of monthly payment using the 30-year purchase loan application size and the 30-year effective rate.) 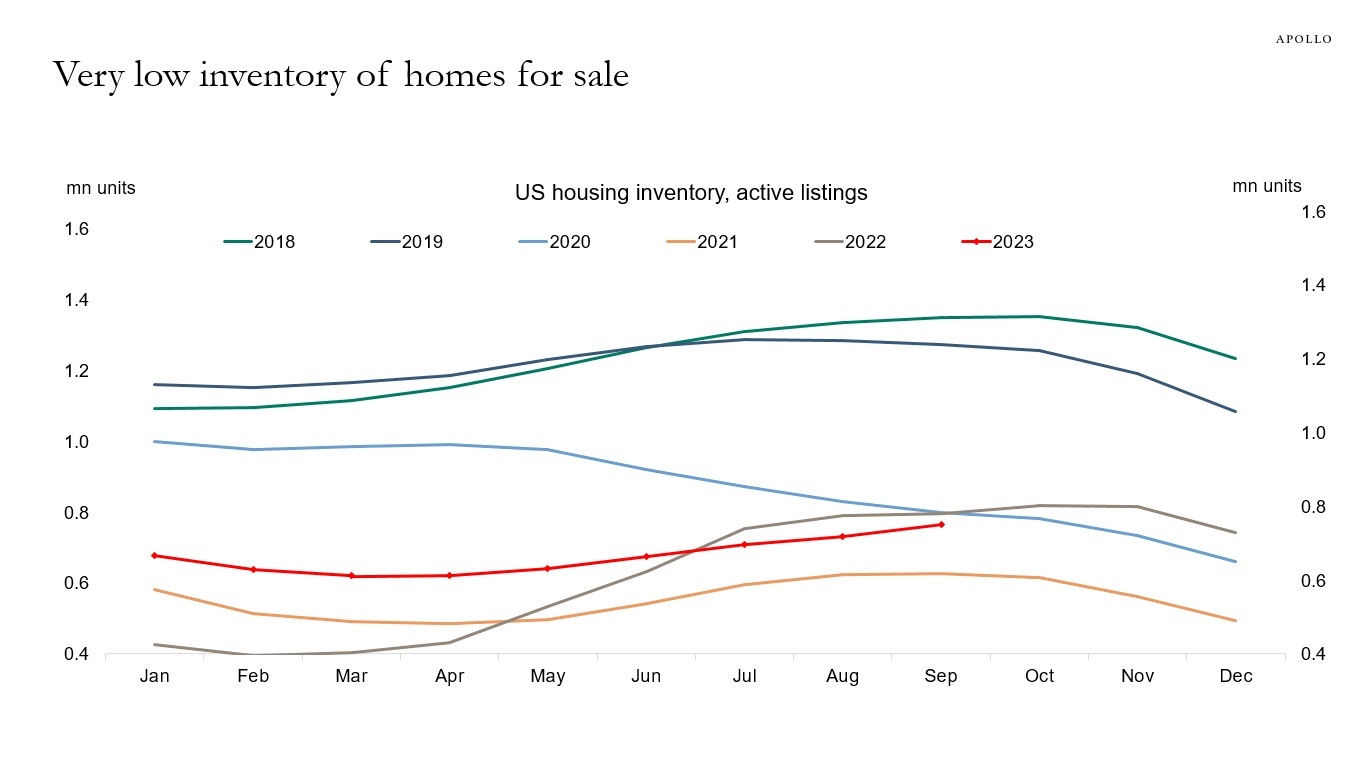
Source: Realtor.com, Apollo Chief Economist 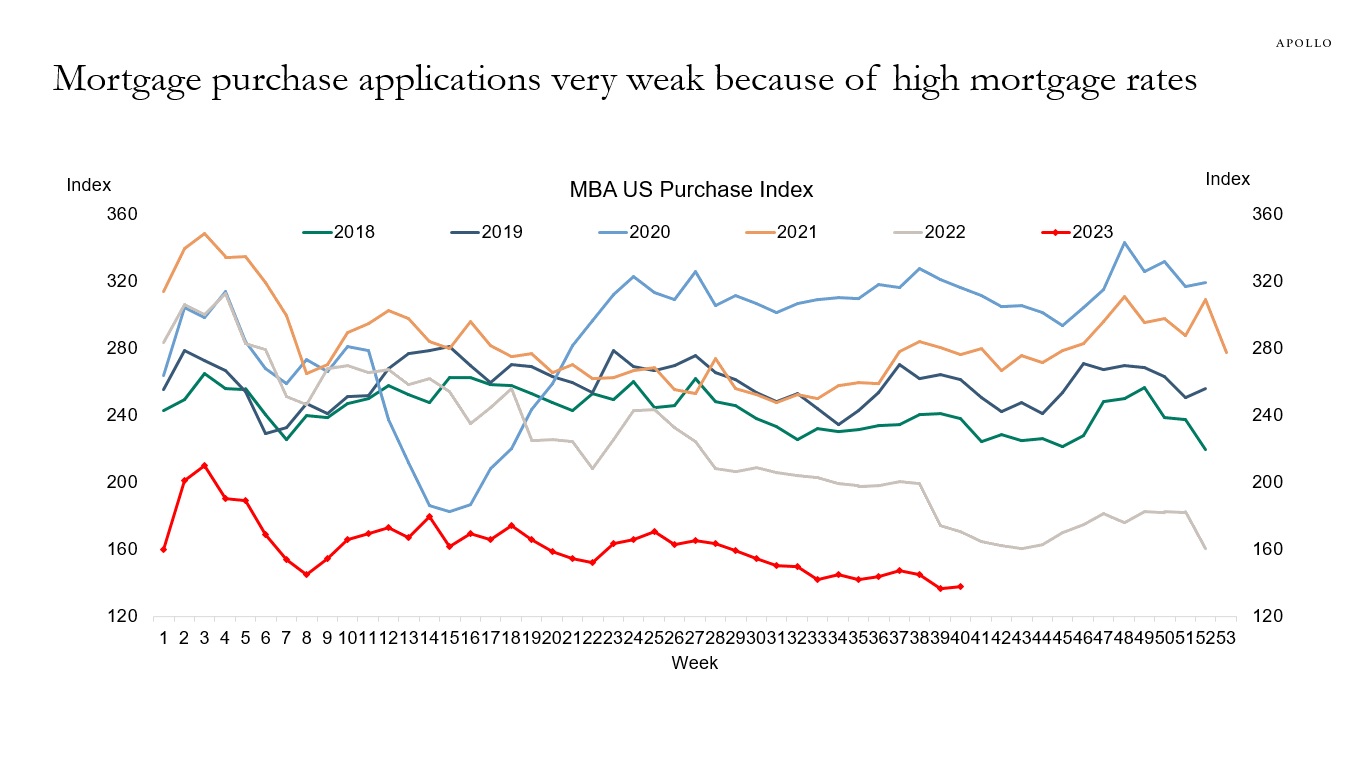
Source: Mortgage Bankers Association, Bloomberg, Apollo Chief Economist 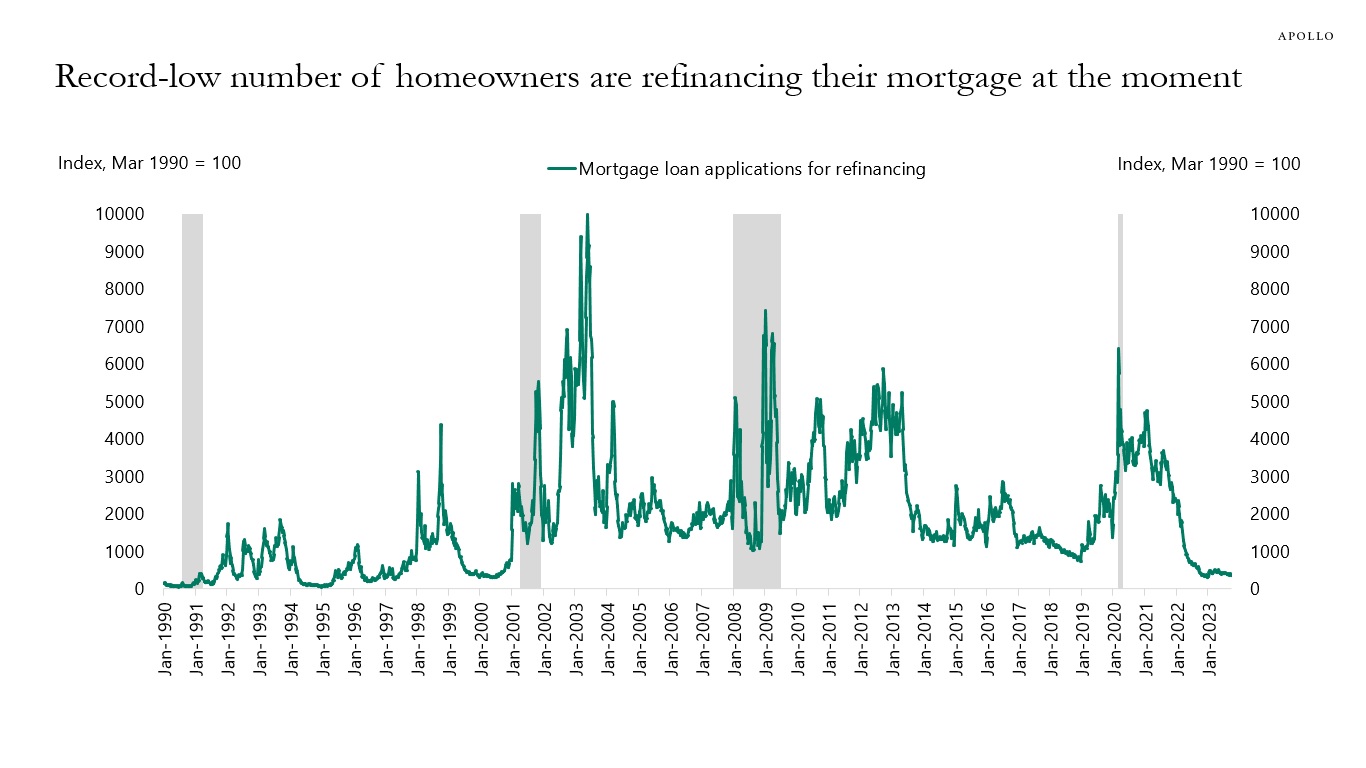
Source: Mortgage Bankers Association, Bloomberg, Apollo Chief Economist 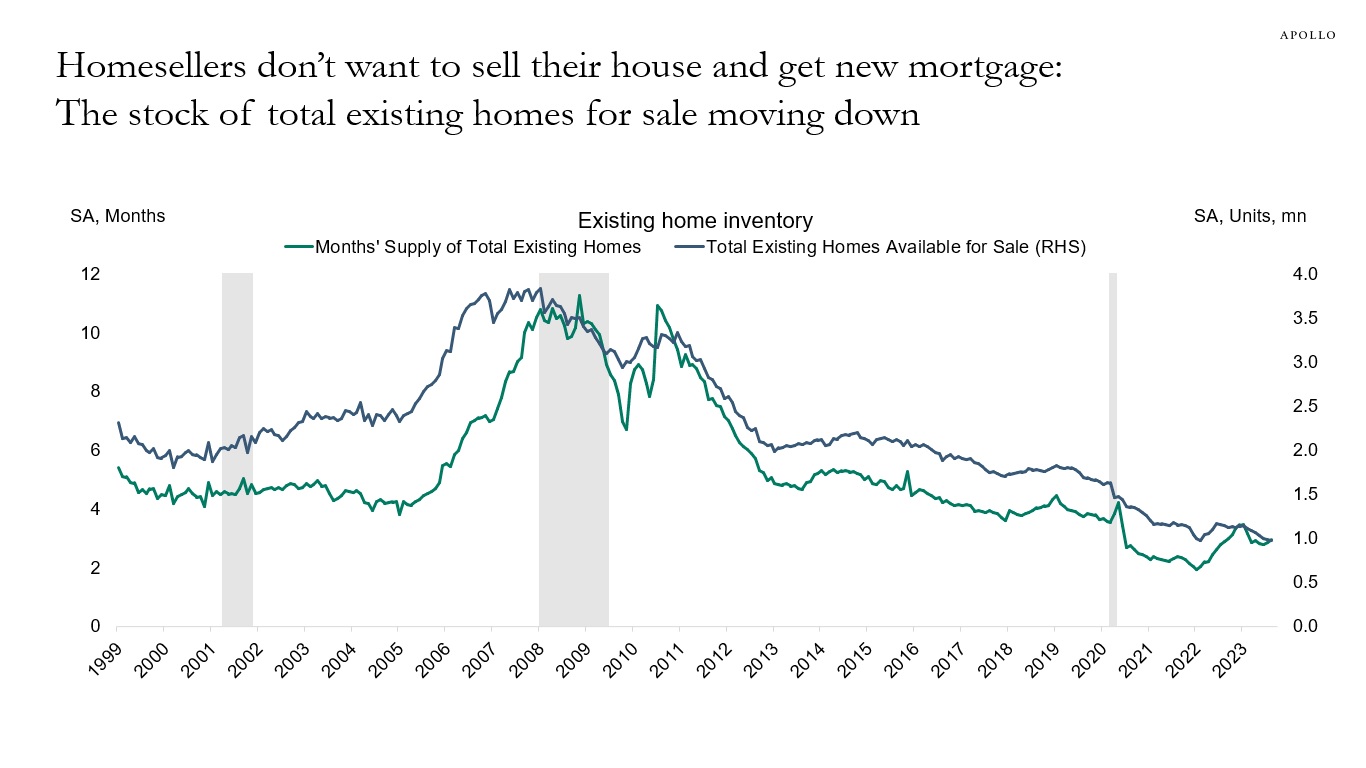
Source: NAR, Apollo Chief Economist 
Source: Census CPS, Apollo Chief Economist 
Source: National Association of Homebuilders, Bloomberg, Apollo Chief Economist 
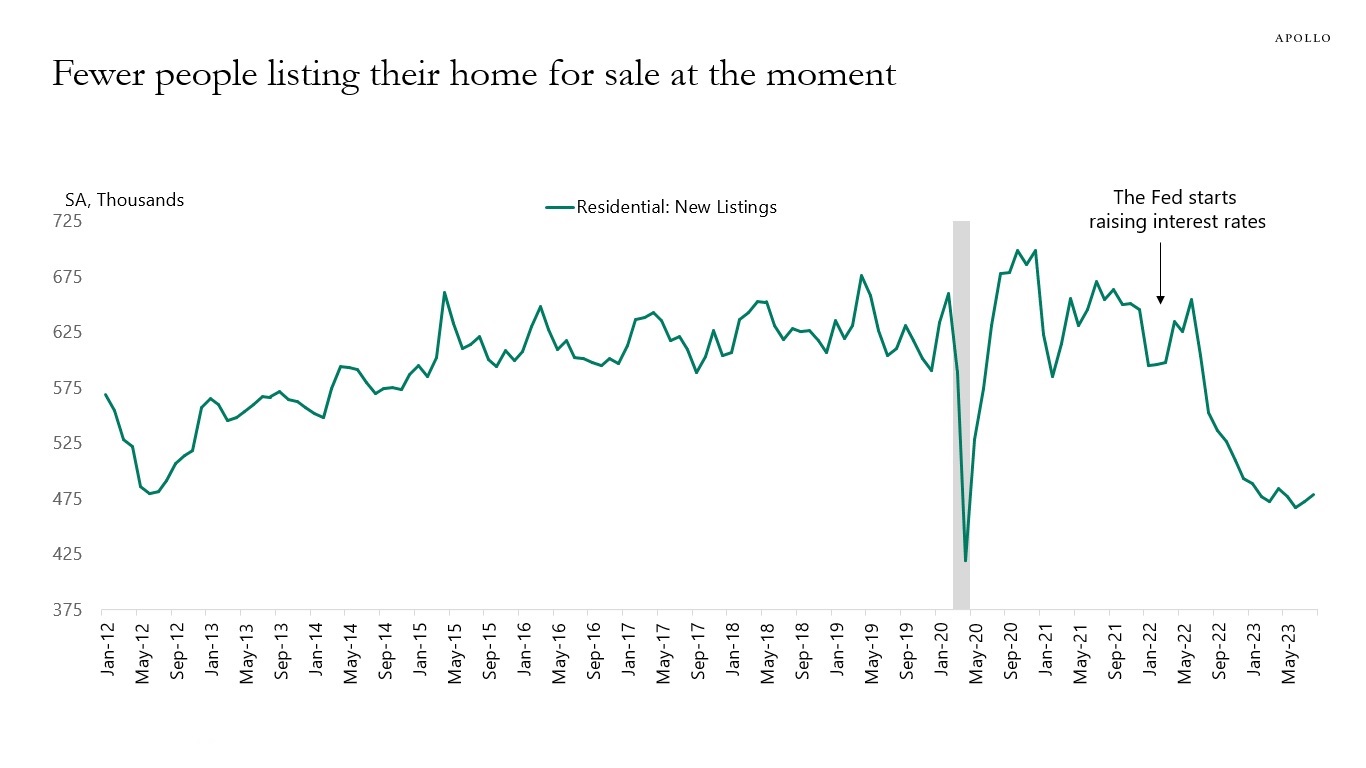
Source: Census, Haver Analytics, Apollo Chief Economist. Note: Single-family homes are one-unit buildings. See important disclaimers at the bottom of the page.
-
The Worker Adjustment and Retraining Notification (WARN) Act gives 60 to 90 days advance notice in cases of plant closings and mass layoffs, and the latest data shows a significant move higher in WARN notices recently, see chart below.
In other words, the WARN data is telling us that more companies are giving advance warnings about plant closings and mass layoffs.
Running a regression using WARN notices to predict unemployment shows that initial jobless claims in October will rise over the coming weeks to a level between 250K and 300K, see chart below.
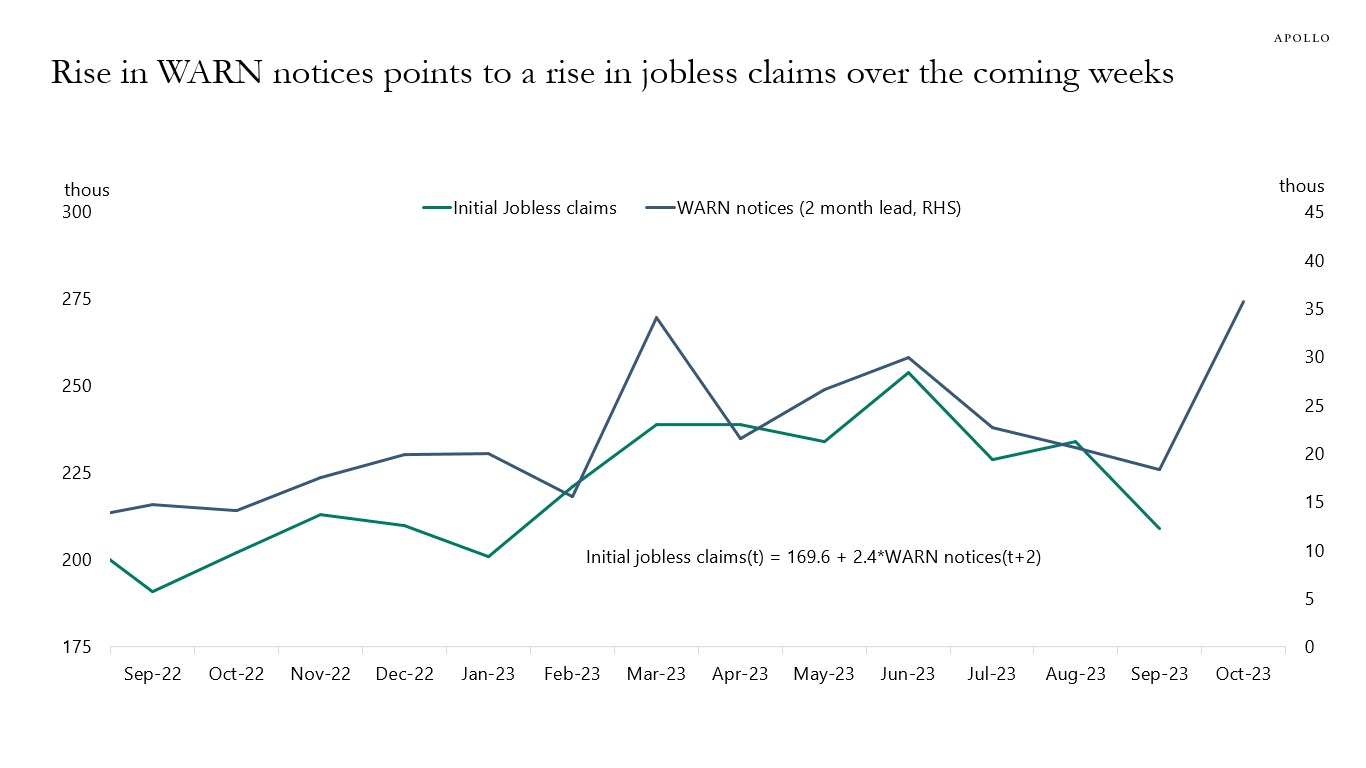
Source: Department of Labor, Haver Analytics, Federal Reserve Bank of Cleveland, Apollo Chief Economist. Note: The Worker Adjustment and Retraining Notification (WARN) Act helps ensure 60 to 90 days advance notice in cases of qualified plant closings and mass layoffs. WARN factor is the Cleveland Fed estimate for WARN notices. See important disclaimers at the bottom of the page.
-
Our monthly outlook for public and private markets is available here.
Source: Bloomberg, Apollo Chief Economist 
Source: Bloomberg, Apollo Chief Economist 
Source: Bloomberg, Apollo Chief Economist 
Source: Bloomberg, Apollo Chief Economist 
See important disclaimers at the bottom of the page.
-
Markets are pricing that the Fed funds rate will bottom at 4% in 2025 and then start rising again, see chart below.
The same profile can be seen for the ECB, where rates will bottom at 3% and then start rising again.
The conclusion is that long-term investors should plan on rates being permanently higher than they were from 2008 to 2020.
In other words, rates are not going back to zero.
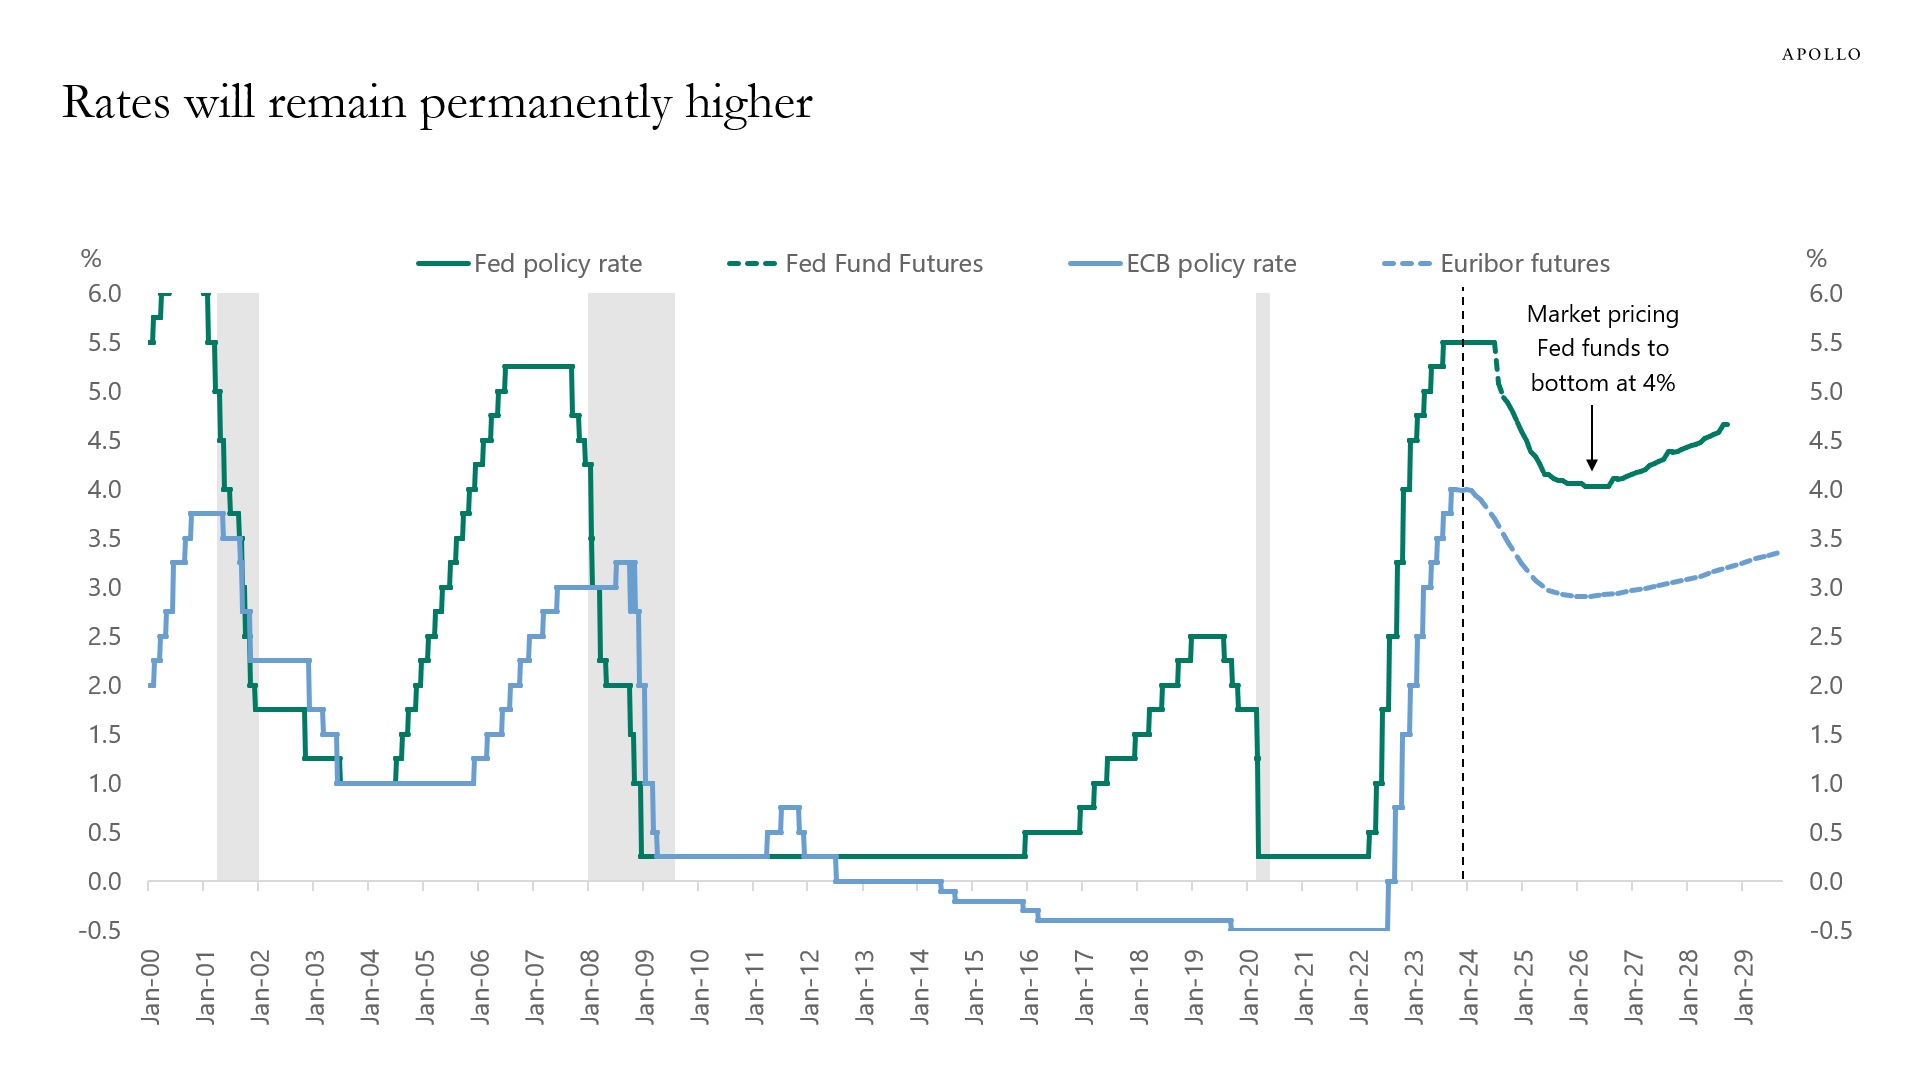
Source: Bloomberg, Apollo Chief Economist See important disclaimers at the bottom of the page.
-
The September data for bankruptcy filings are out, and more and more companies are going bankrupt because of Fed hikes, see the first chart below.
Bankruptcies are hitting companies with high levels of debt and low earnings in the Consumer discretionary, Healthcare, and Industrials sectors, see the second chart.
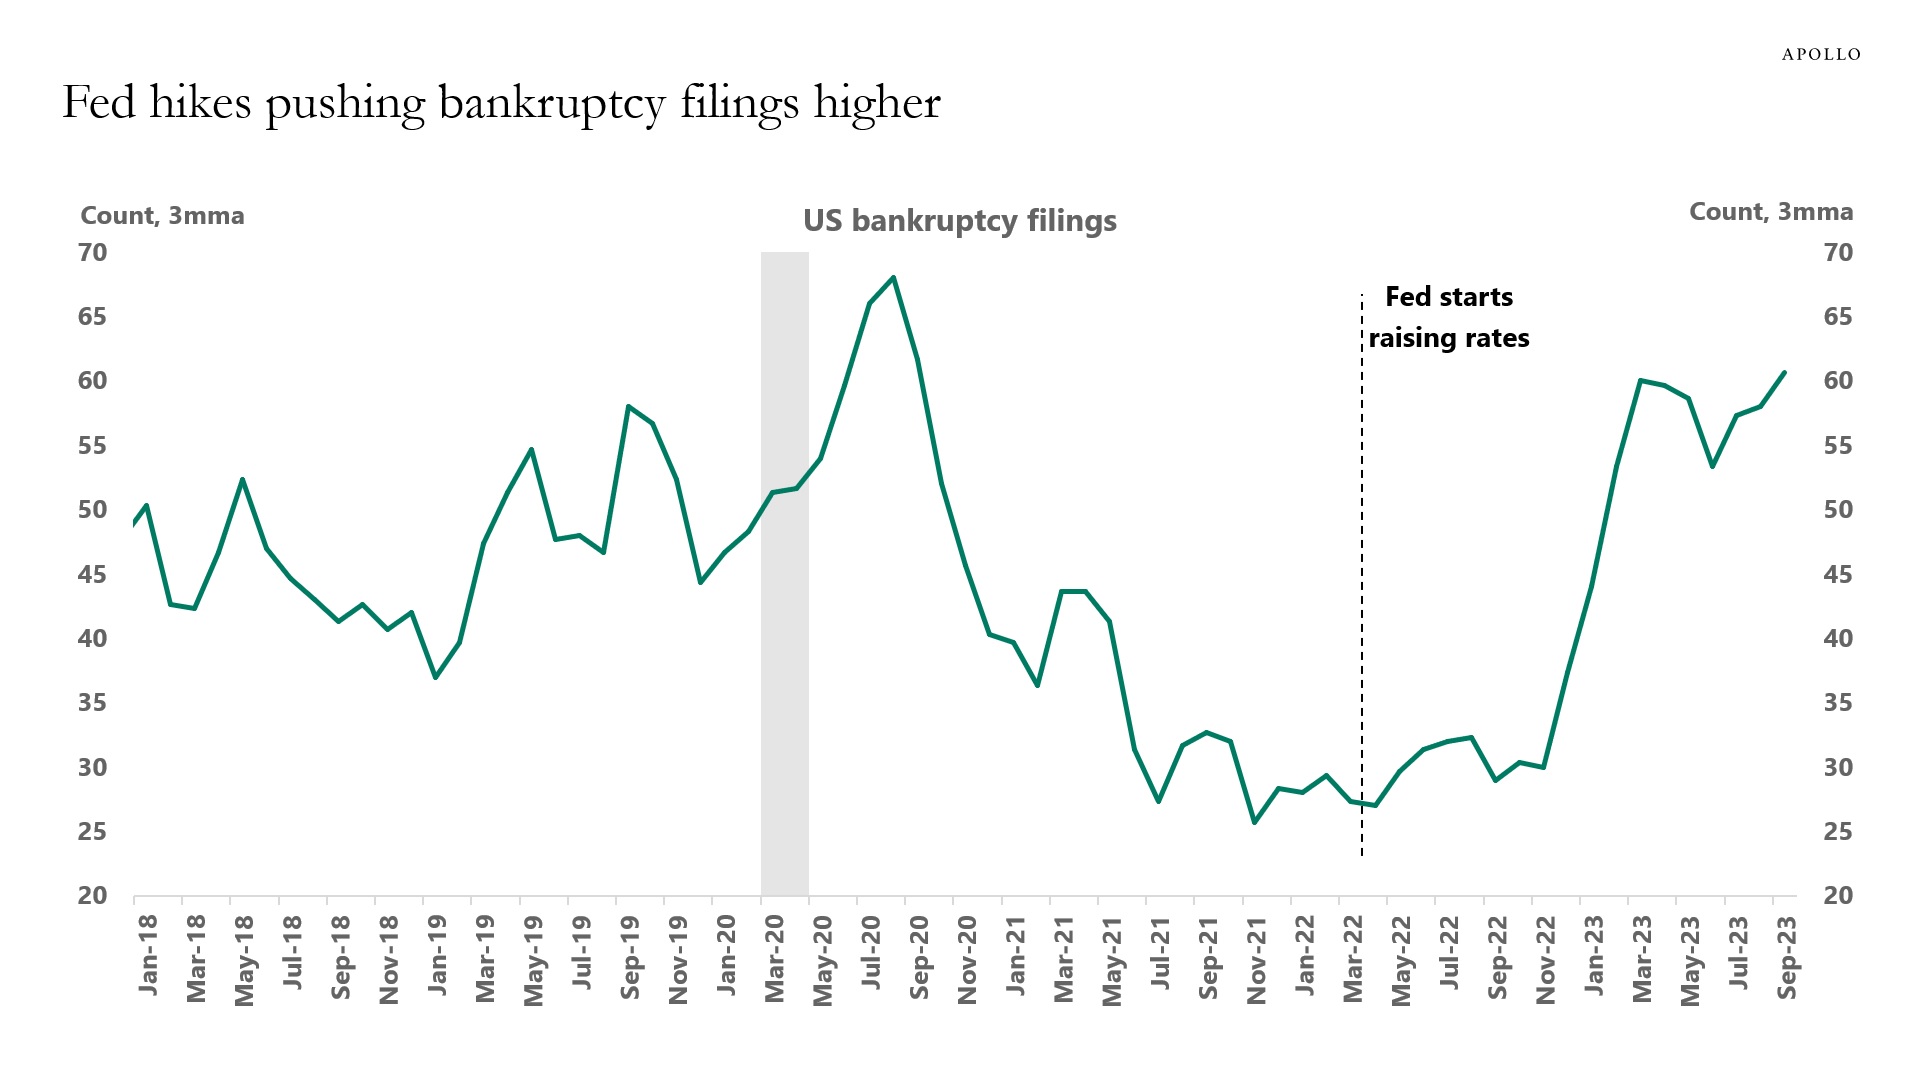
Source: S&P Capital IQ, Bloomberg, Apollo Chief Economist. Note: Bankruptcy figures include public companies or private companies with public debt with a minimum of $2 million in assets or liabilities at the time of filing, in addition to private companies with at least $10 million in assets or liabilities. 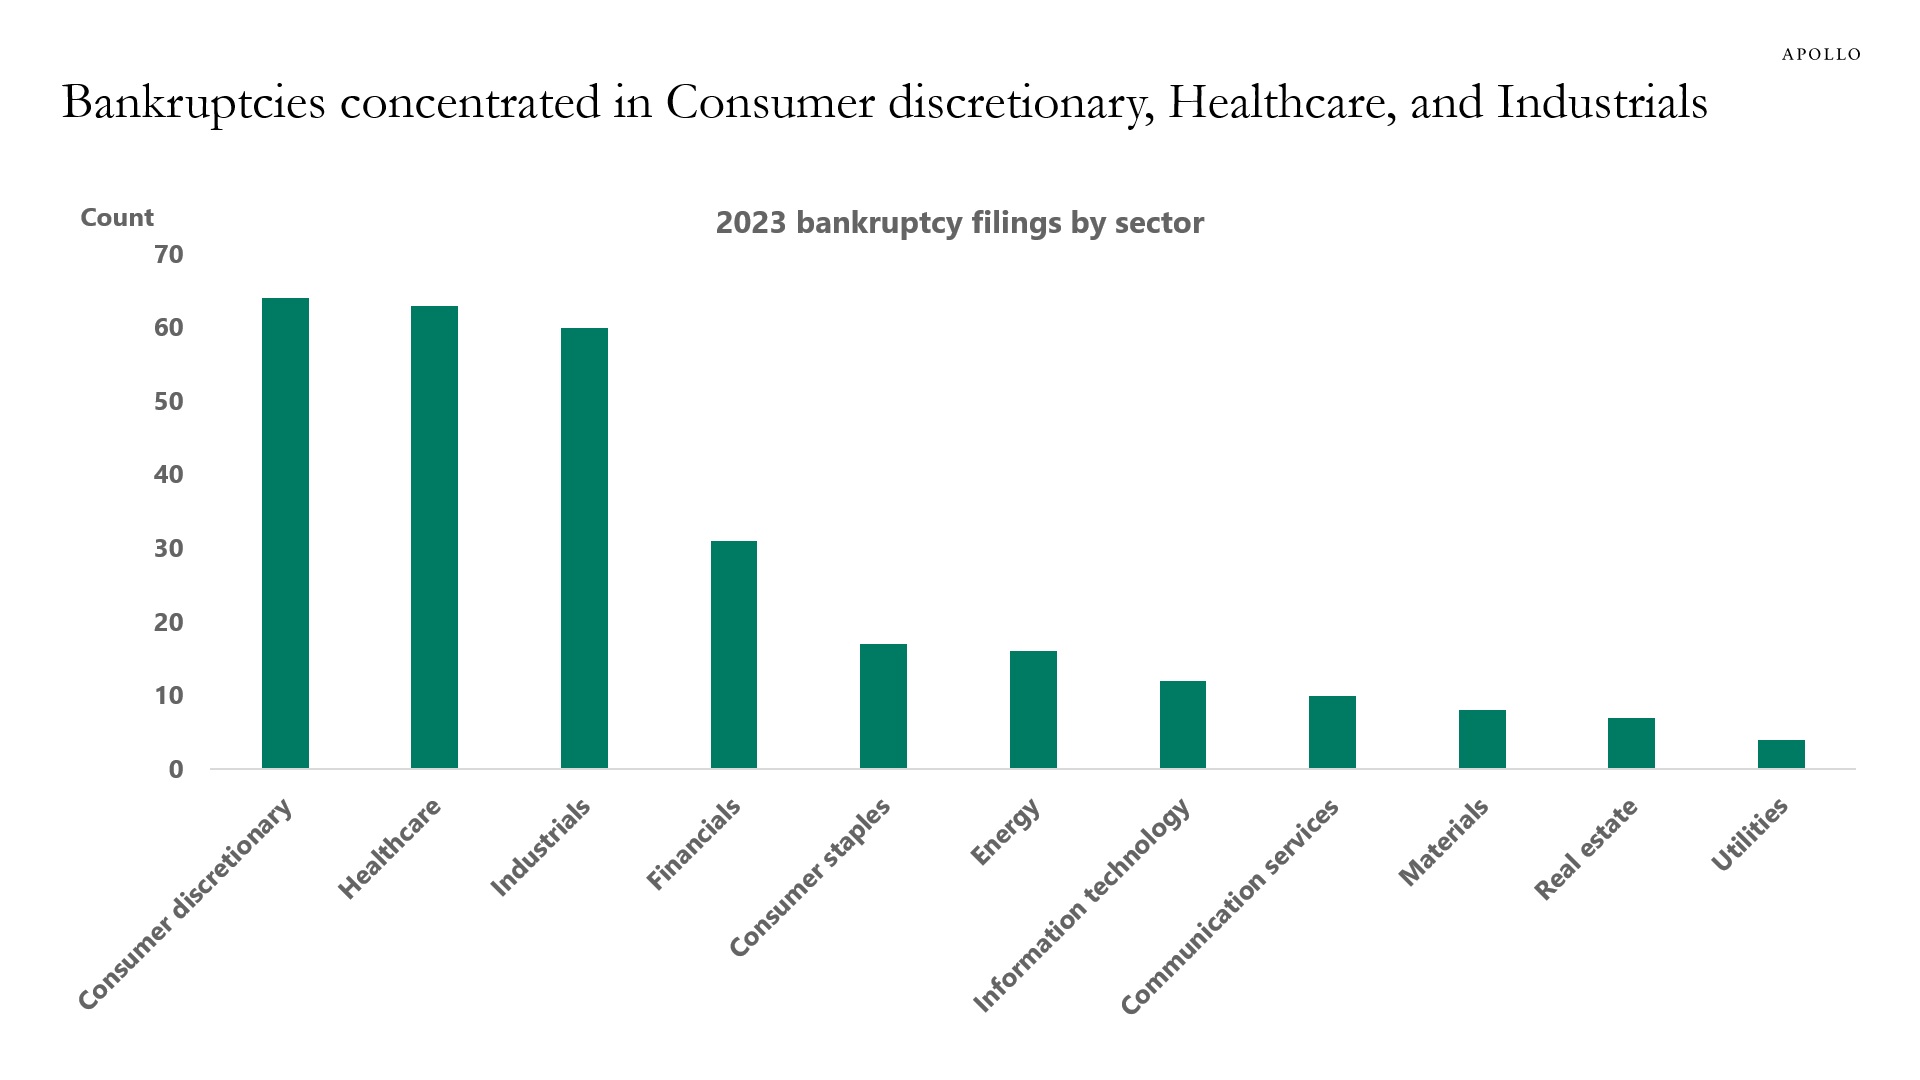
Source: S&P Capital IQ, Bloomberg, Apollo Chief Economist. Note: Bankruptcy figures include public companies or private companies with public debt with a minimum of $2 million in assets or liabilities at the time of filing, in addition to private companies with at least $10 million in assets or liabilities. Bankruptcies announced between January 1, 2023 and July 31, 2023. See important disclaimers at the bottom of the page.
-
The sectors that have higher refinancing needs in 2024 are Leisure, Retail, and Capital Goods in investment grade. And Transportation, Real Estate, and Autos in high yield, see charts below.
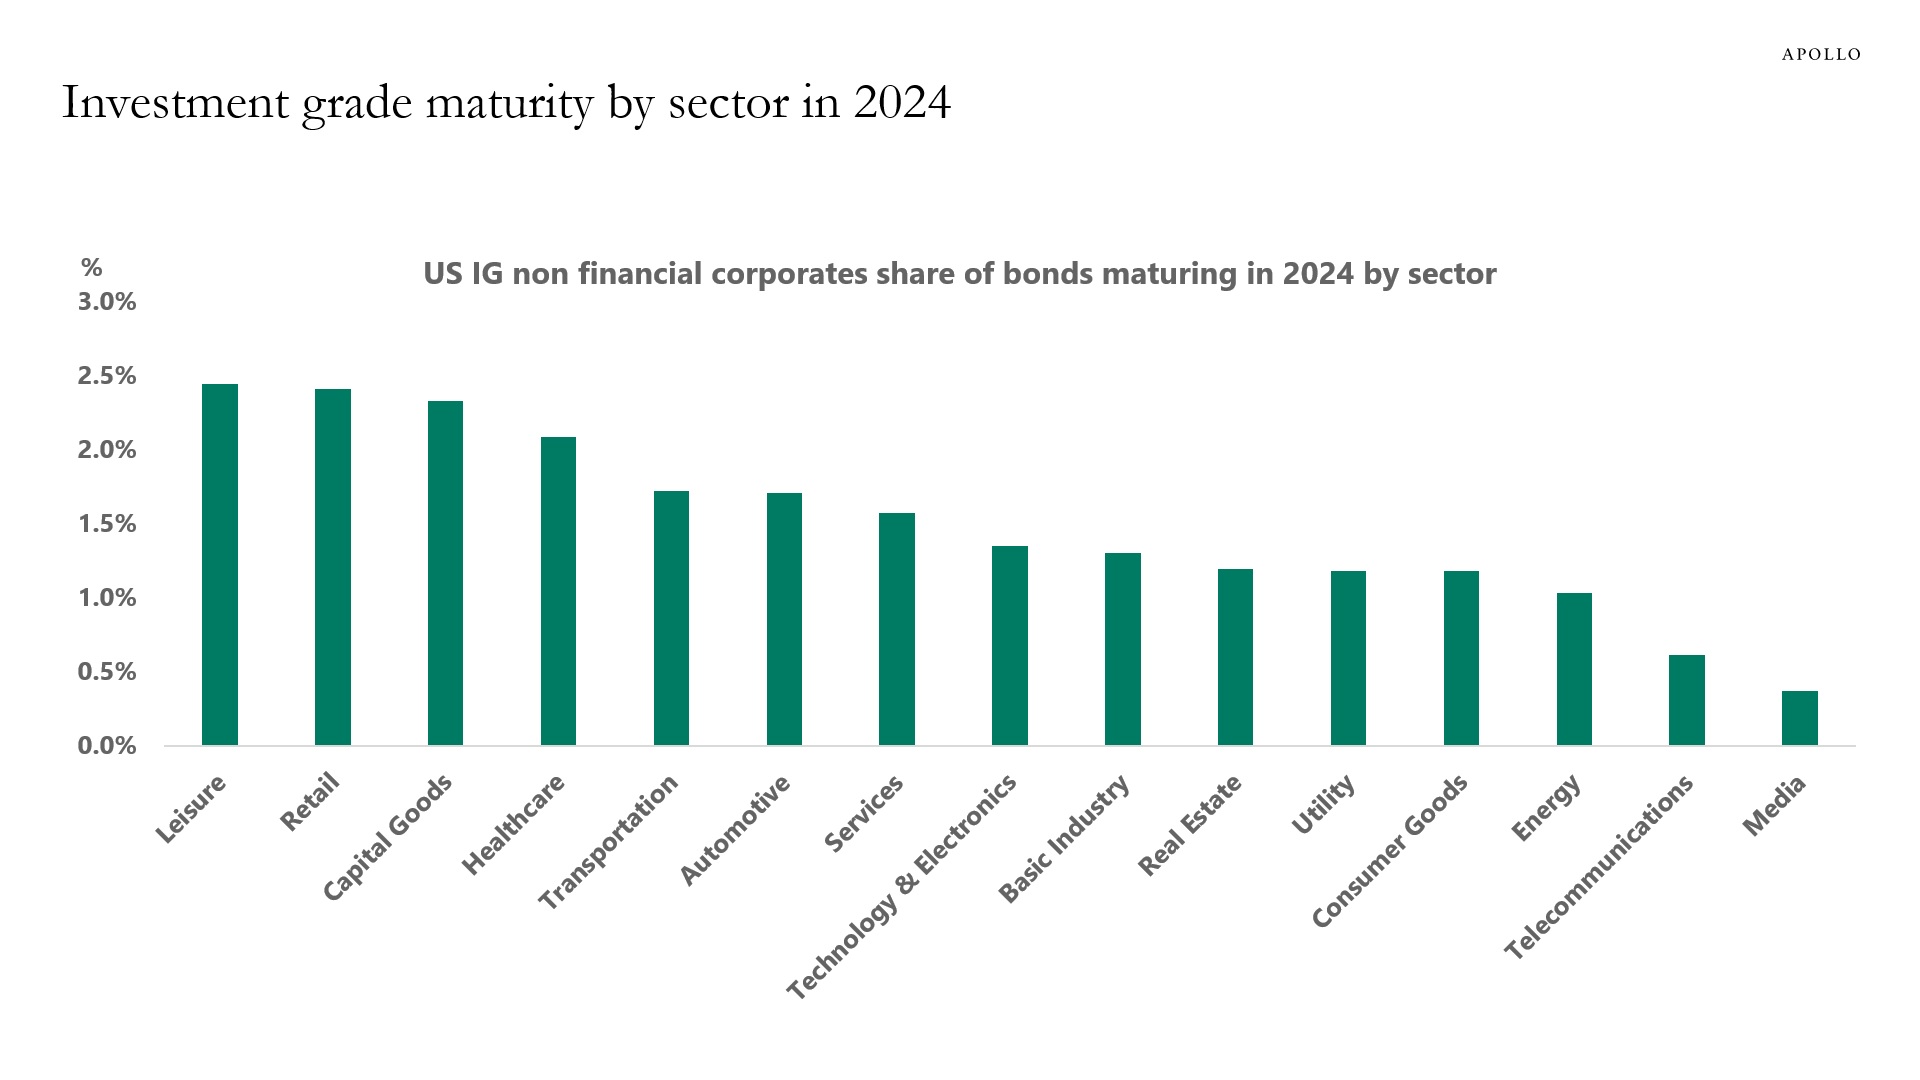
Source: ICE BofA, Bloomberg, Apollo Chief Economist 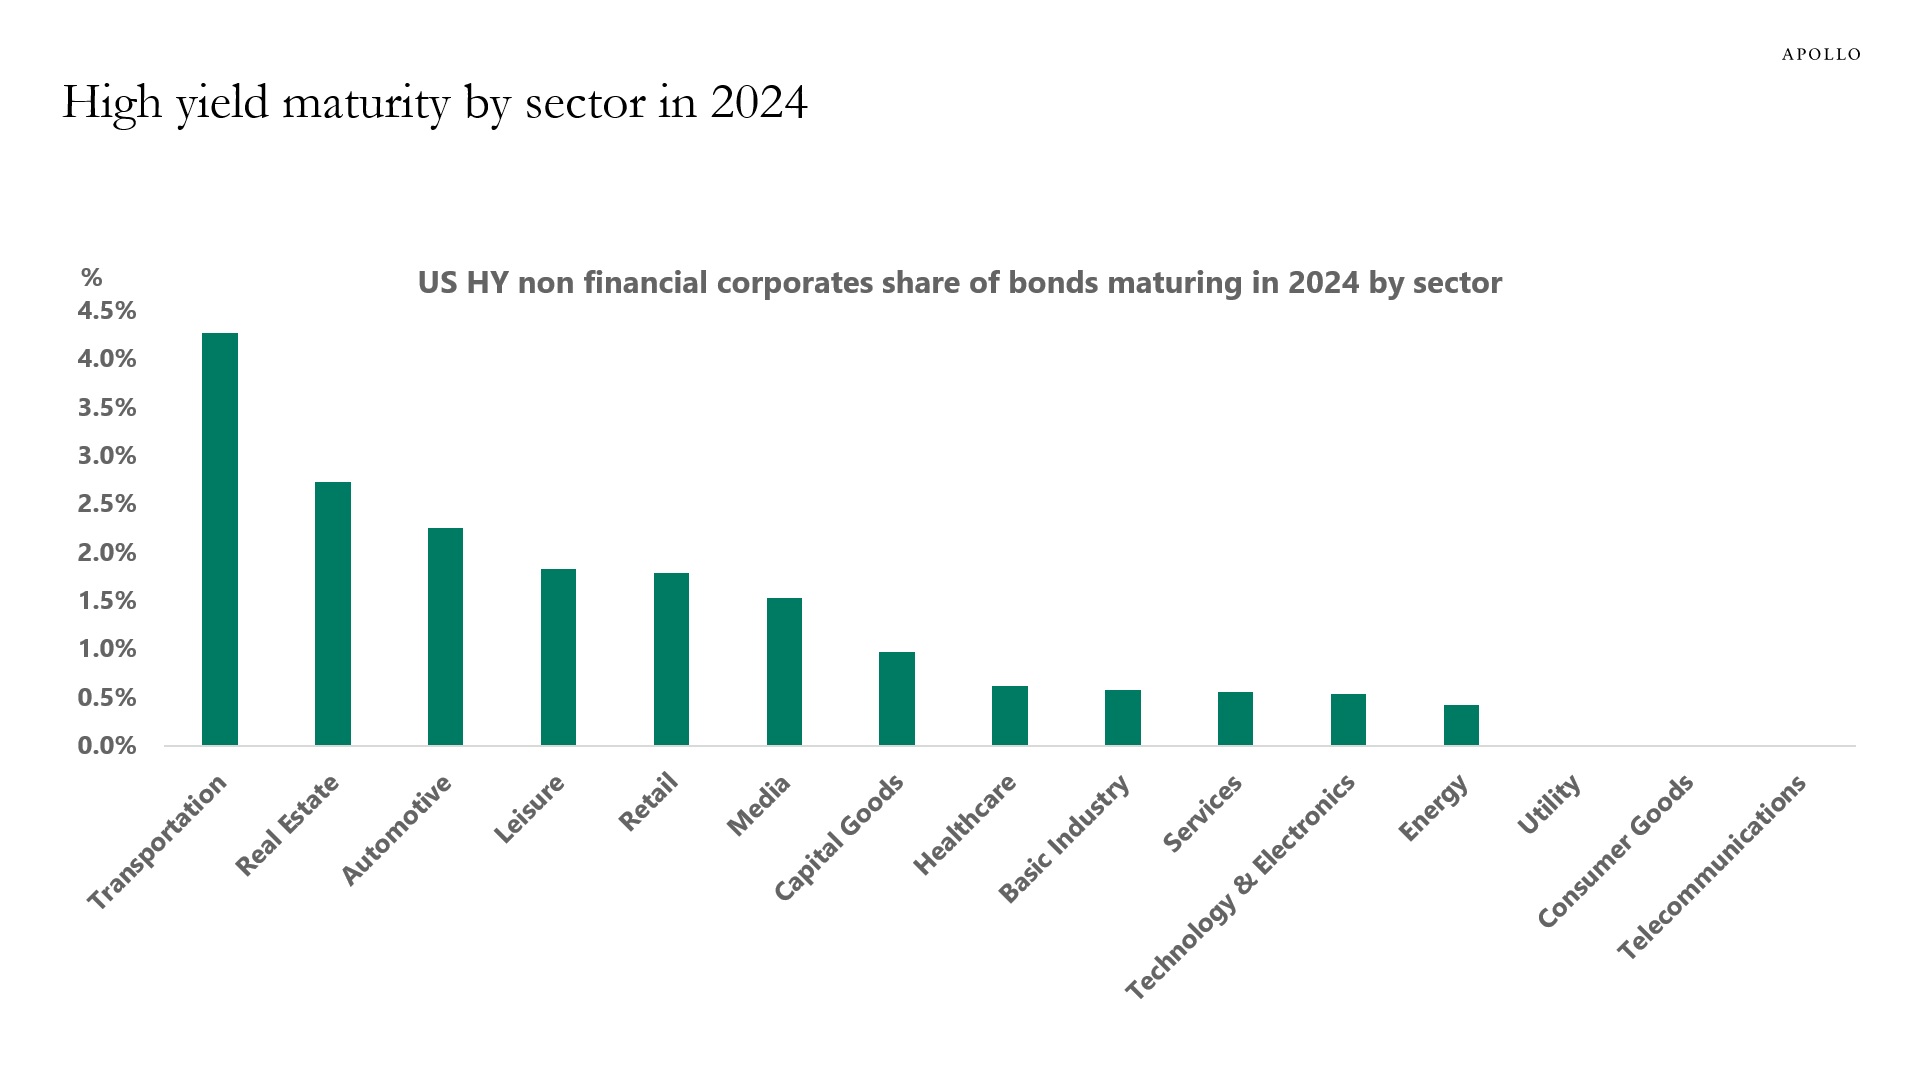
Source: ICE BofA, Bloomberg, Apollo Chief Economist See important disclaimers at the bottom of the page.
-
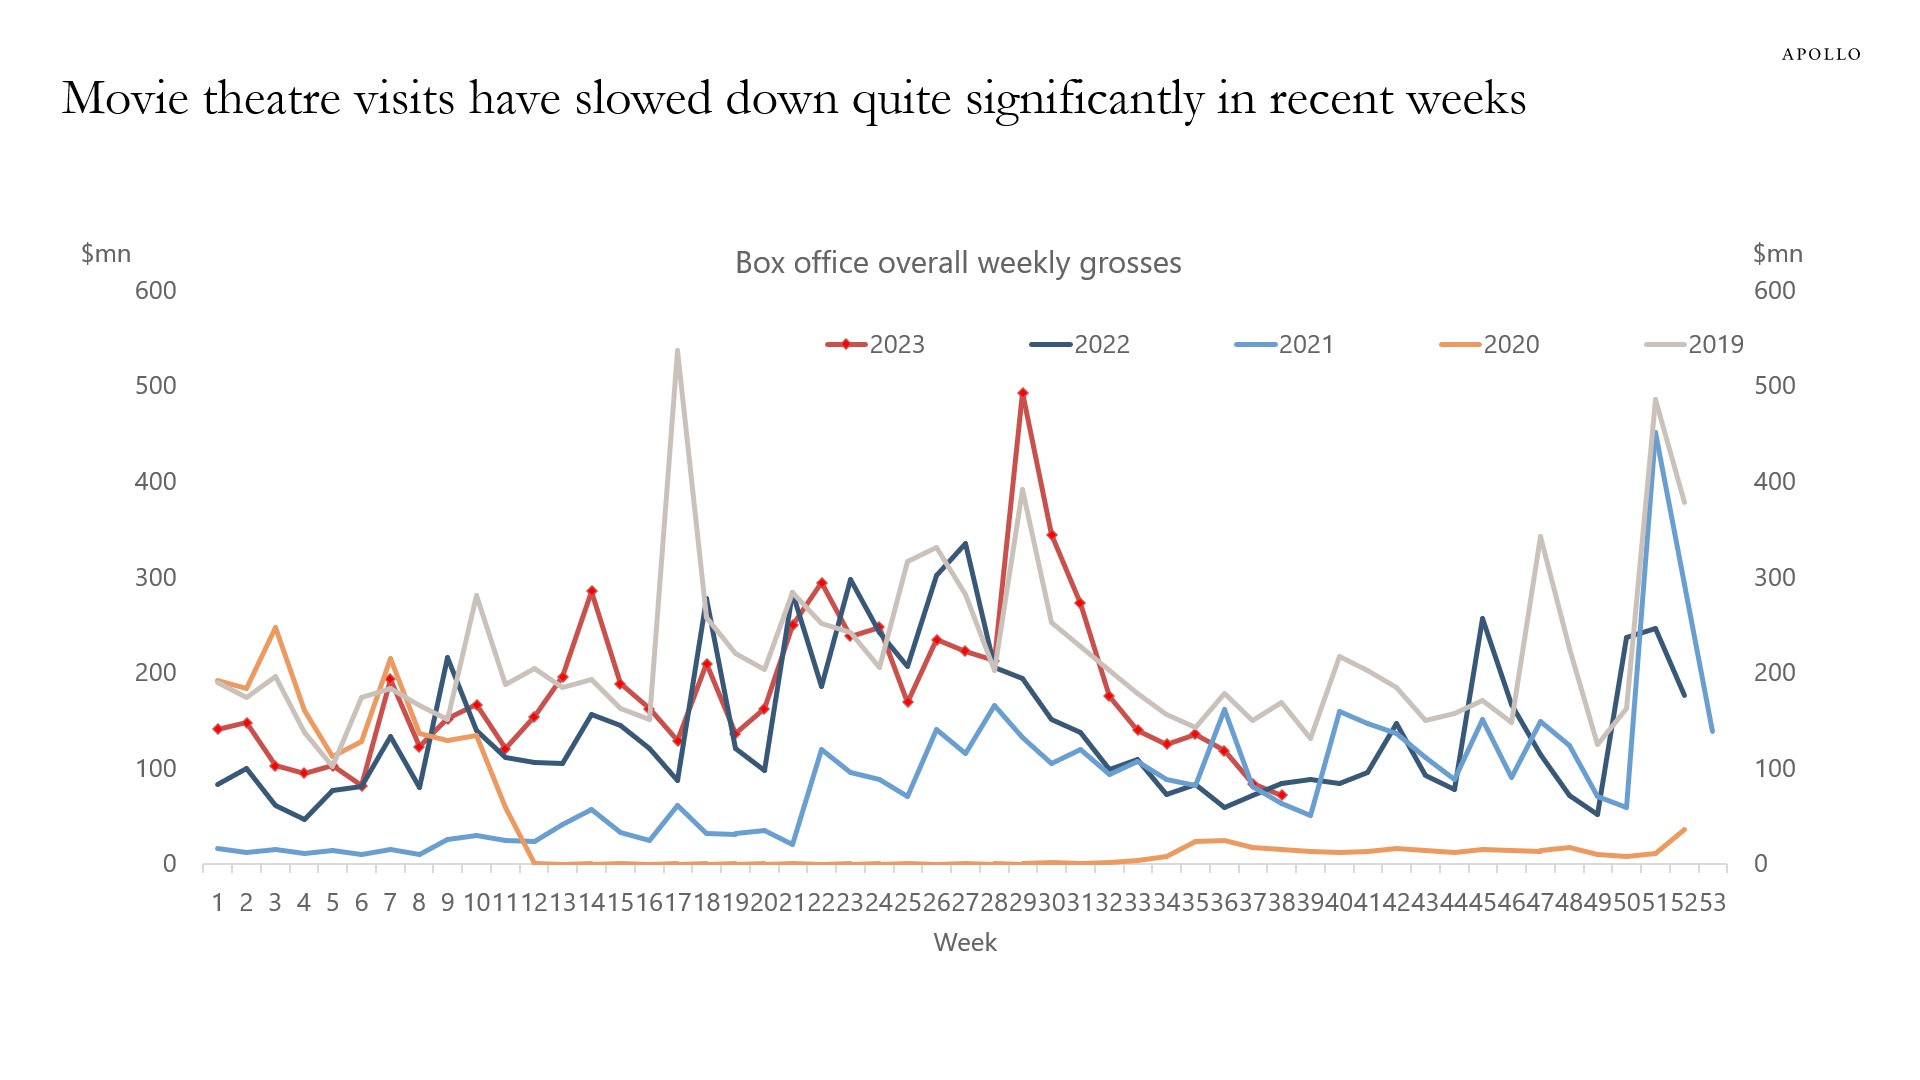
The number of people going to the movies has in recent weeks slowed down more than the usual seasonal pattern, see chart below.
Consumer services make up two-thirds of consumer spending, and watching for signs of a slowdown in consumer spending in the service sector is critical for markets.
Source: Boxofficemojo.com, Apollo Chief Economist See important disclaimers at the bottom of the page.
-
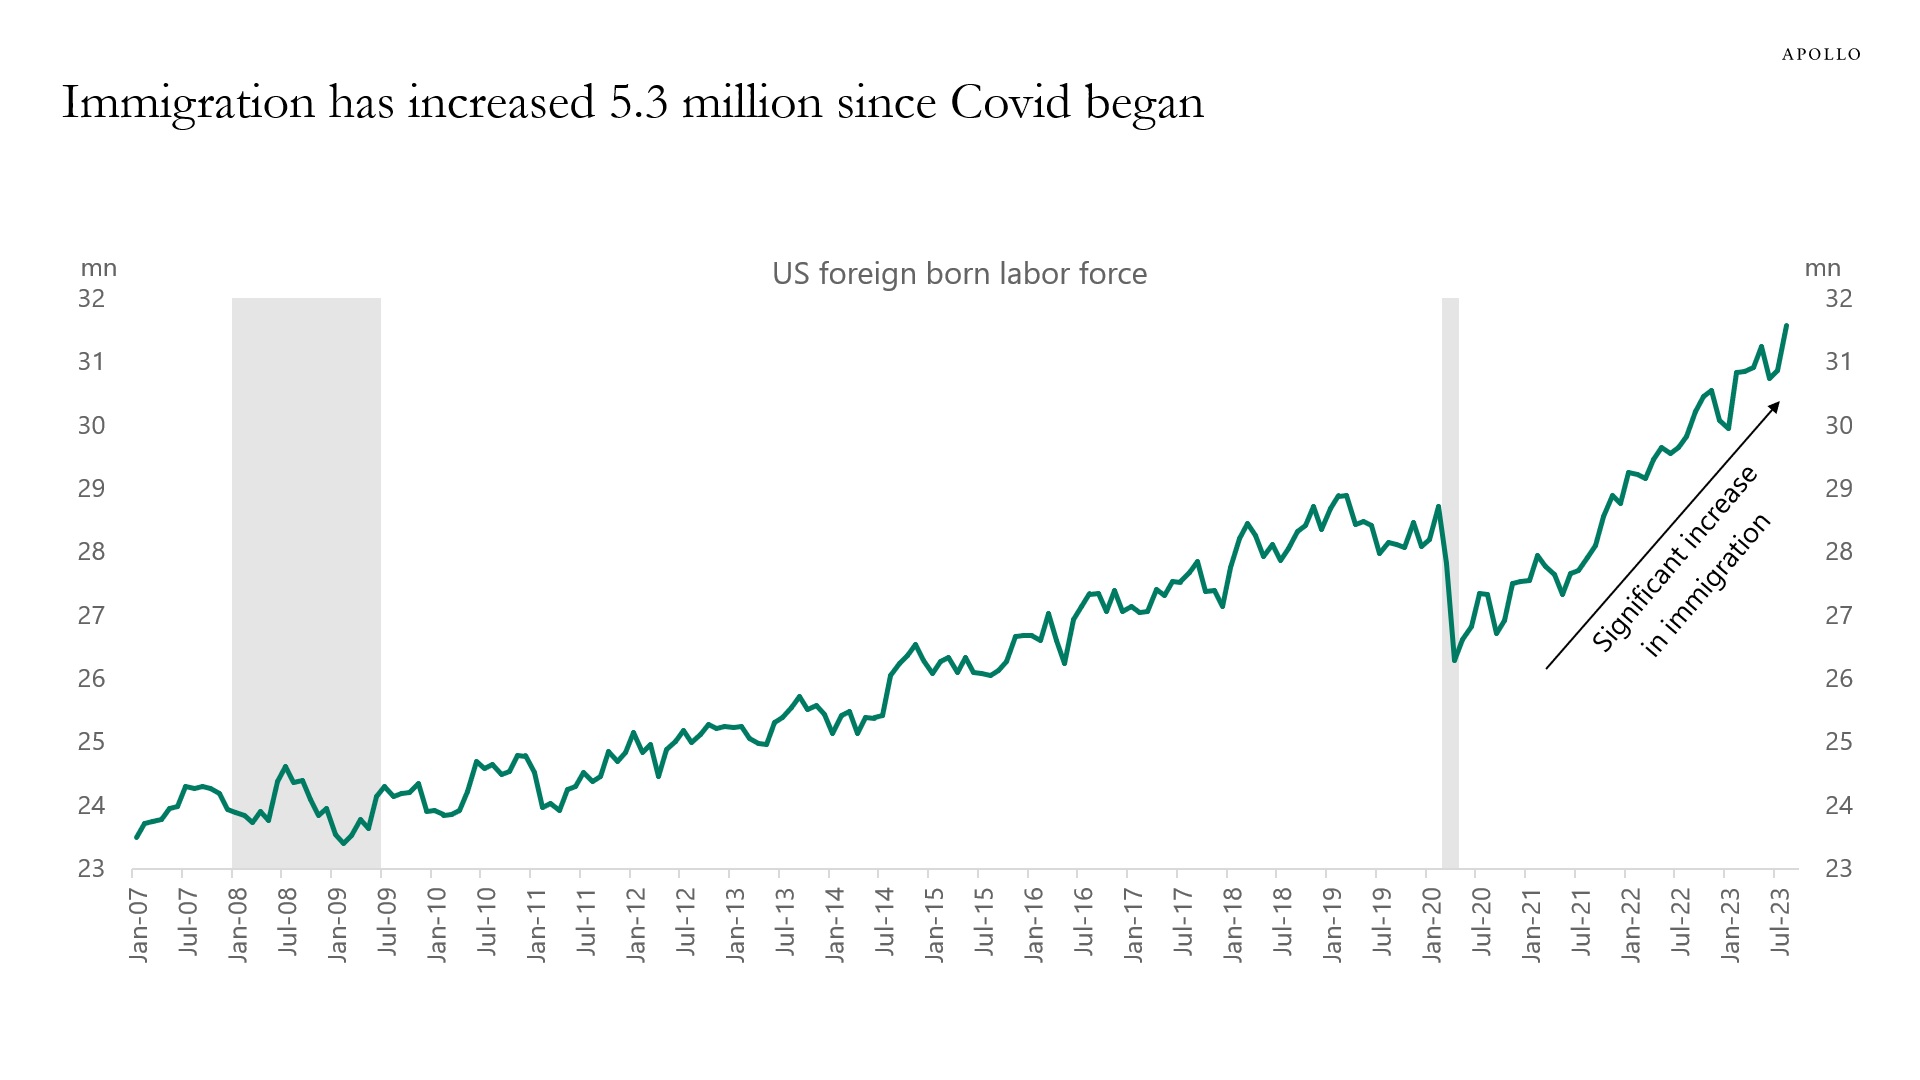
The number of foreigners in the labor force has increased by more than 5 million since April 2020, and a rise in immigration puts downward pressure on wage growth and hence inflation, see chart below.
Source: BLS, Haver Analytics, Apollo Chief Economist See important disclaimers at the bottom of the page.
-
Interest coverage ratios for September show that Fed hikes continue to have a more and more negative impact on the economy.
Specifically, with the Fed funds rate at 5.5%, we are significantly above the Fed’s 2.5% estimate of neutral, and as a result, monetary policy is biting harder and harder, and the incoming data continues to weaken.
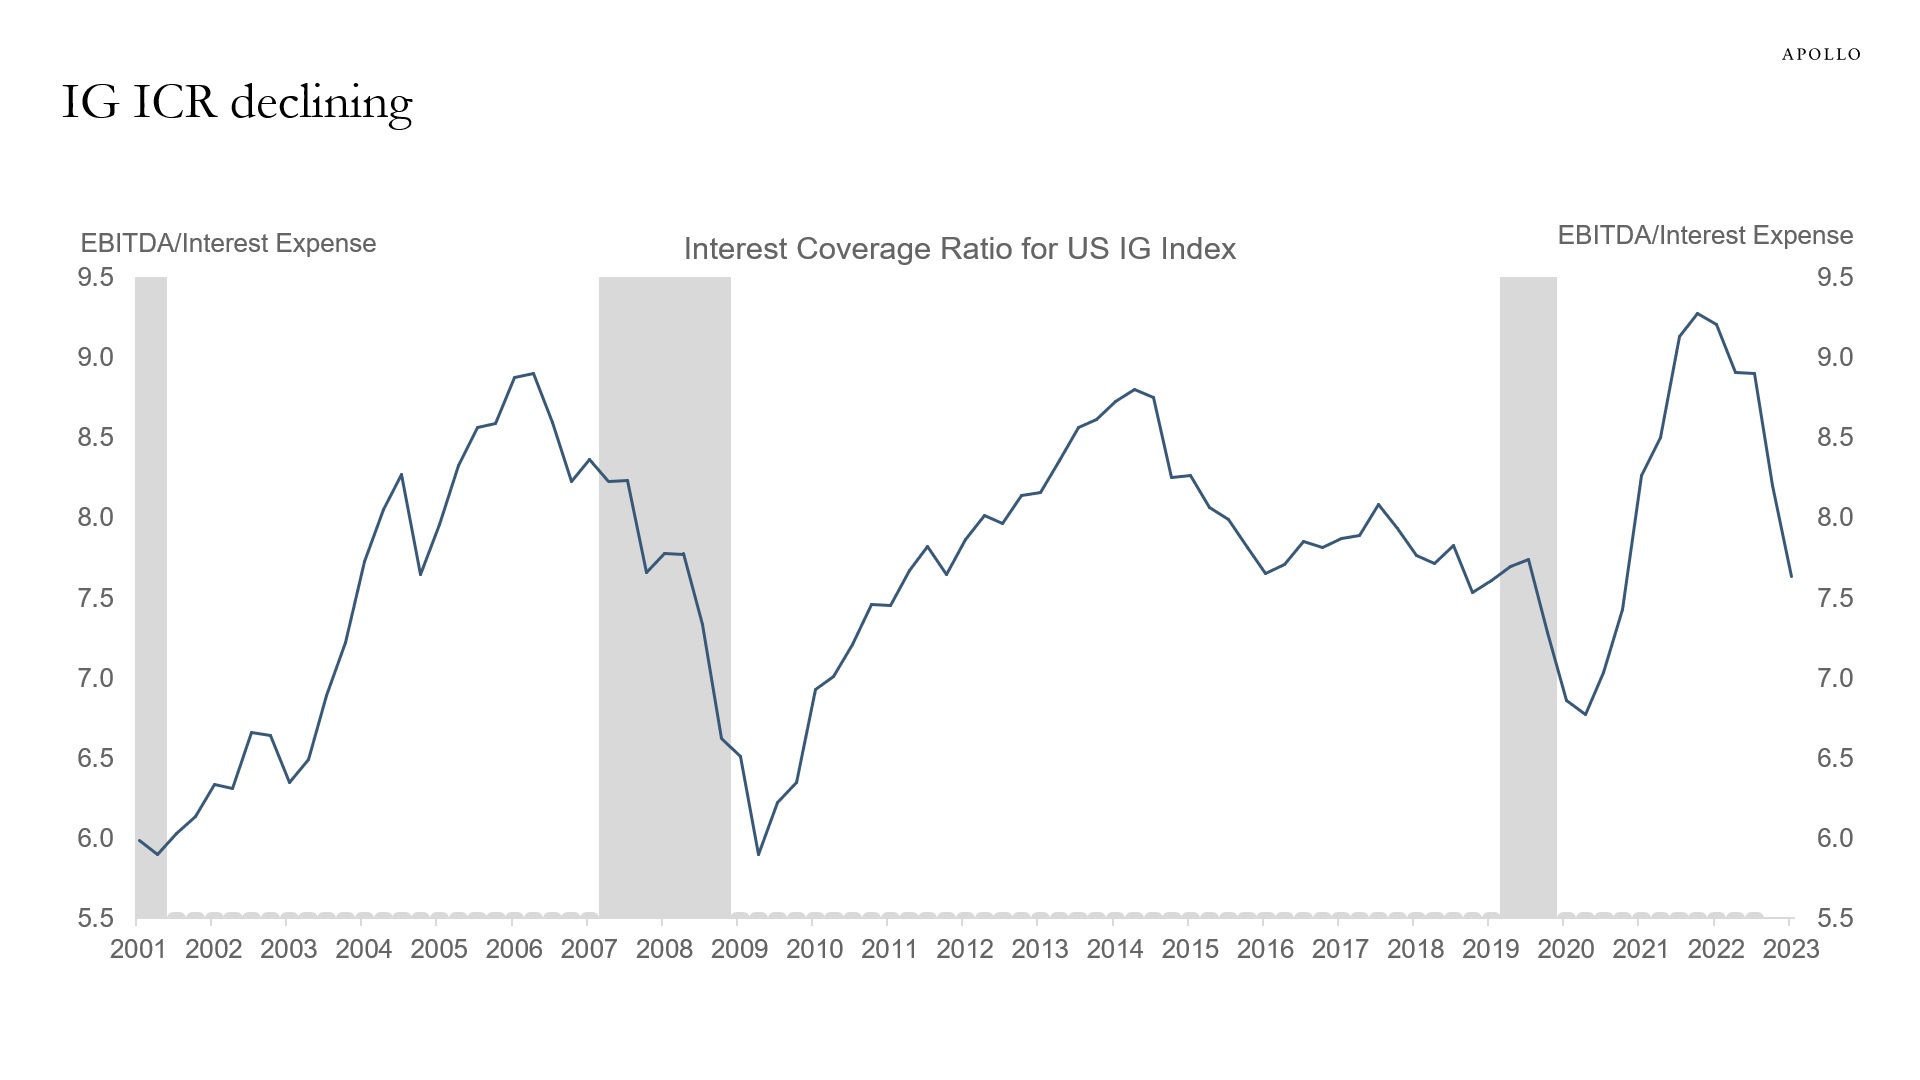
Source: Bloomberg, Apollo Chief Economist 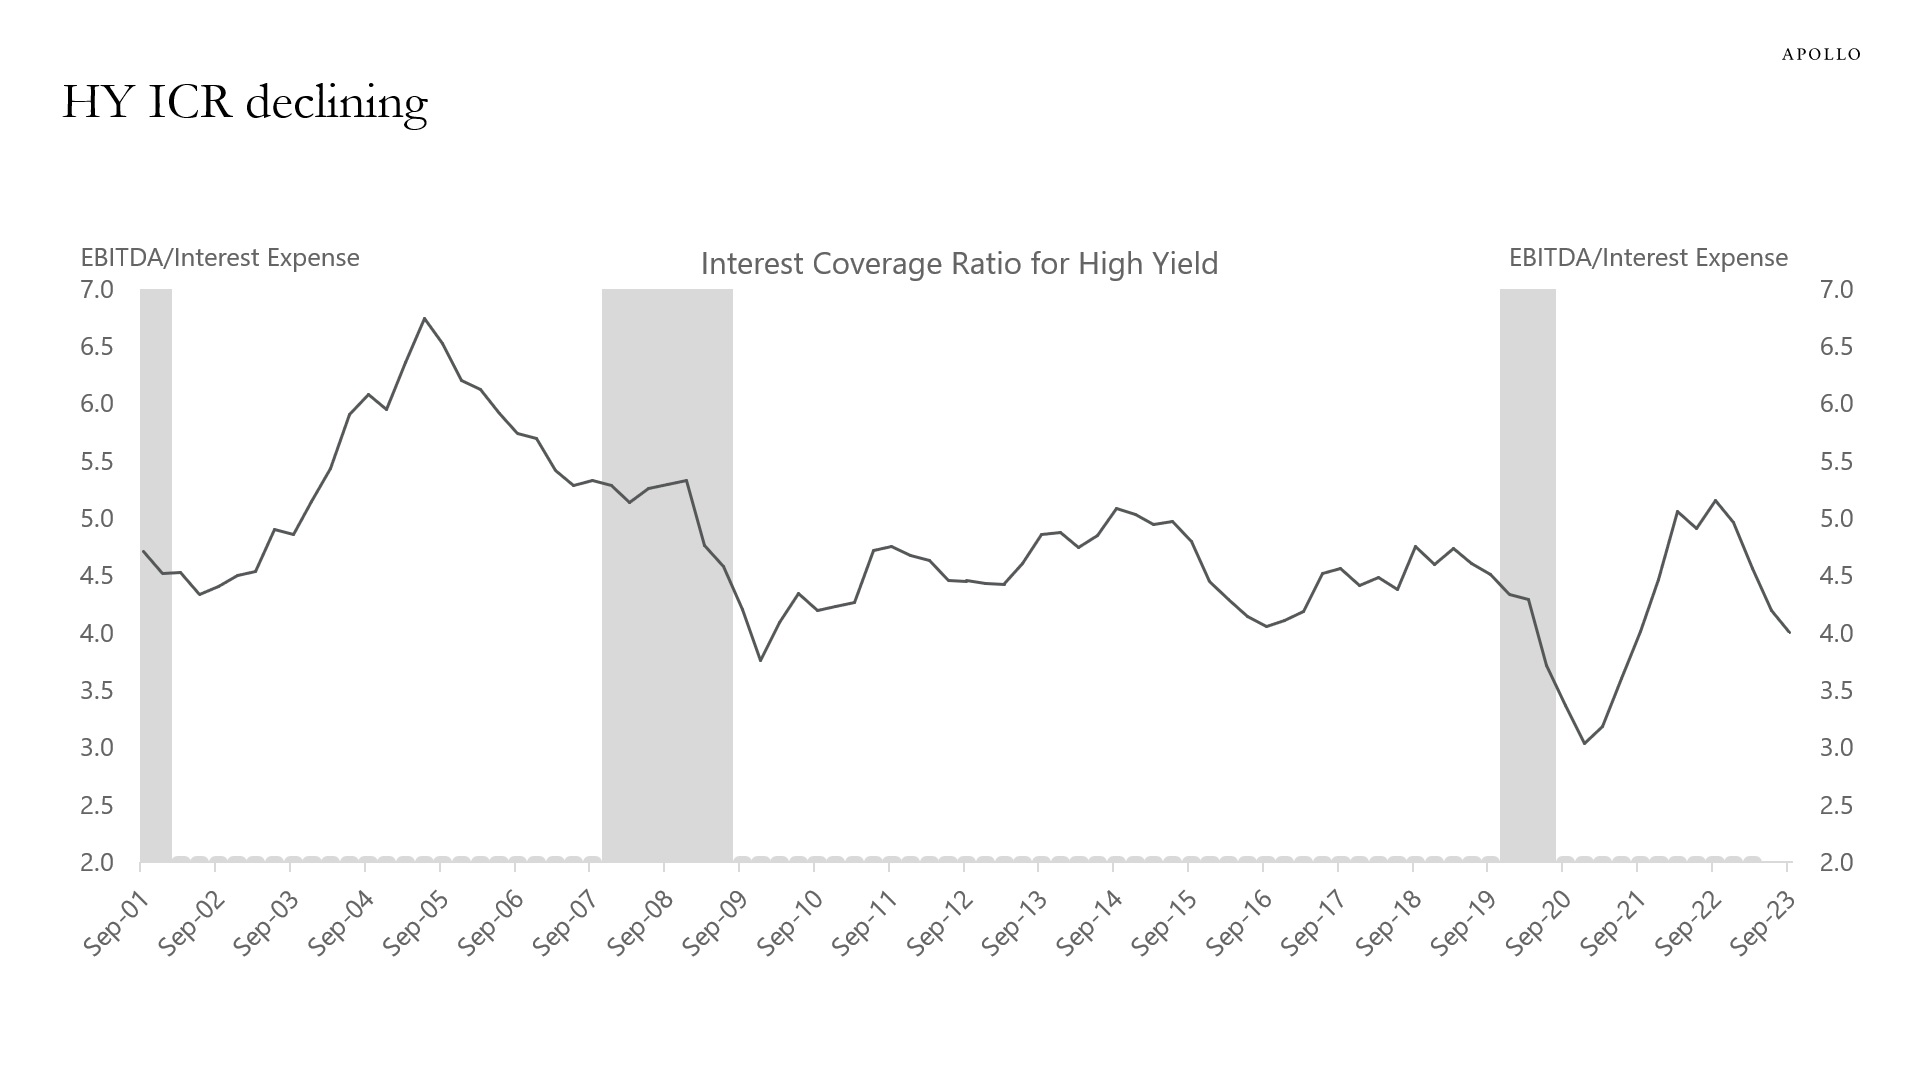
Source: Bloomberg, Apollo Chief Economist See important disclaimers at the bottom of the page.
-
The quality of the incoming economic data continues to deteriorate, see chart below.
For example, the response rate to the Current Employment Survey, which collects data on nonfarm payrolls, is below 50%, and the response rate to the JOLTS survey, which collects data on job openings, is around 30%.
The implication for markets is more adjustments, more revisions, and ultimately more volatile data.

Source: BLS, Apollo Chief Economist See important disclaimers at the bottom of the page.

This presentation may not be distributed, transmitted or otherwise communicated to others in whole or in part without the express consent of Apollo Global Management, Inc. (together with its subsidiaries, “Apollo”).
Apollo makes no representation or warranty, expressed or implied, with respect to the accuracy, reasonableness, or completeness of any of the statements made during this presentation, including, but not limited to, statements obtained from third parties. Opinions, estimates and projections constitute the current judgment of the speaker as of the date indicated. They do not necessarily reflect the views and opinions of Apollo and are subject to change at any time without notice. Apollo does not have any responsibility to update this presentation to account for such changes. There can be no assurance that any trends discussed during this presentation will continue.
Statements made throughout this presentation are not intended to provide, and should not be relied upon for, accounting, legal or tax advice and do not constitute an investment recommendation or investment advice. Investors should make an independent investigation of the information discussed during this presentation, including consulting their tax, legal, accounting or other advisors about such information. Apollo does not act for you and is not responsible for providing you with the protections afforded to its clients. This presentation does not constitute an offer to sell, or the solicitation of an offer to buy, any security, product or service, including interest in any investment product or fund or account managed or advised by Apollo.
Certain statements made throughout this presentation may be “forward-looking” in nature. Due to various risks and uncertainties, actual events or results may differ materially from those reflected or contemplated in such forward-looking information. As such, undue reliance should not be placed on such statements. Forward-looking statements may be identified by the use of terminology including, but not limited to, “may”, “will”, “should”, “expect”, “anticipate”, “target”, “project”, “estimate”, “intend”, “continue” or “believe” or the negatives thereof or other variations thereon or comparable terminology.