


Want it delivered daily to your inbox?
-
The University of Michigan asks consumers about credit conditions, and the chart below shows that even before the SVB situation, credit conditions had tightened to levels last seen in 2008, see chart below.
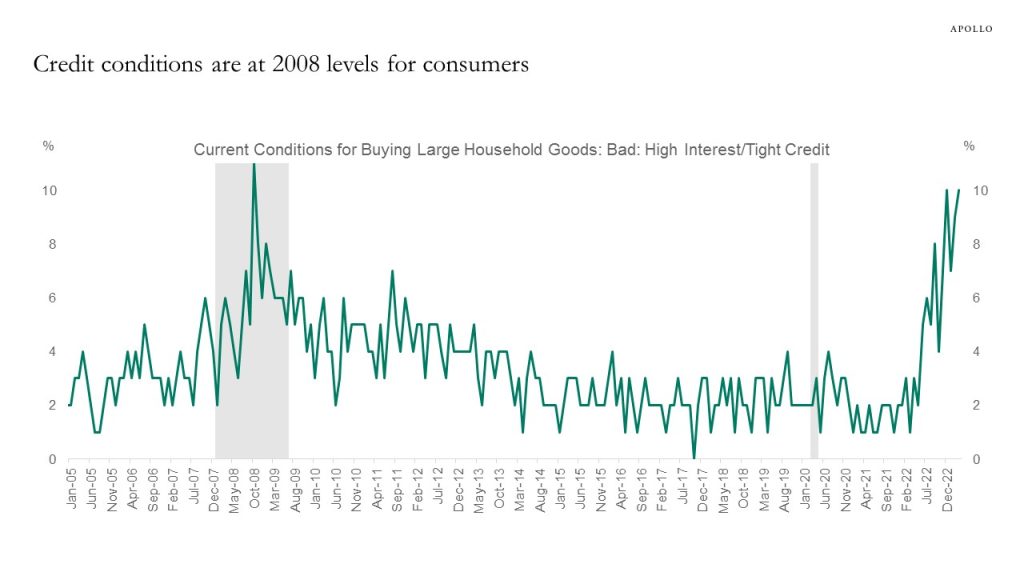
Source: University of Michigan, Haver Analytics, Apollo Chief Economist See important disclaimers at the bottom of the page.
-
SVB is likely to have a more negative impact on the economy than Orange County, LTCM, and the UK LDI episode because what happened with SVB will change the behavior of regional banks.
Most importantly, the costs of capital have increased, and underwriting standards have tightened.
Our updated outlook for credit markets is available here.
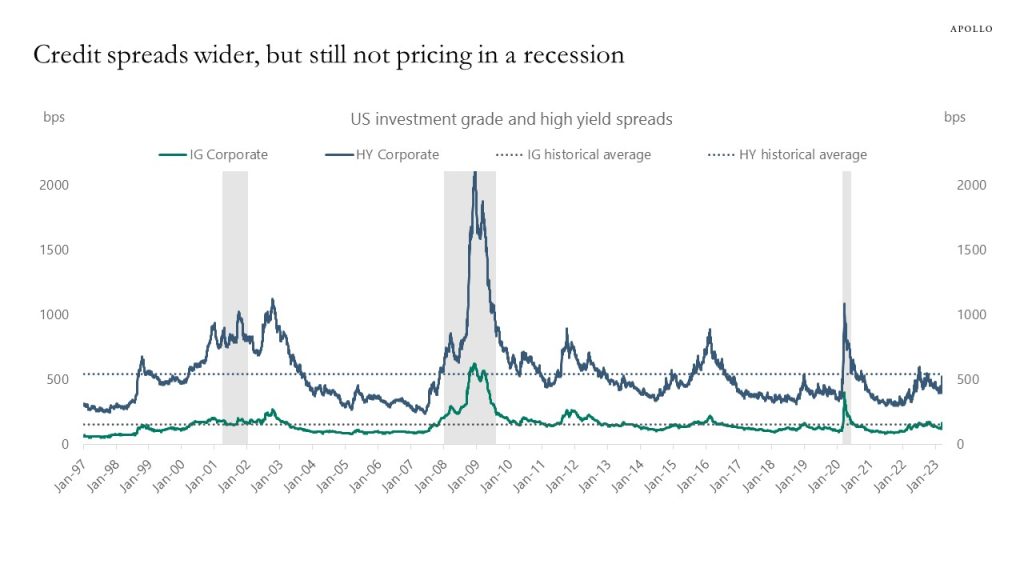
Source: ICE BofA, Bloomberg, Apollo Chief Economist See important disclaimers at the bottom of the page.
-
Since the Fed began to raise interest rates a year ago, the amount of money in money market funds has increased by roughly $400bn, and the inflows increased by more than $100bn last week, see chart below.
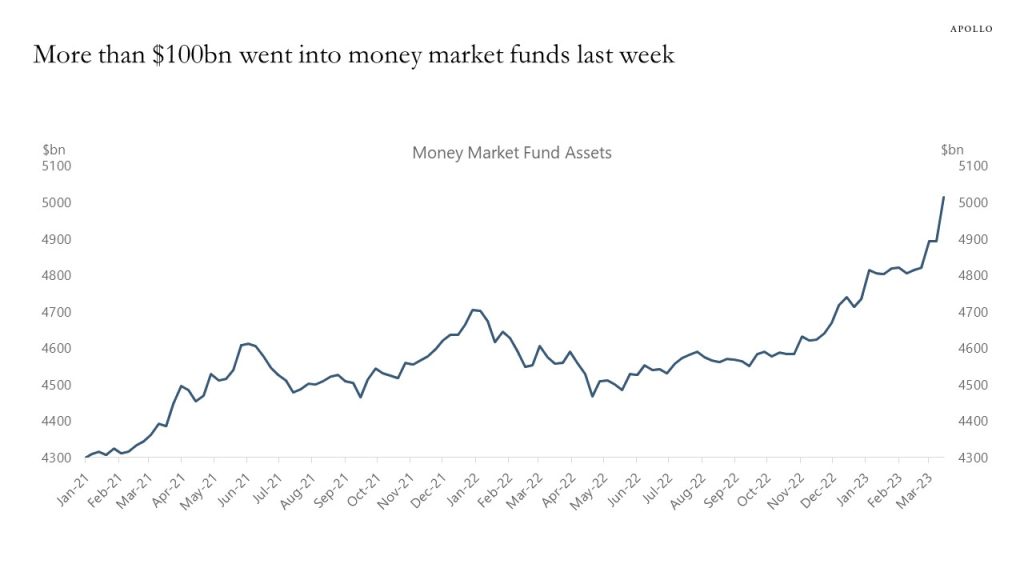
Source: Bloomberg See important disclaimers at the bottom of the page.
-
Regional banks are impacted by higher funding costs, deposit risks, regulatory pressures, and asset declines, including future credit losses from the lagged effects of Fed hikes, and these forces combined are likely to result in tighter credit conditions. Our weekly banking sector chart book is available here, key charts inserted below.
Source: Apollo Chief Economist. Represents the views and opinions of Apollo’s Chief Economist. Subject to change at any time without notice. 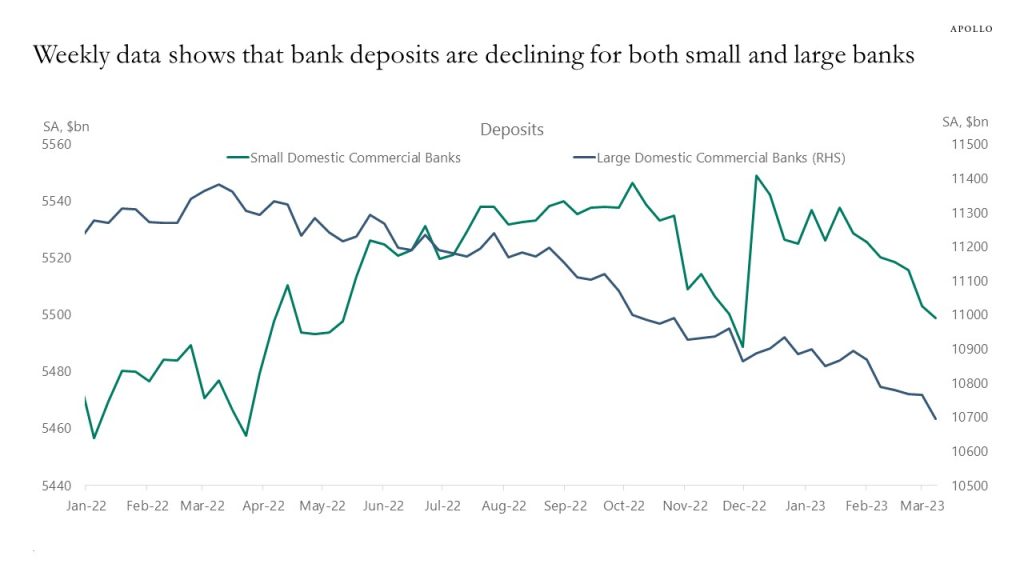
Source: Federal Reserve Board, Haver Analytics, Apollo Chief Economist 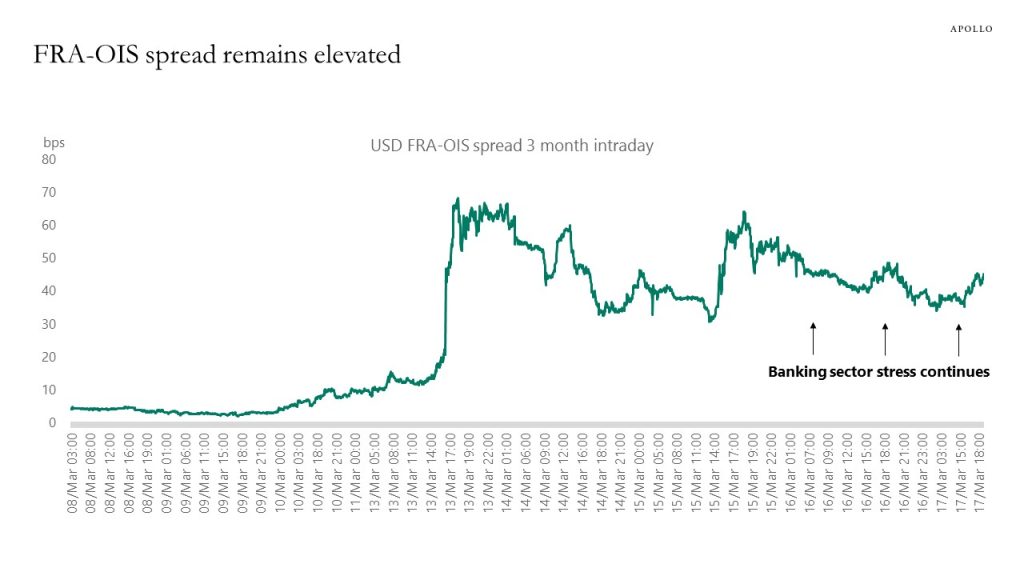
Source: Bloomberg. Note: Ticker used USFOSC1 BGN Currency. As of March 13, 2023. 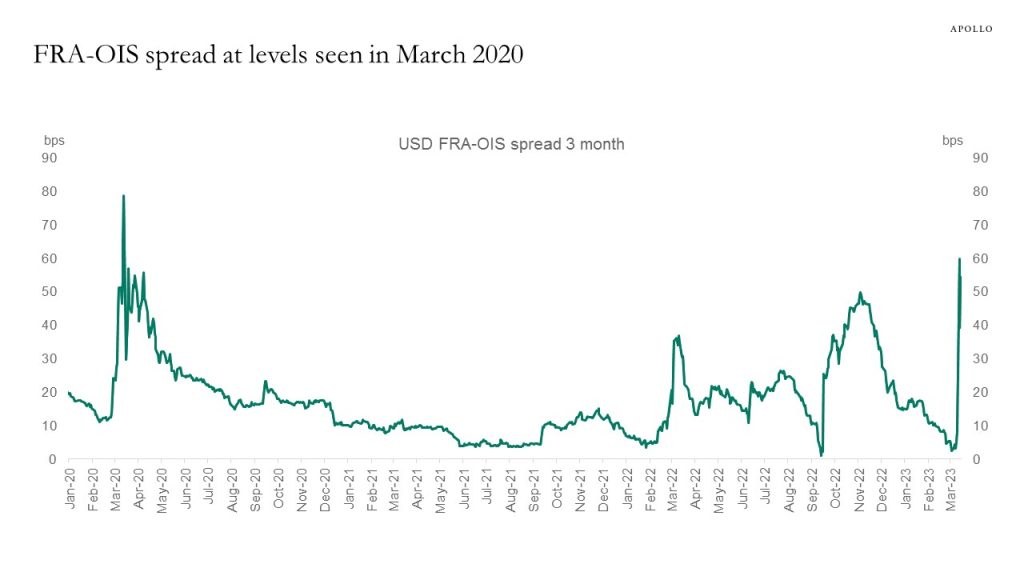
Source: Bloomberg. Note: Ticker used USFOSC1 BGN Currency. As of March 13, 2023. 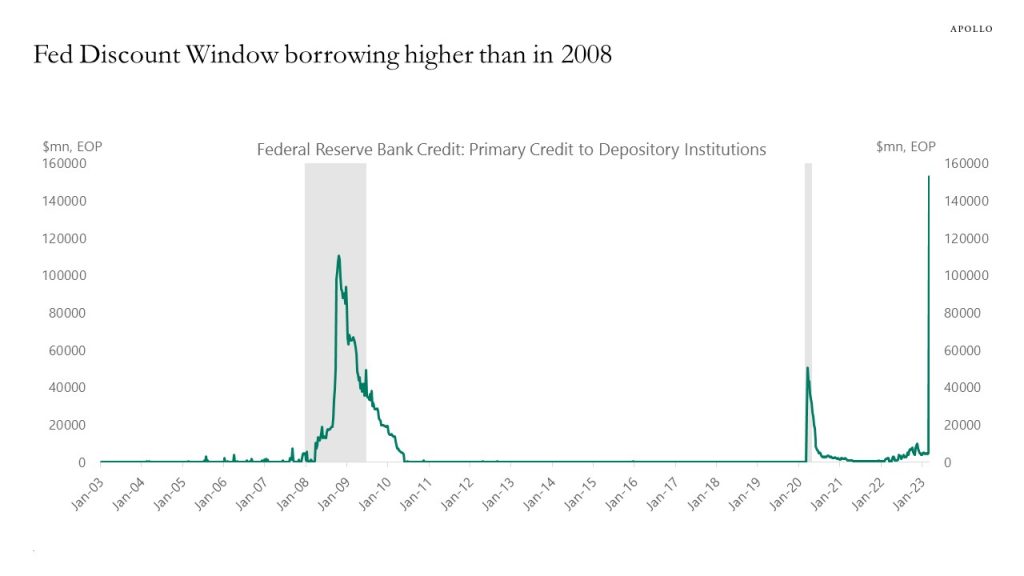
Source: Federal Reserve Board, Haver Analytics, Apollo Chief Economist 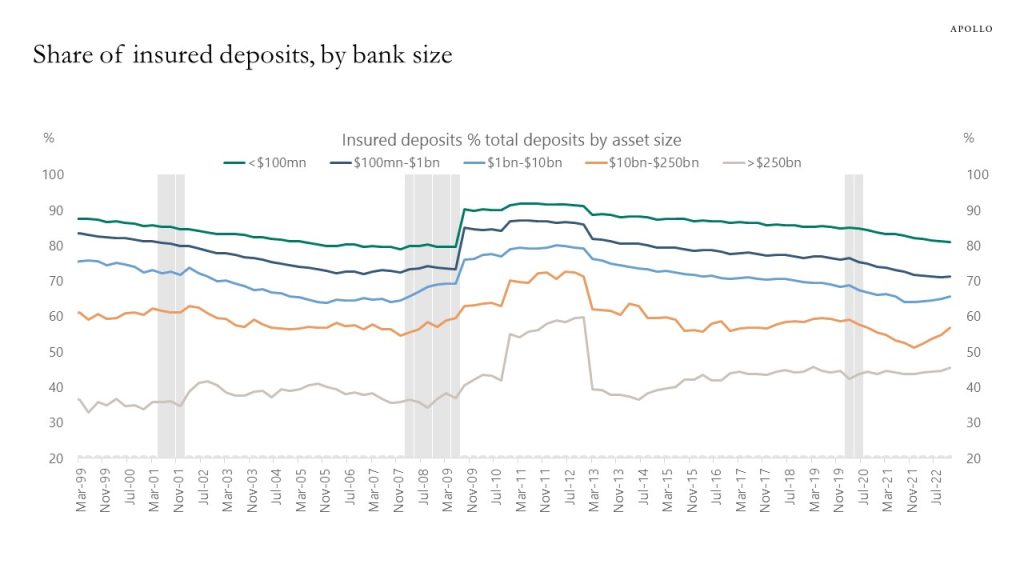
Source: Federal Reserve Board, Haver Analytics, Apollo Chief Economist 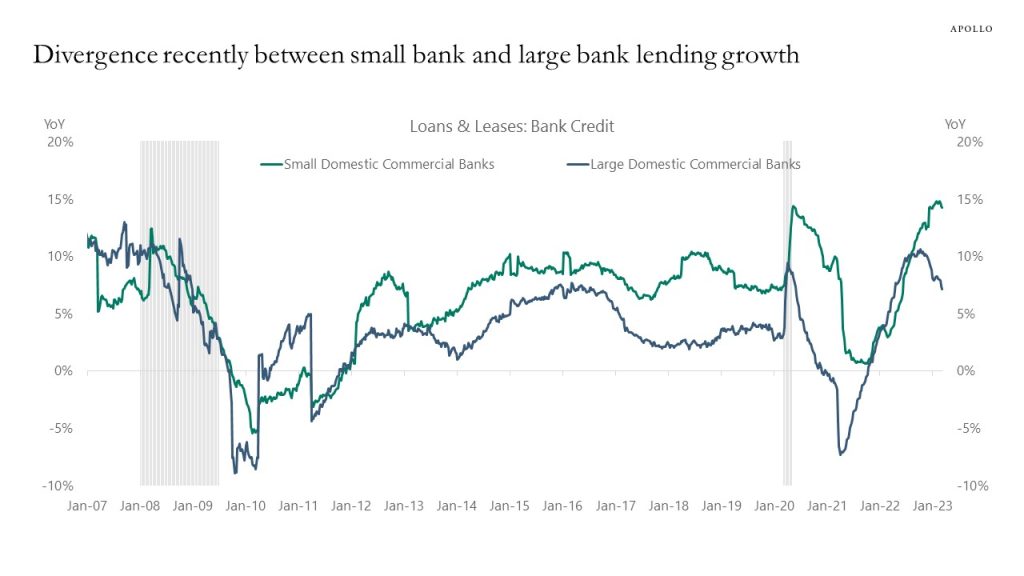
Source: Federal Reserve Board, Haver Analytics, Apollo Chief Economist 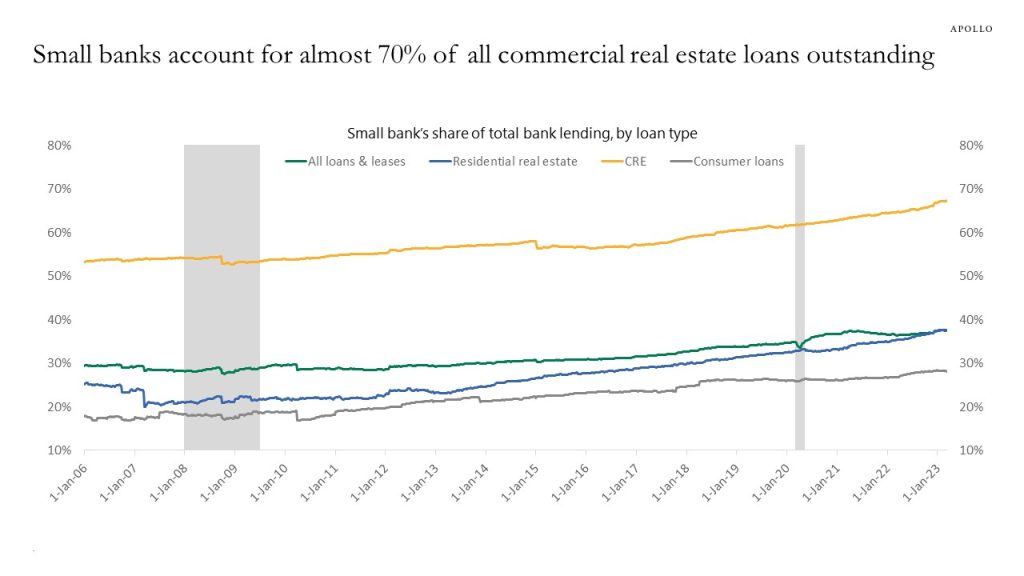
Source: Federal Reserve Board, Haver Analytics, Apollo Chief Economist 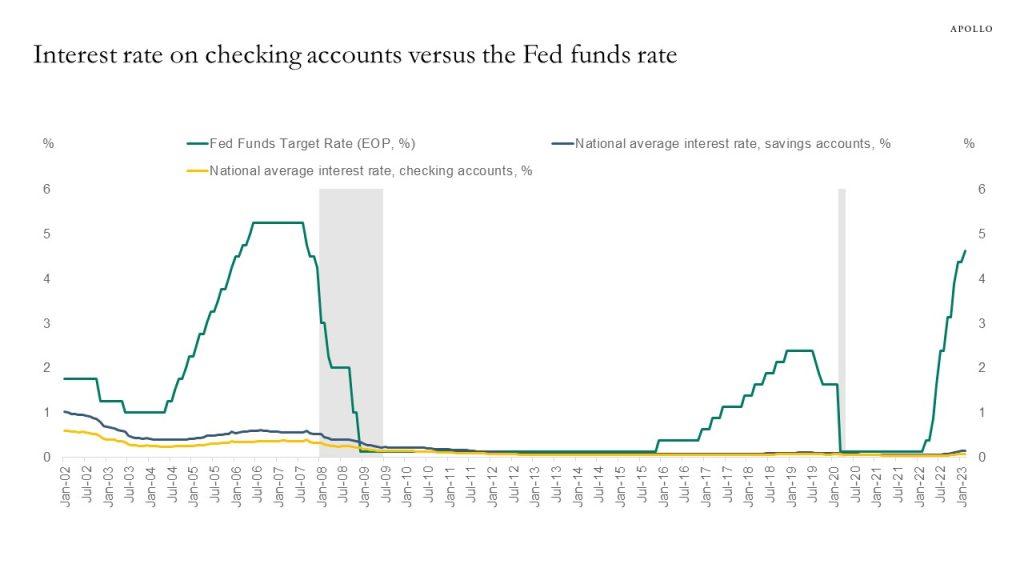
Source: FRB, RateWatch, Haver Analytics, Apollo Chief Economist See important disclaimers at the bottom of the page.
-
Quantifying the impact of tighter financial conditions plus tighter lending standards, we estimate that the events this past week correspond to a 1.5% increase in the Fed funds rate. In other words, over the past week, monetary conditions have tightened to a degree where the risks of a sharper slowdown in the economy have increased.
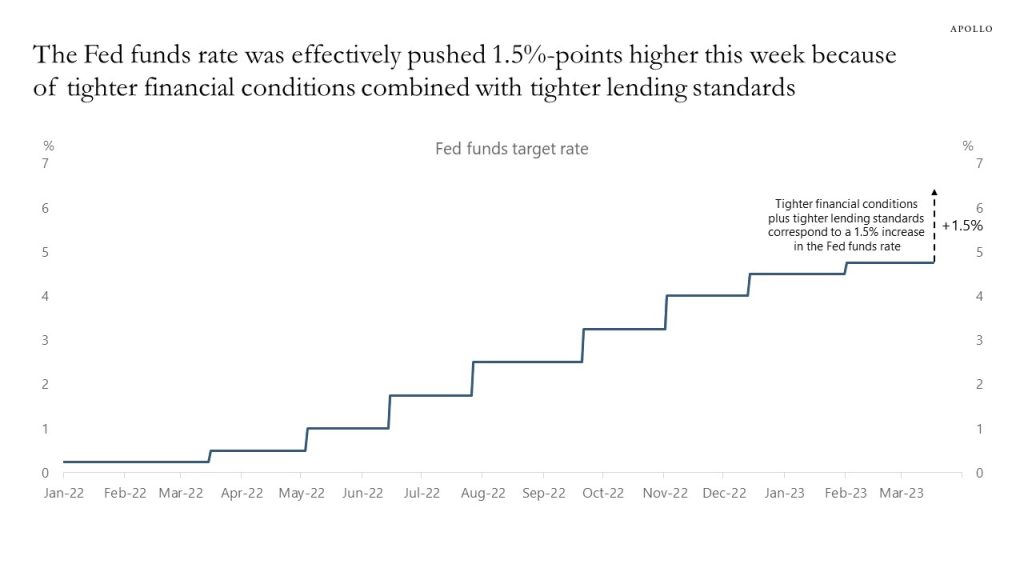
Source: Bloomberg, Apollo Chief Economist. Note: Two regression models with the Fed funds rate on the left-hand side were run to quantify the effect from tighter financial conditions and tighter lending standards, and the estimated coefficients show 0.5% higher Fed funds rate from tighter financial conditions and 1% higher Fed funds rate from tighter lending standards. See important disclaimers at the bottom of the page.
-
The Worker Adjustment and Retraining Notification (WARN) Act gives 60 to 90 days advance notice in cases of plant closings and mass layoffs. Looking at WARN notices for CA, FL, NY, OH, PA, and TX shows upside risks to jobless claims over the coming weeks, see chart below.
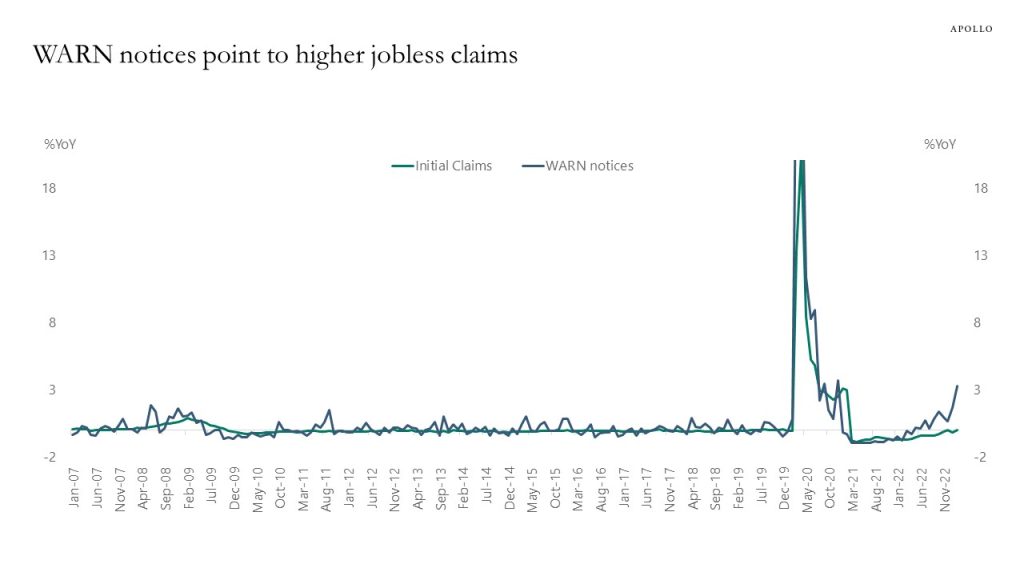
Source: Department of Labor, Haver Analytics, Federal Reserve Bank of Cleveland, Apollo Chief Economist. Note: The Worker Adjustment and Retraining Notification (WARN) Act helps ensure 60 to 90 days advance notice in cases of qualified plant closings and mass layoffs. WARN notices summed for CA, FL, NY, OH, PA, TX. See important disclaimers at the bottom of the page.
-
Looking ahead, investors will need to monitor what is going on in regional banks with deposits and lending to consumers and lending to corporates. Once a week, when the Fed data for the banking sector is out, we will update and send out a chart book to monitor the situation.
See important disclaimers at the bottom of the page.
-
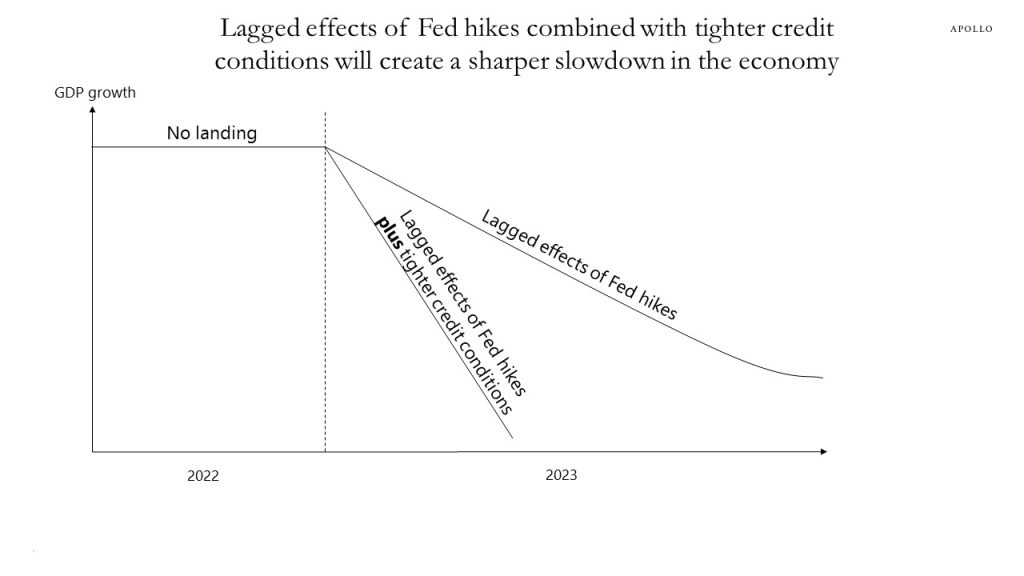
When the facts change, my view changes. A financial accident has happened, and we are going from no landing to a hard landing driven by tighter credit conditions, see chart below. Small banks account for 30% of all loans in the US economy, and regional and community banks are likely to now spend several quarters repairing their balance sheets. This likely means much tighter lending standards for firms and households even if the Fed would start cutting rates later this year. With the regional banks playing a key role in US credit extension, the Fed will not raise interest rates next week, and we have likely seen the peak in both short and long rates during this cycle.
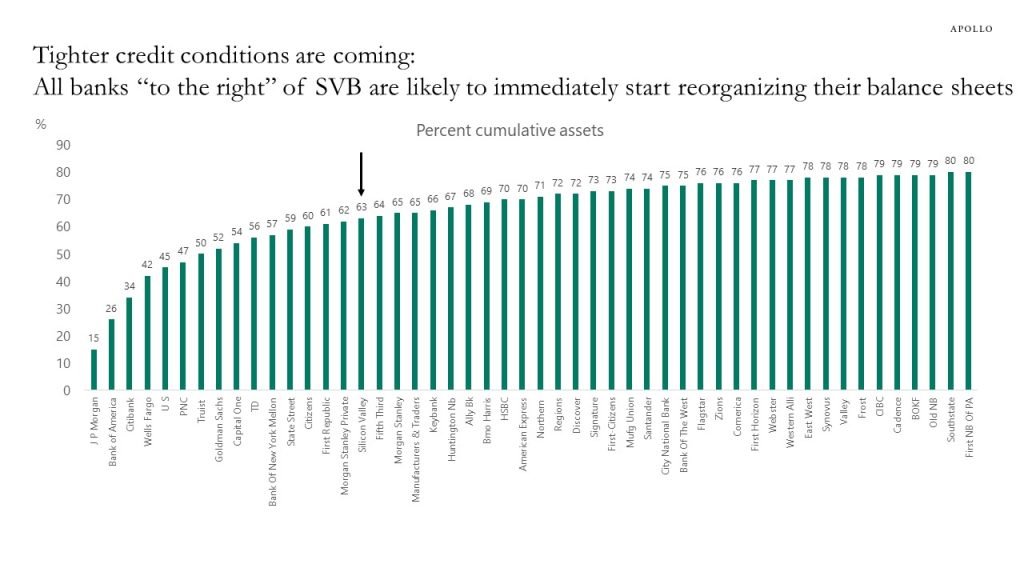
Source: Federal Reserve Board, Haver Analytics, Apollo Chief Economist See important disclaimers at the bottom of the page.
-
The Bloomberg measure of financial conditions consists of the S&P500, VIX, money market spreads, and credit spreads, and looking at what financial conditions have done since last Thursday shows a tightening, see chart below. But the tightening in financial conditions is relatively limited compared to the tightening seen in 2008 and 2020, and not big enough to generate a sharp slowdown in the economy or in inflation.
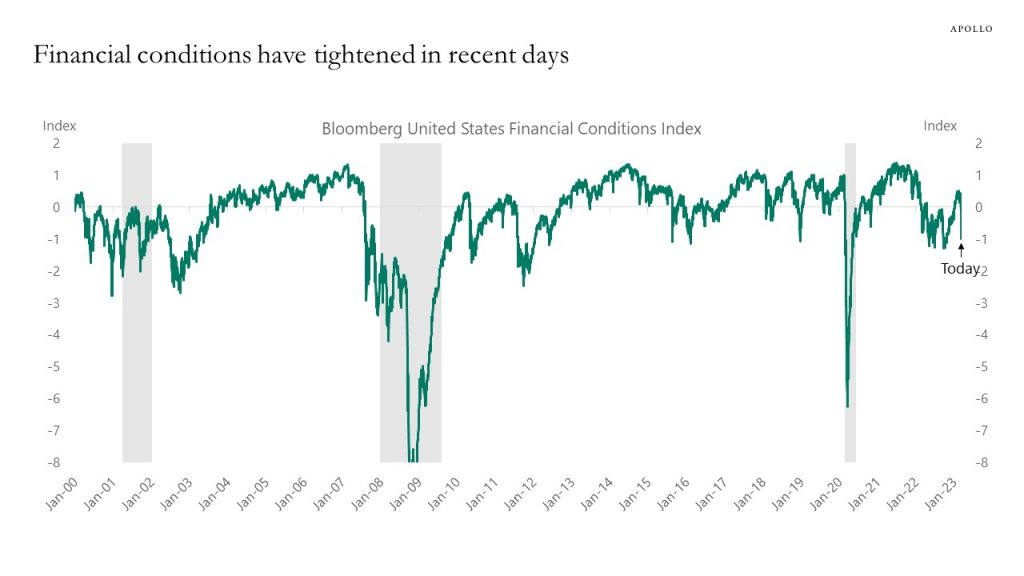
Source: Bloomberg, Apollo Chief Economist See important disclaimers at the bottom of the page.
-
Sixty percent of all mortgages outstanding were issued in the past four years at much lower mortgage rates than today, making the US housing market less vulnerable to rising interest rates than in other countries, see chart below. The implication for markets is that the Fed may have to raise interest rates more to get housing inflation under control and get overall inflation back to the FOMC’s 2% inflation target.
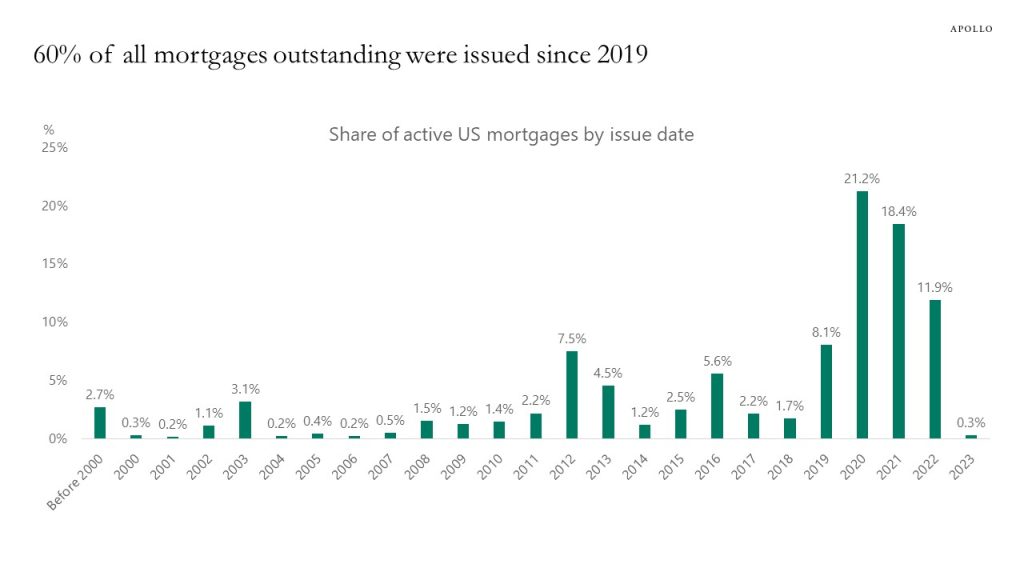
Source: Bloomberg, Apollo Chief Economist. Note: Data comes from MTGS screen on Bloomberg See important disclaimers at the bottom of the page.

This presentation may not be distributed, transmitted or otherwise communicated to others in whole or in part without the express consent of Apollo Global Management, Inc. (together with its subsidiaries, “Apollo”).
Apollo makes no representation or warranty, expressed or implied, with respect to the accuracy, reasonableness, or completeness of any of the statements made during this presentation, including, but not limited to, statements obtained from third parties. Opinions, estimates and projections constitute the current judgment of the speaker as of the date indicated. They do not necessarily reflect the views and opinions of Apollo and are subject to change at any time without notice. Apollo does not have any responsibility to update this presentation to account for such changes. There can be no assurance that any trends discussed during this presentation will continue.
Statements made throughout this presentation are not intended to provide, and should not be relied upon for, accounting, legal or tax advice and do not constitute an investment recommendation or investment advice. Investors should make an independent investigation of the information discussed during this presentation, including consulting their tax, legal, accounting or other advisors about such information. Apollo does not act for you and is not responsible for providing you with the protections afforded to its clients. This presentation does not constitute an offer to sell, or the solicitation of an offer to buy, any security, product or service, including interest in any investment product or fund or account managed or advised by Apollo.
Certain statements made throughout this presentation may be “forward-looking” in nature. Due to various risks and uncertainties, actual events or results may differ materially from those reflected or contemplated in such forward-looking information. As such, undue reliance should not be placed on such statements. Forward-looking statements may be identified by the use of terminology including, but not limited to, “may”, “will”, “should”, “expect”, “anticipate”, “target”, “project”, “estimate”, “intend”, “continue” or “believe” or the negatives thereof or other variations thereon or comparable terminology.