


The Daily Spark is moving to Apollo.com— read the latest from Torsten Slok here.
Want it delivered daily to your inbox?
-
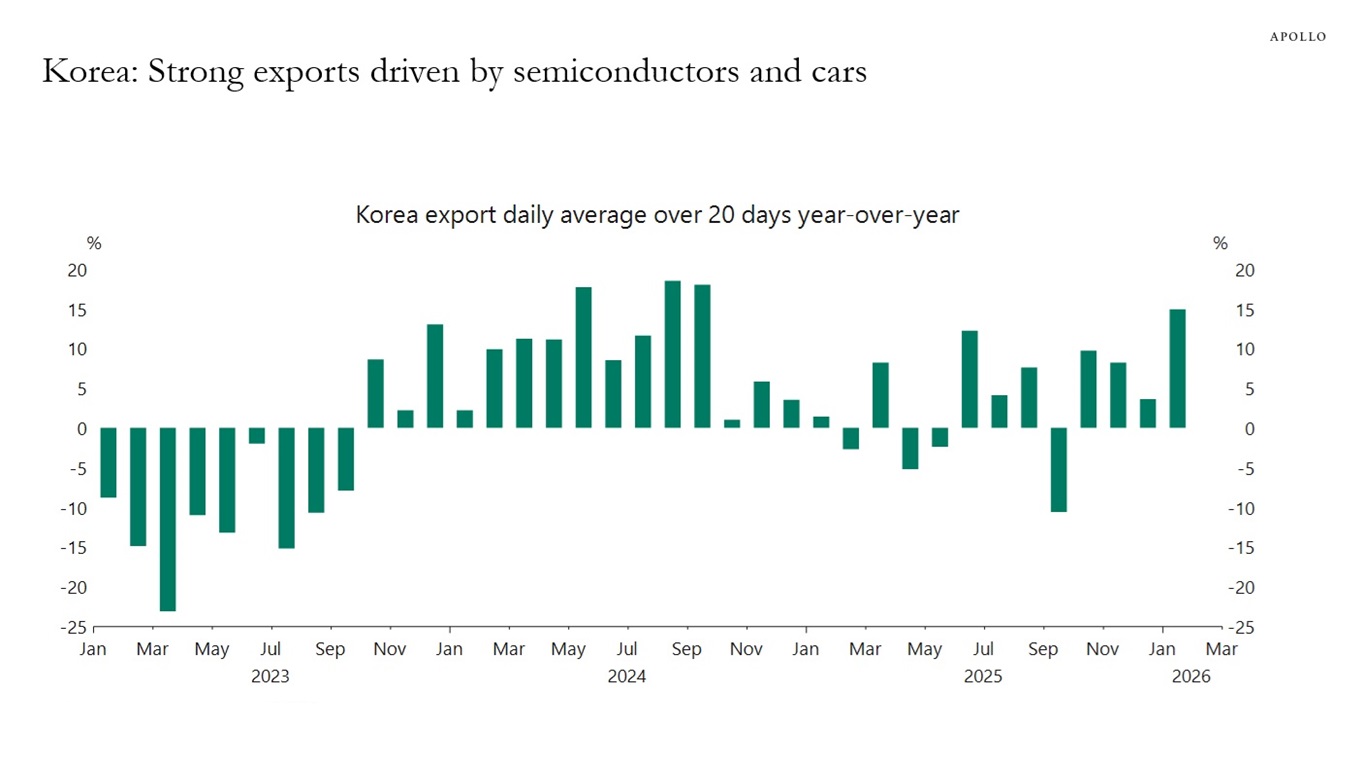
Korean export growth has been driven by strong demand for semiconductors and autos, see chart below.
Sources: Bloomberg, Macrobond, Apollo Chief Economist See important disclaimers at the bottom of the page.
-
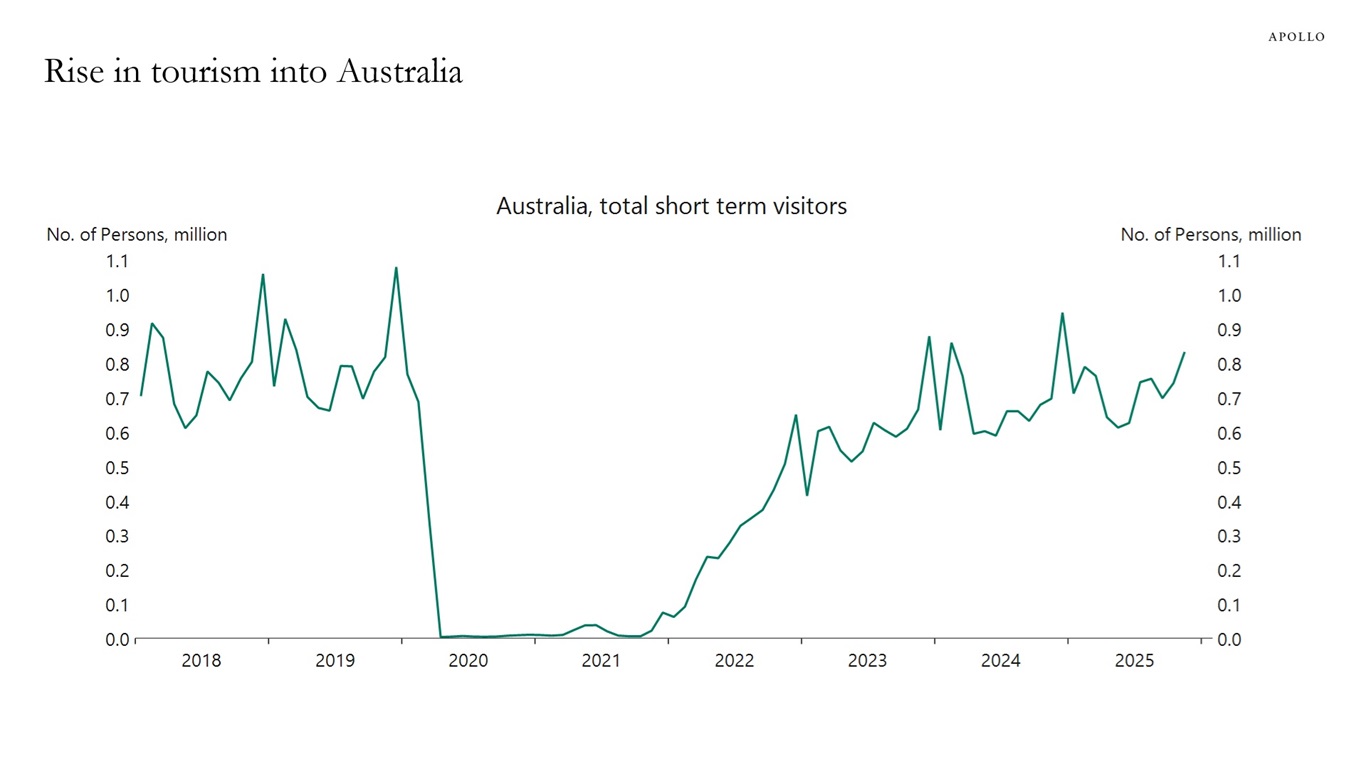
Tourism into Australia has been increasing. The number of visitors is now above pre‑pandemic levels for New Zealand, the UK and Japan, but not for China, the US and Singapore, see charts below.
Sources: Australian Bureau of Statistics, Macrobond, Apollo Chief Economist 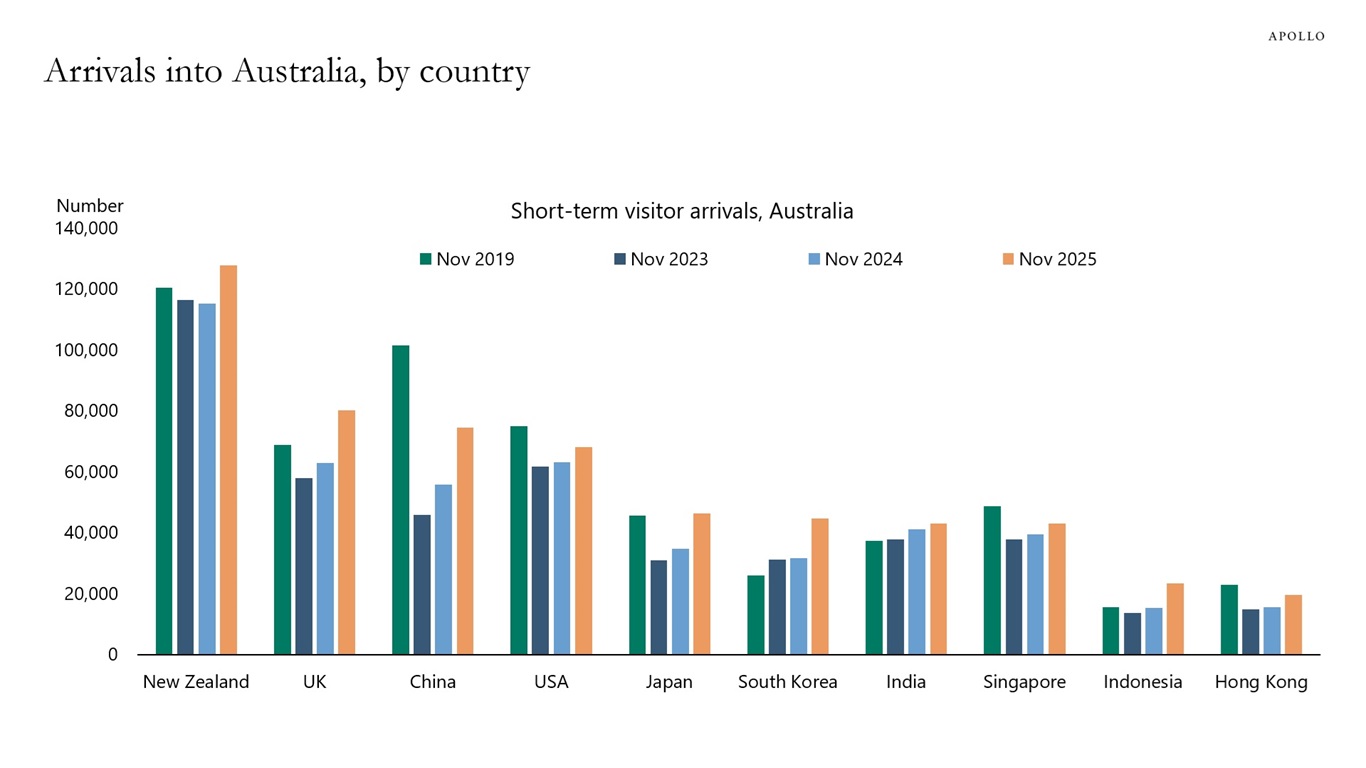
Sources: Australian Bureau of Statistics, Apollo Chief Economist See important disclaimers at the bottom of the page.
-
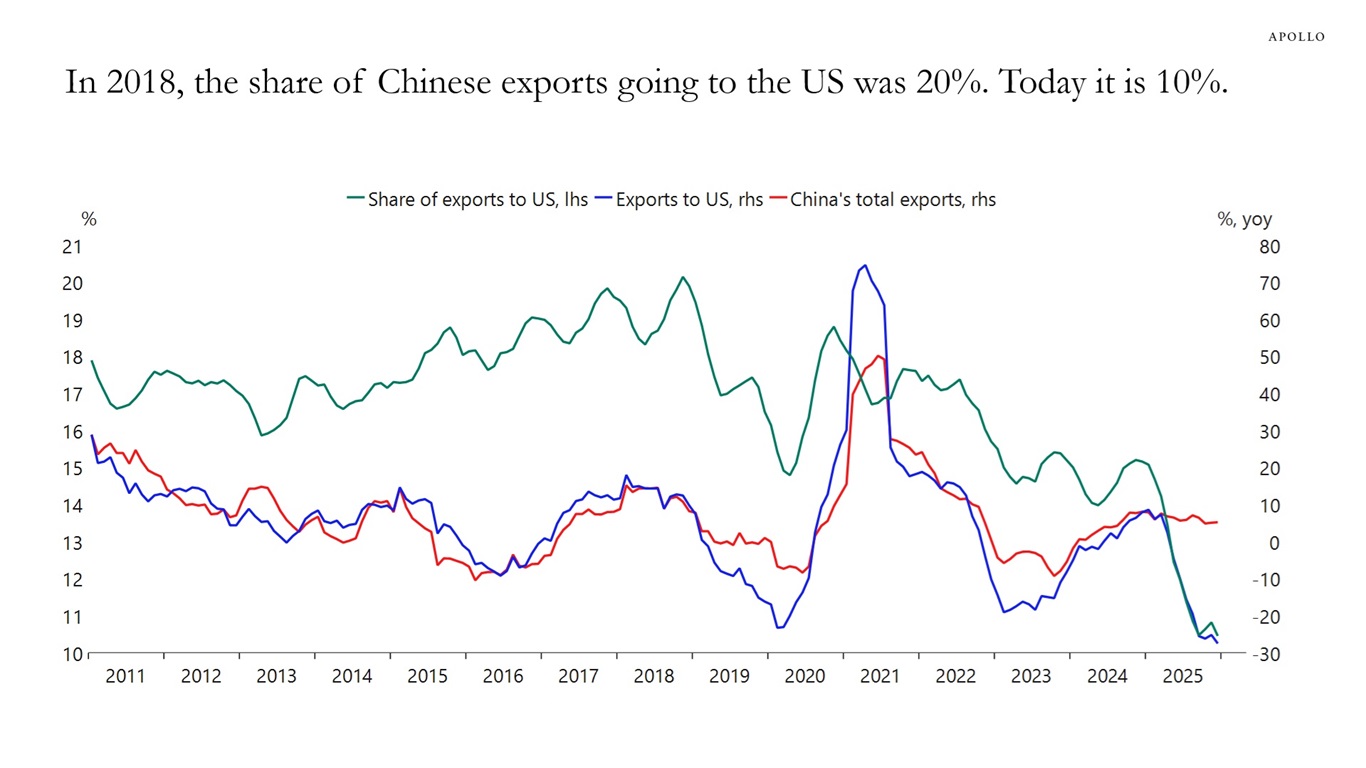
The share of Chinese exports going to the US has declined to 10%, down from 20% in 2018, see chart below.
Note: Data is six-month moving average. Sources: China General Administration of Customs (GAC), Macrobond, Apollo Chief Economist See important disclaimers at the bottom of the page.
-
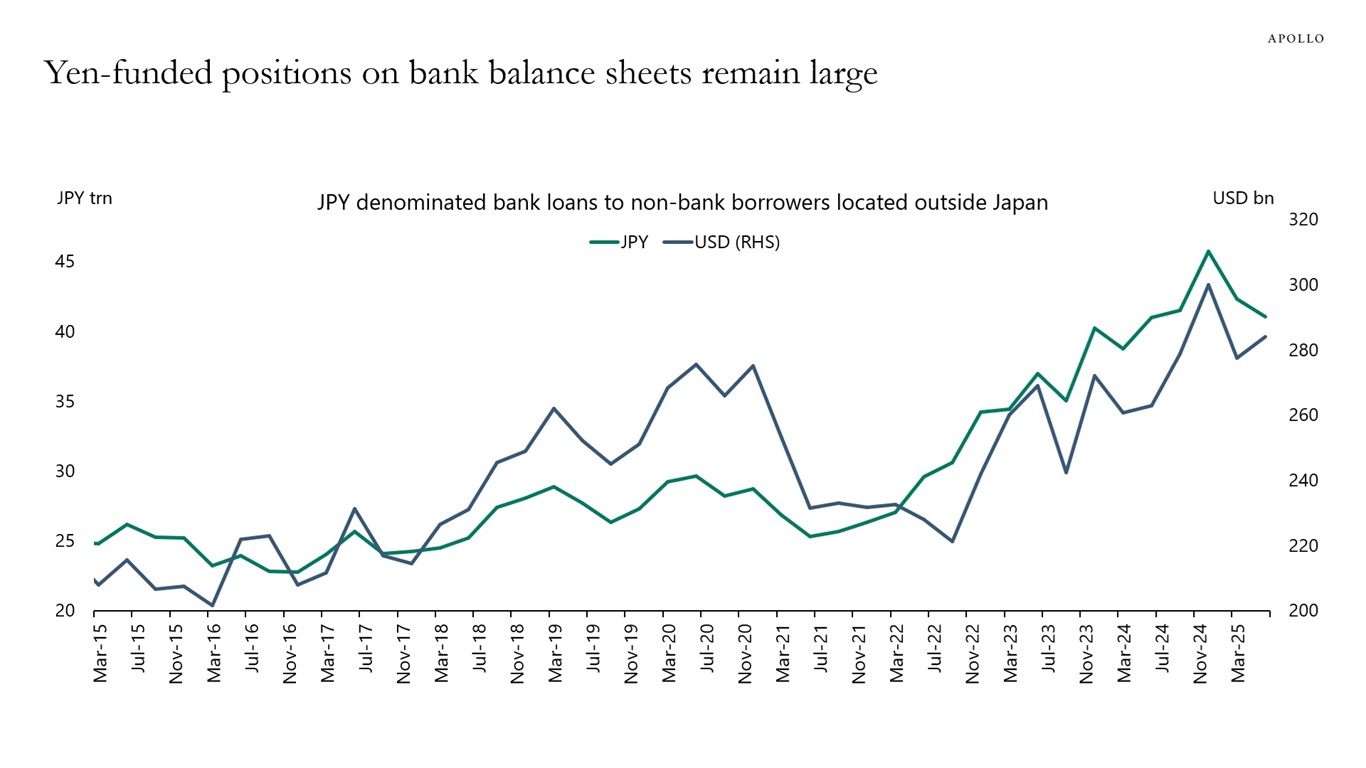
Bank balance sheet data show that yen lending to offshore financial centers and non-bank borrowers remains elevated, suggesting a large stock of yen-funded positions, see the first two charts.
By contrast, speculative futures positioning has swung sharply, highlighting that carry trades can unwind quickly even as the broader yen-funded footprint remains in place, see the third chart.
Sources: BIS, Haver Analytics, Apollo Chief Economist 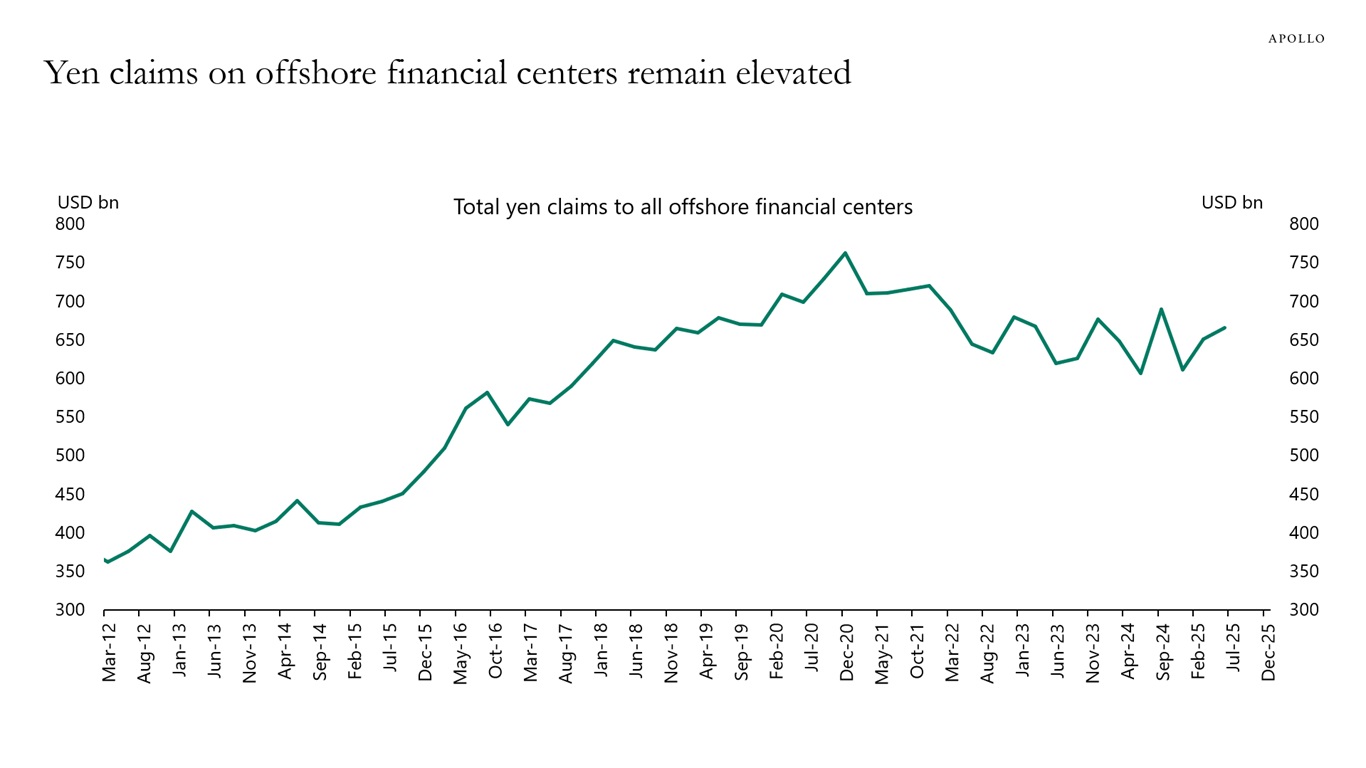
Sources: BIS, Haver Analytics, Apollo Chief Economist 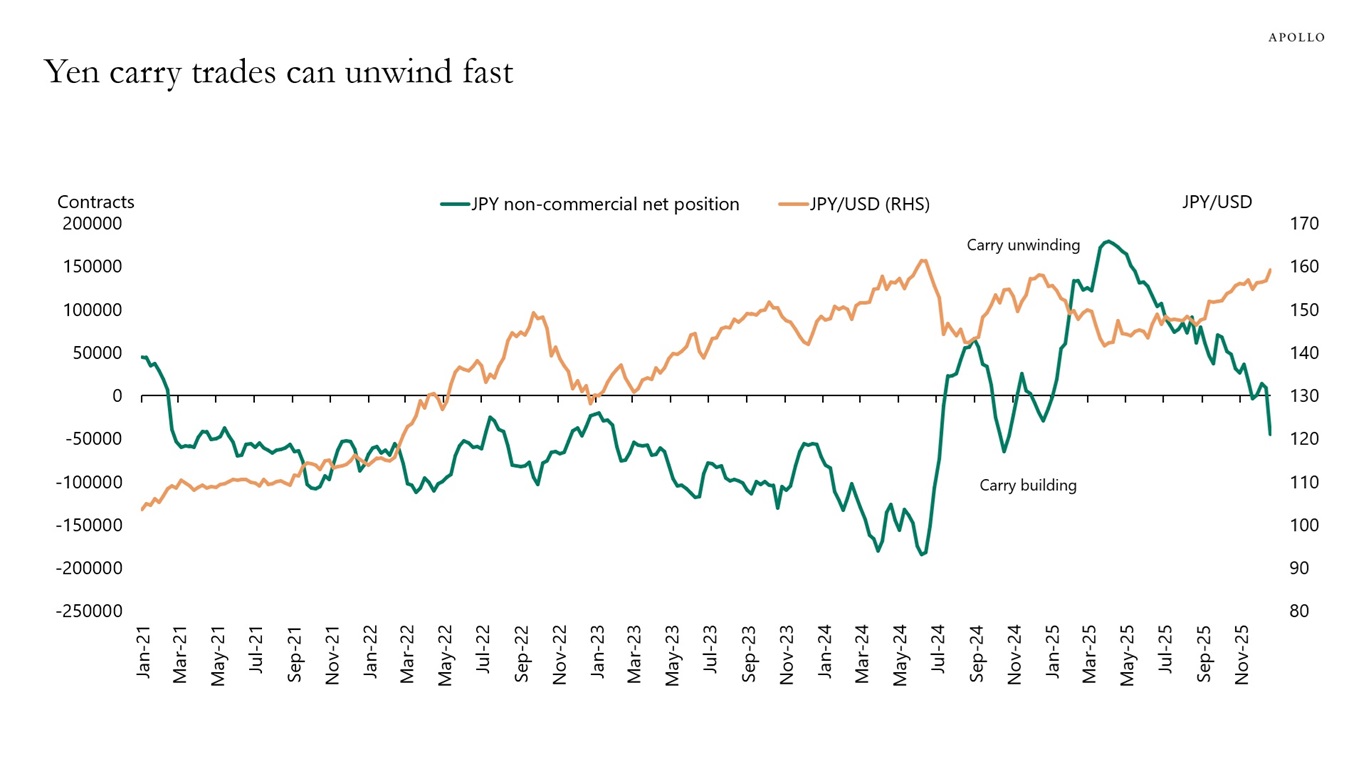
Sources: Bloomberg, Apollo Chief Economist See important disclaimers at the bottom of the page.
-
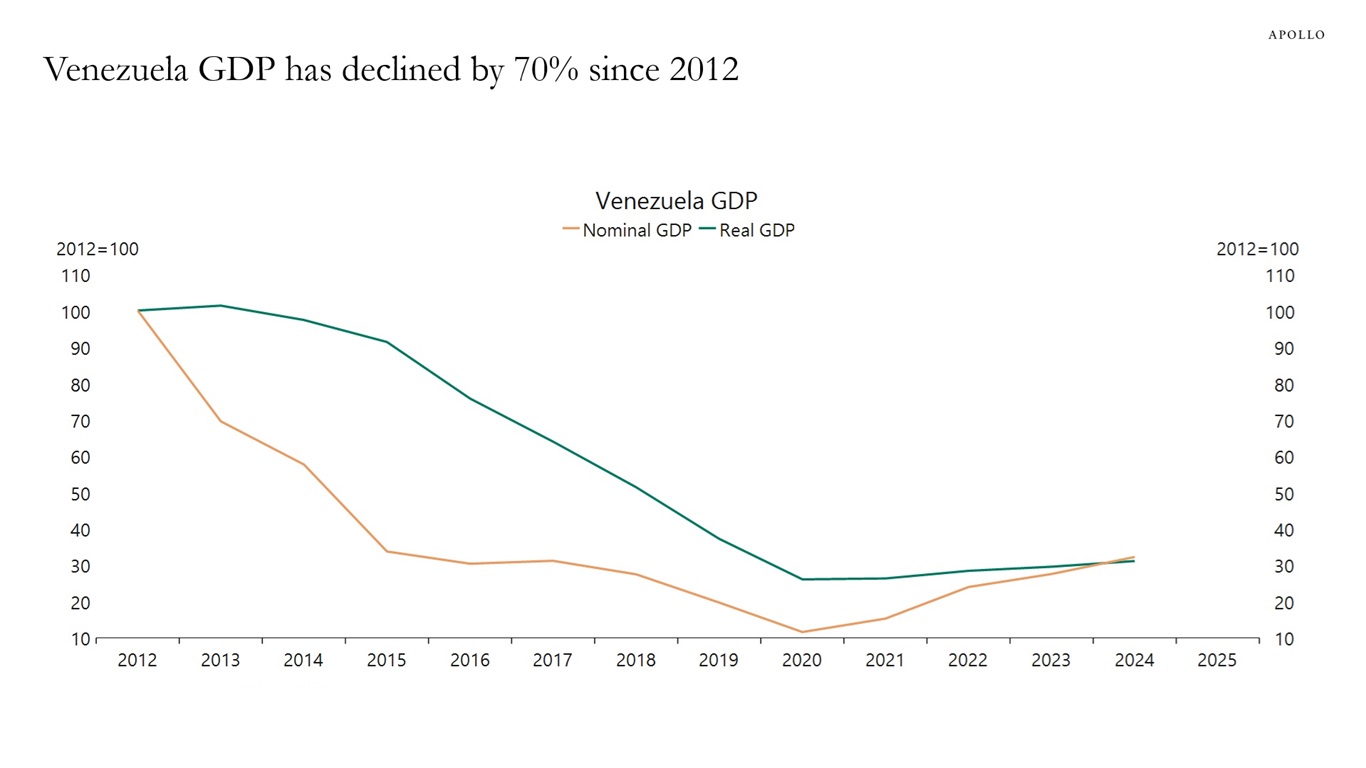
GDP in Venezuela is roughly 70% lower than in 2012, see chart below.
Sources: World Bank, Macrobond, Apollo Chief Economist See important disclaimers at the bottom of the page.
-
Data from the Yale Budget Lab shows that the US average effective tariff rate is currently roughly half of the level seen in April 2025, see chart below.
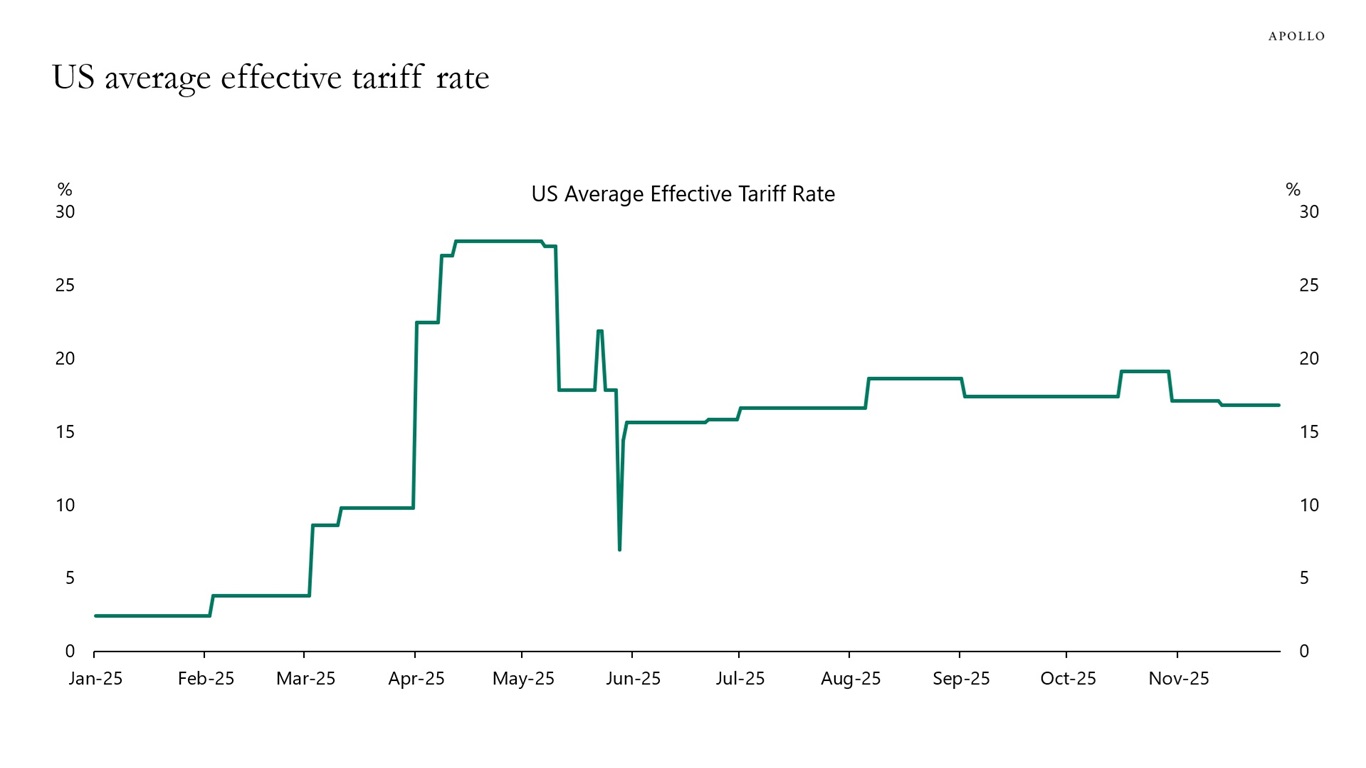
Sources: The Budget Lab at Yale, Apollo Chief Economist See important disclaimers at the bottom of the page.
-
Training and running frontier AI models requires capital on a scale rarely seen in the private sector. Hyperscaler capex has already tripled since 2023, and forecasts now point to more than $2.7 trillion of cumulative AI-related spending from 2025 to 2029.
What began as a largely self-funded capex cycle is quickly becoming a financing event. In the final three months of 2025 alone, Oracle, Meta, Google and Amazon issued roughly $90 billion in bonds. As AI investment increasingly turns to debt markets, we expect this shift to meaningfully reorder the top ranks of the investment grade credit universe.
As the chart below illustrates, financing just 20% of AI capex through IG markets would materially reshape index composition — propelling Amazon into the top 3 issuers and pushing Meta, Microsoft, Oracle and Google into the top 10, with Google jumping from 67th to 8th.
This is one of the core themes explored in our 2026 Credit Outlook. In addition, we also highlight several forces reshaping credit markets:
- Credit has shifted back into a buyer’s market. Economic growth in the US is expected to support corporate and consumer fundamentals in 2026. But the technical backdrop has flipped. After years of scarcity, credit markets are entering a higher supply regime driven by AI-related hyperscaler issuance and a reacceleration in M&A.
- AI issuance is increasing concentration and correlation risk. AI-related exposure is becoming pervasive across portfolios, with apparent diversification across issuers and sectors increasingly masking a single macro bet on AI — raising correlation risk and increasing the value of diversification into areas structurally insulated from the AI arms race, including European private credit and sports financing.
- M&A is returning at scale, reinforcing supply dynamics. Lower financing costs, workable valuations, abundant private equity dry powder, and a more supportive policy backdrop are driving a resurgence in deal activity, with large transactions tapping multiple segments of the credit markets simultaneously.
- The cycle is defined by dispersion, not distress. Economic growth is narrowing rather than weakening, concentrating among higher-income consumers and large, AI-exposed corporates. This K-shaped environment is driving widening dispersion across credit markets, making selectivity paramount as dispersion — not defaults — creates opportunity.
Read more of our thinking and insights here.
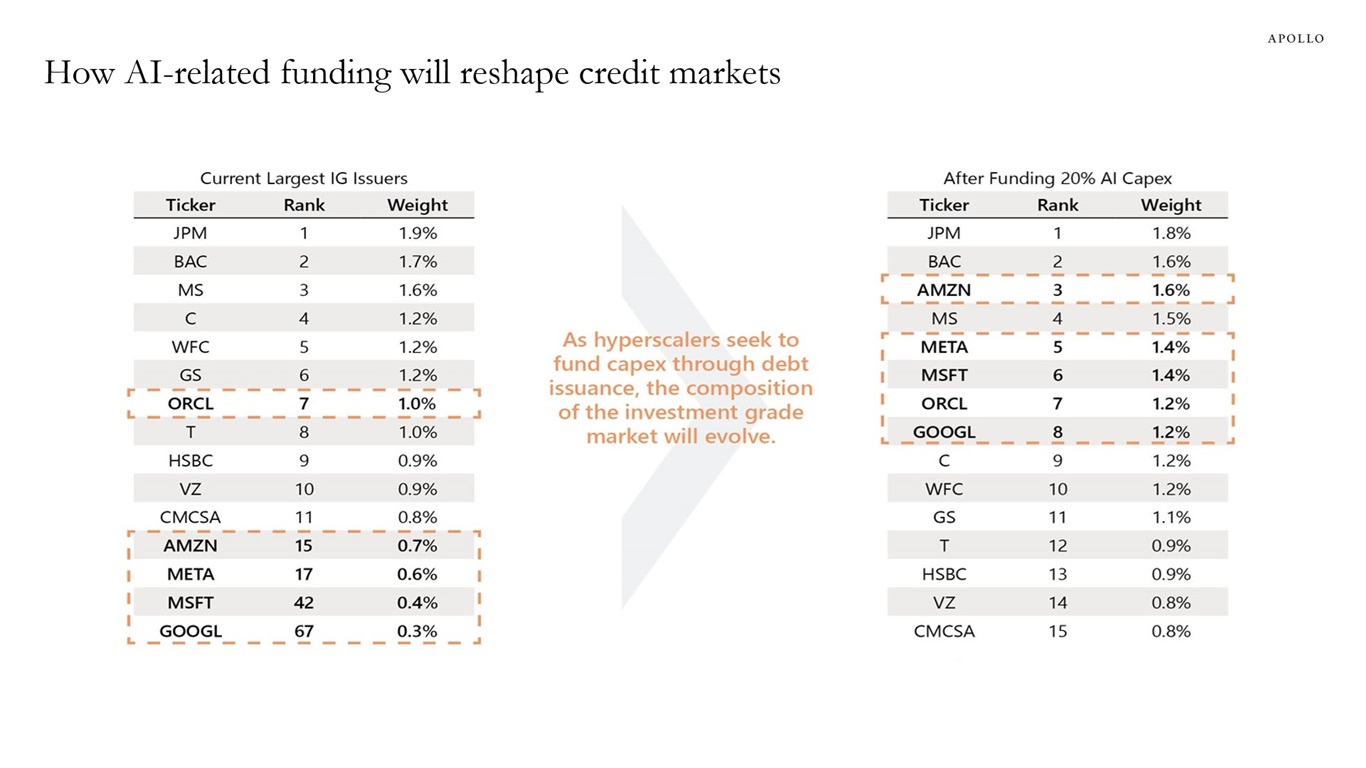
Note: Assumes hyperscalers issue IG debt to fund 20% of BBG consensus capex 2026-2029, while rest of IG index grows at 5% / year. Data as of December 2025. Sources: Bloomberg, BofA See important disclaimers at the bottom of the page.
-
Employment growth in large companies is outpacing job growth in smaller companies.
The source of the underperformance of small businesses could be AI or it could be the trade war.
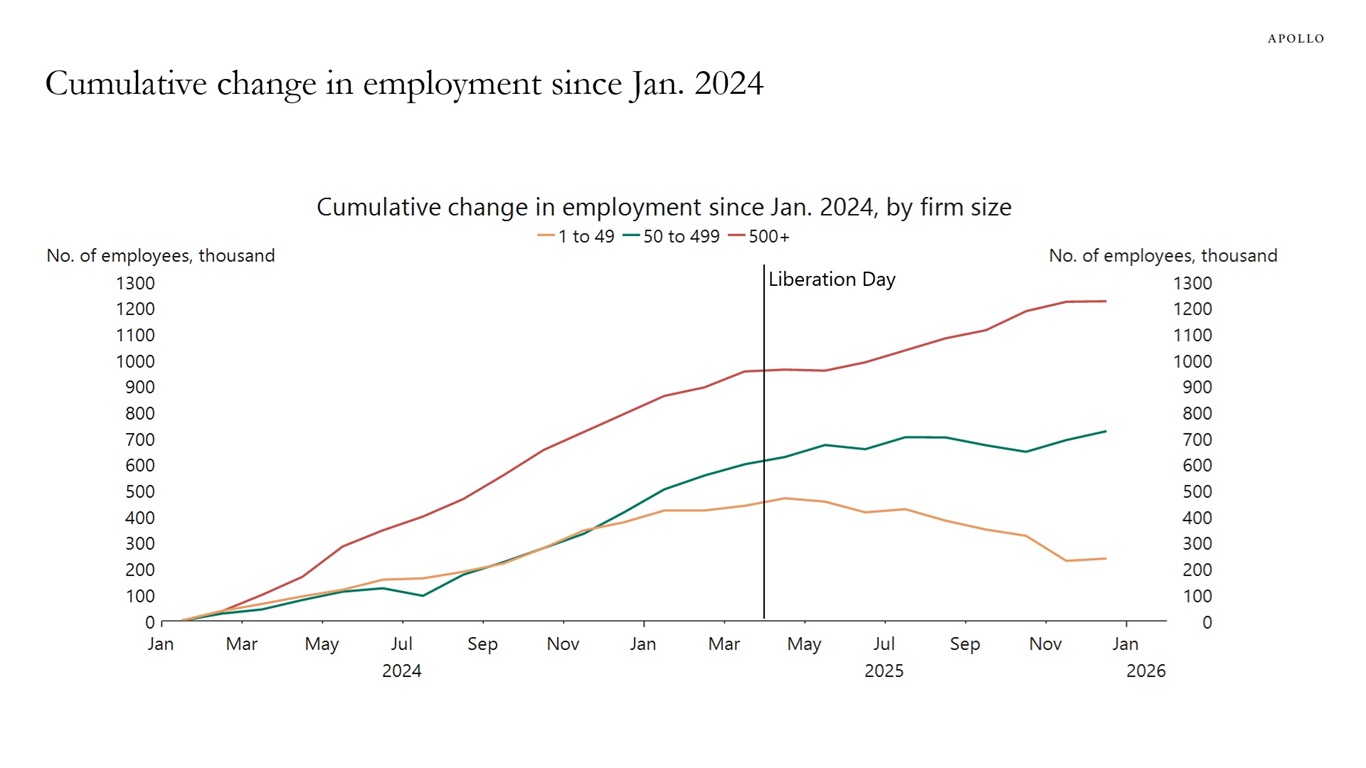
Sources: Automatic Data Processing, Inc. (ADP), Macrobond, Apollo Chief Economist See important disclaimers at the bottom of the page.
-
Academic papers are inconclusive about the impact of AI on productivity, but we believe we are in the early stages of a boom in labor productivity, see charts below and our chart book (available here). While there are questions about the magnitude of the impact at the macro level, it is clear that there are already significant sector impacts including in DevOps software, robotic process automation and content management systems.
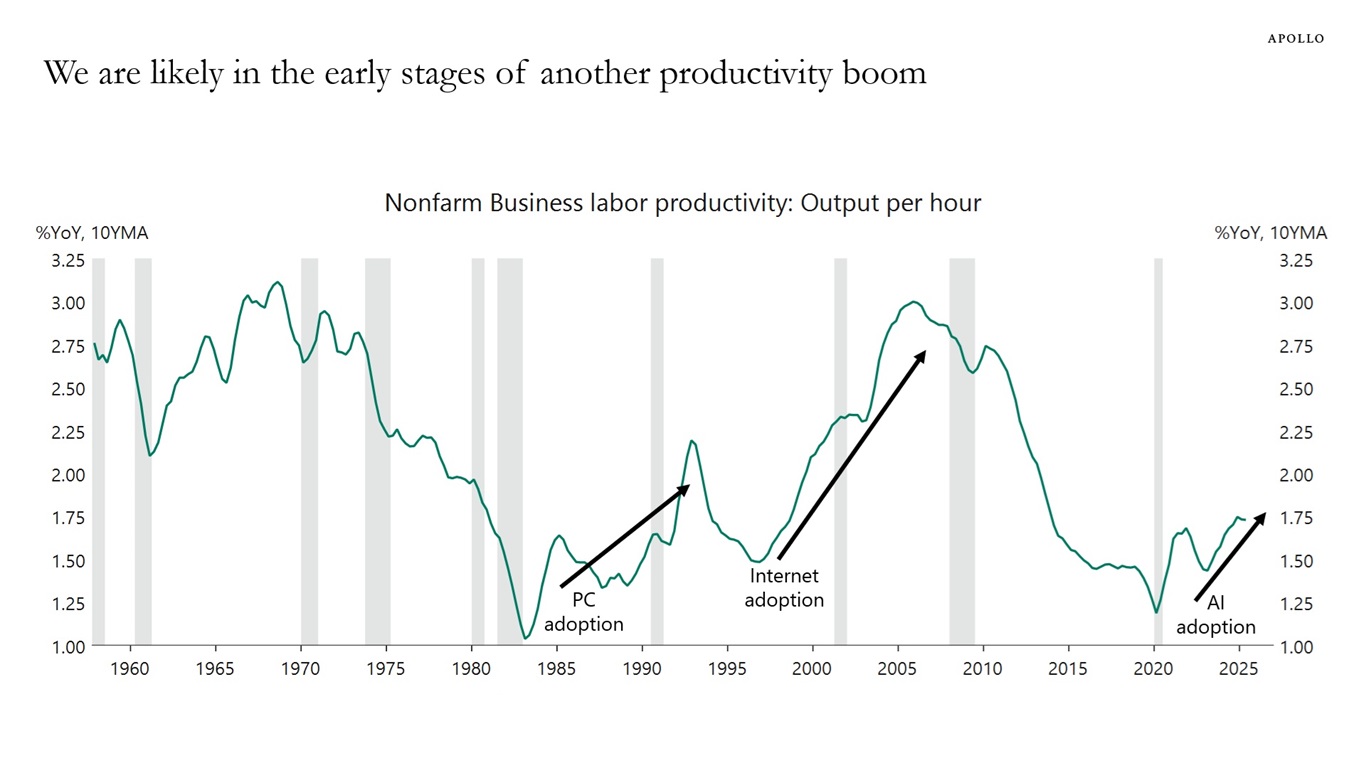
Sources: US Bureau of Labor Statistics (BLS), Macrobond, Apollo Chief Economist 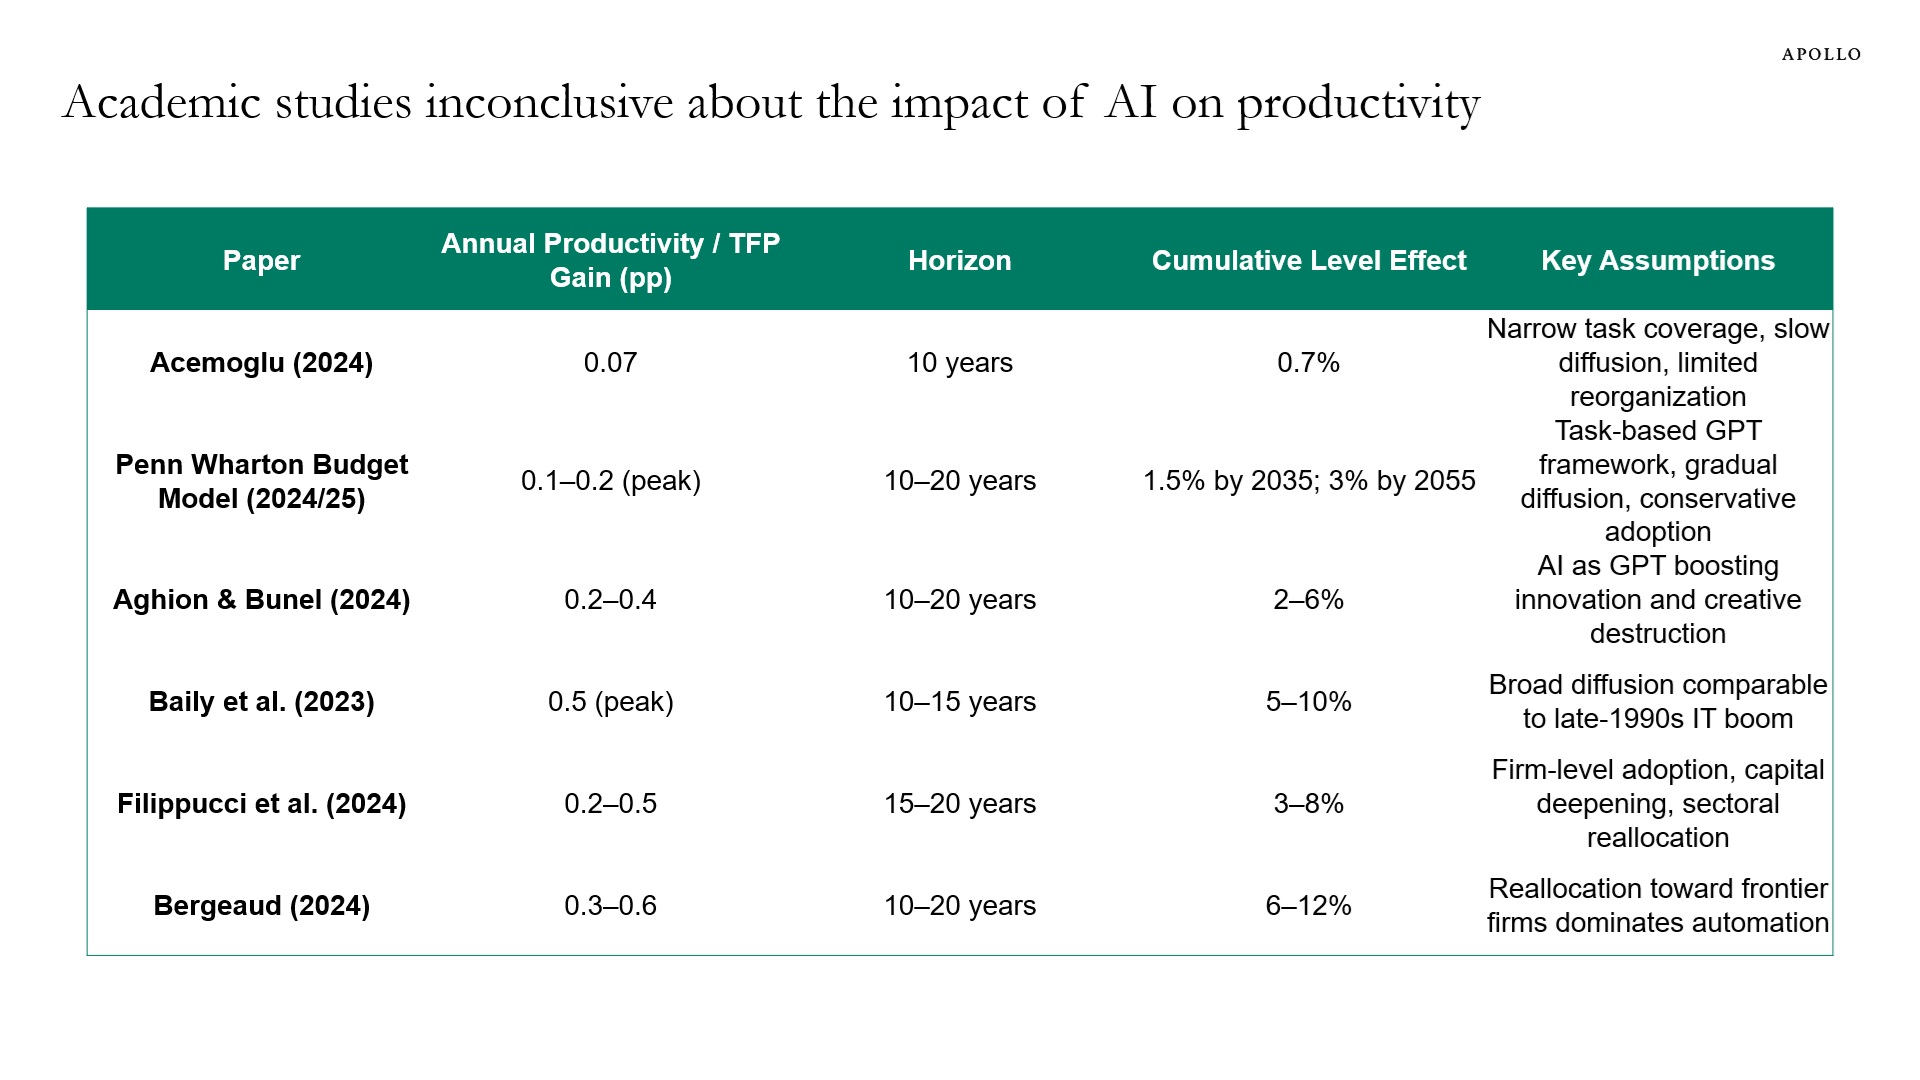
Source: Apollo Chief Economist See important disclaimers at the bottom of the page.
-
This chart book looks at demand and supply in the Treasury market, including recent developments in Treasury auction metrics. There are 10 conclusions:
1. For every $5 the government collects in taxes, a dollar goes to paying interest on debt.
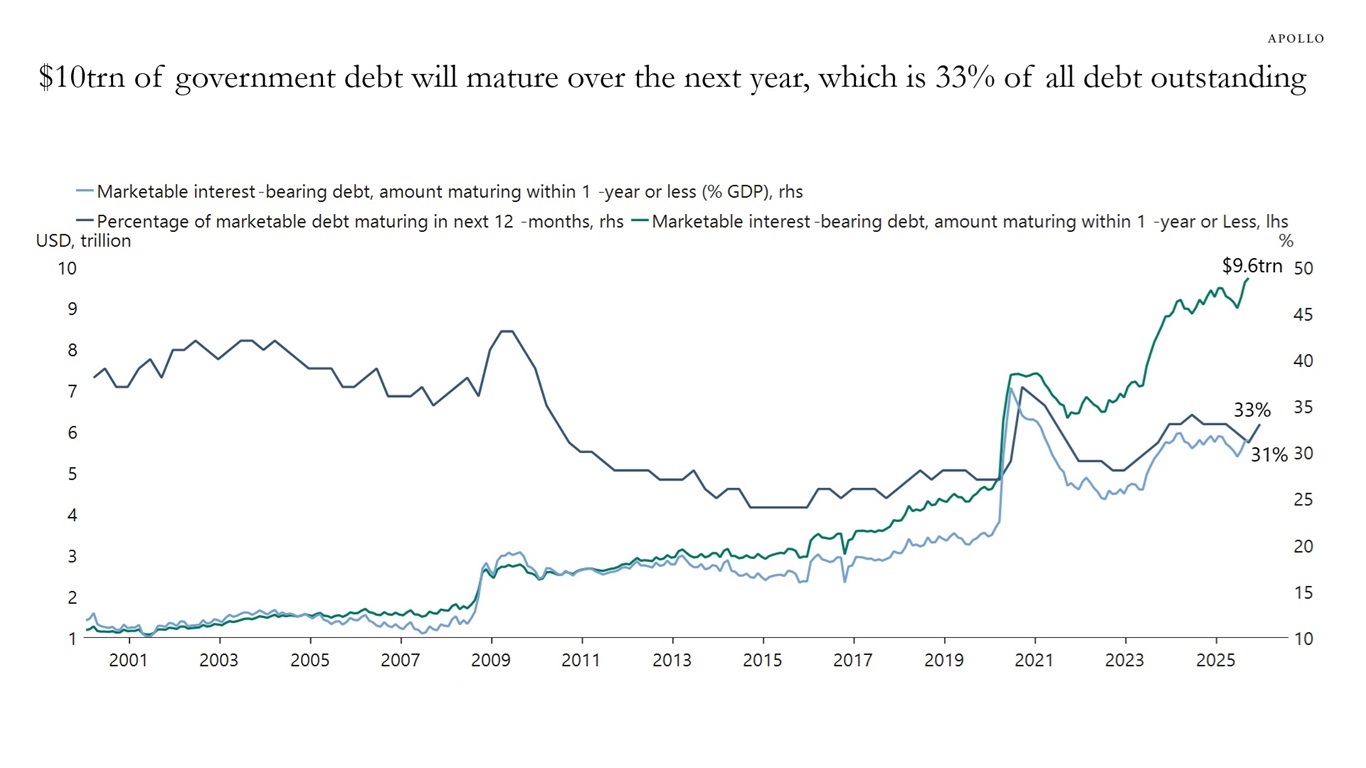
2. $10 trillion of government debt will mature over the next year, which is 33% of all debt outstanding.
3. The share of T-bills outstanding has increased to 22%, and 85% of Treasury gross issuance is T-bills.
4. The average federal net interest expense per day, including weekends, is now $3.5 billion.
5. Foreign ownership of Treasuries has declined to 25% of the total outstanding, down from 33% a decade ago.
6. Japan has been increasing its holdings of Treasuries while China has been lowering its holdings.
7. In Treasury auctions, tails and stop-through have been small and relatively balanced, implying that there is still solid demand across the curve.
8. Treasury auction metrics show that indirect bidding, often a proxy for foreign central bank demand, has been declining over the past year, particularly for notes.
9. The Fed cutting interest rates has not lowered inflows into money market funds, implying that “money on the sidelines” is not as interest rate sensitive as many people think.
10. 89% of US government debt is fixed rate, and 22% of debt outstanding is in bills.
Sources: US Department of Treasury, Macrobond, Apollo Chief Economist 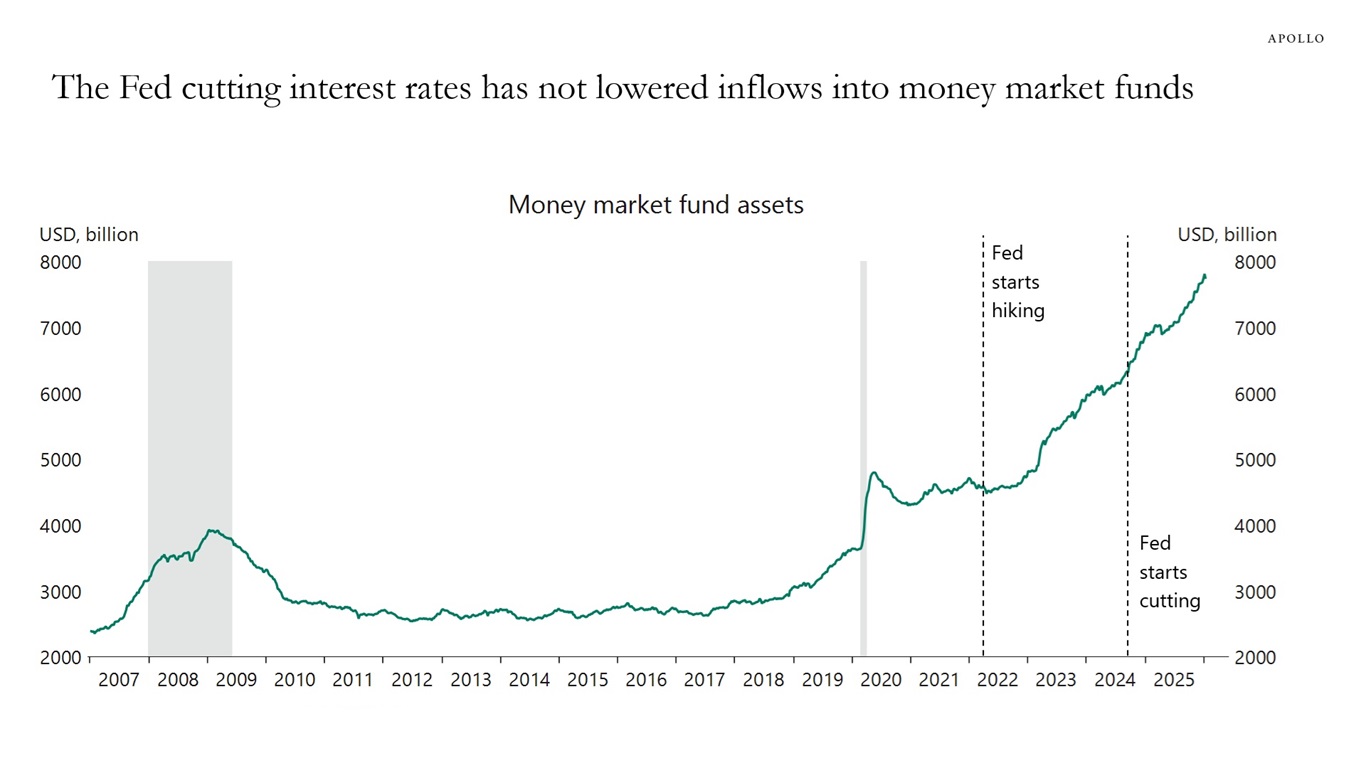
Sources: Investment Company Institute (ICI), Macrobond, Apollo Chief Economist See important disclaimers at the bottom of the page.

This presentation may not be distributed, transmitted or otherwise communicated to others in whole or in part without the express consent of Apollo Global Management, Inc. (together with its subsidiaries, “Apollo”).
Apollo makes no representation or warranty, expressed or implied, with respect to the accuracy, reasonableness, or completeness of any of the statements made during this presentation, including, but not limited to, statements obtained from third parties. Opinions, estimates and projections constitute the current judgment of the speaker as of the date indicated. They do not necessarily reflect the views and opinions of Apollo and are subject to change at any time without notice. Apollo does not have any responsibility to update this presentation to account for such changes. There can be no assurance that any trends discussed during this presentation will continue.
Statements made throughout this presentation are not intended to provide, and should not be relied upon for, accounting, legal or tax advice and do not constitute an investment recommendation or investment advice. Investors should make an independent investigation of the information discussed during this presentation, including consulting their tax, legal, accounting or other advisors about such information. Apollo does not act for you and is not responsible for providing you with the protections afforded to its clients. This presentation does not constitute an offer to sell, or the solicitation of an offer to buy, any security, product or service, including interest in any investment product or fund or account managed or advised by Apollo.
Certain statements made throughout this presentation may be “forward-looking” in nature. Due to various risks and uncertainties, actual events or results may differ materially from those reflected or contemplated in such forward-looking information. As such, undue reliance should not be placed on such statements. Forward-looking statements may be identified by the use of terminology including, but not limited to, “may”, “will”, “should”, “expect”, “anticipate”, “target”, “project”, “estimate”, “intend”, “continue” or “believe” or the negatives thereof or other variations thereon or comparable terminology.