


Want it delivered daily to your inbox?
-
The chart below compares the price of different medical procedures across countries.
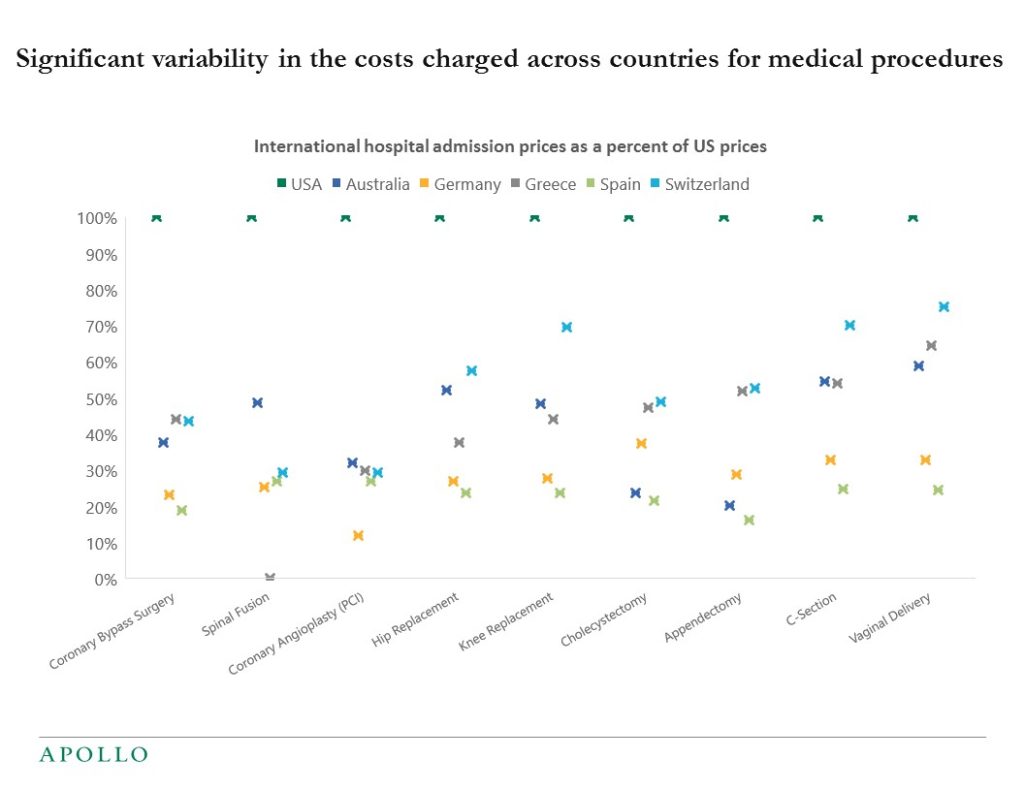
Note: Data for 2019. Source: The International Federation of Health Plans (iFHP), Apollo Chief Economist See important disclaimers at the bottom of the page.
-
Weekly data shows that the number of people going to Broadway shows is rising and is now at 2019 levels, see chart below. Our collection of daily and weekly indicators for the US economy is available here.
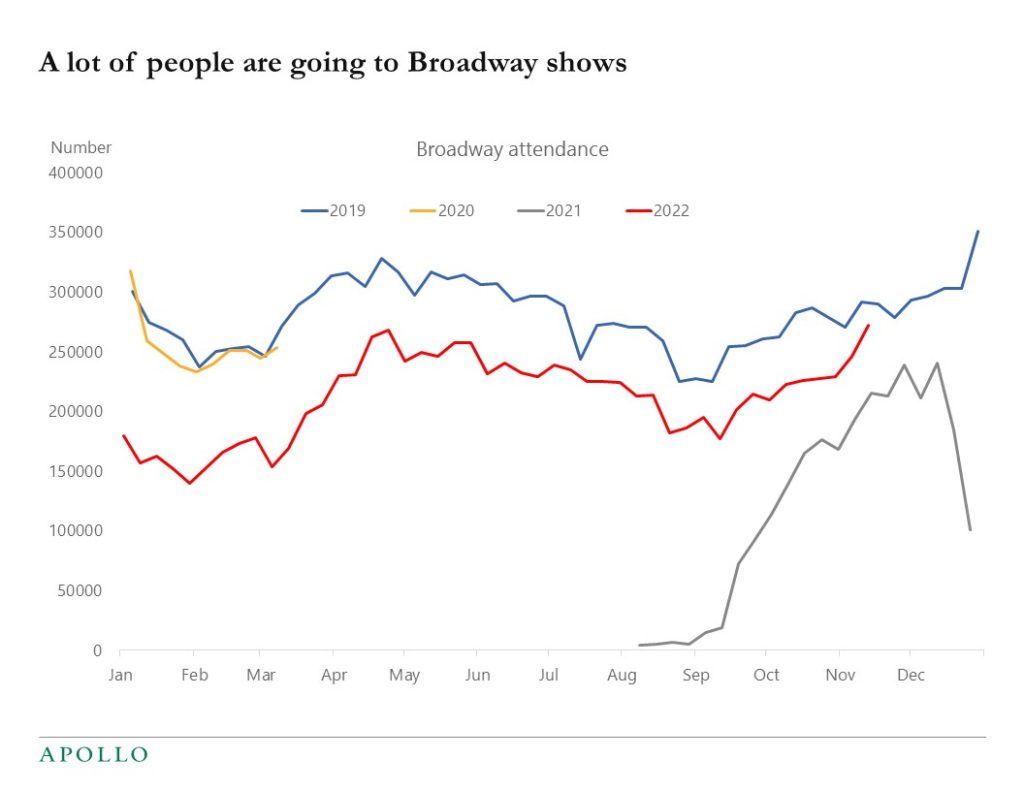
Source: Internet Broadway Database, Apollo Chief Economist See important disclaimers at the bottom of the page.
-
The S&P500 rises on average 15% in the 12 months after the Fed pauses, see chart below.
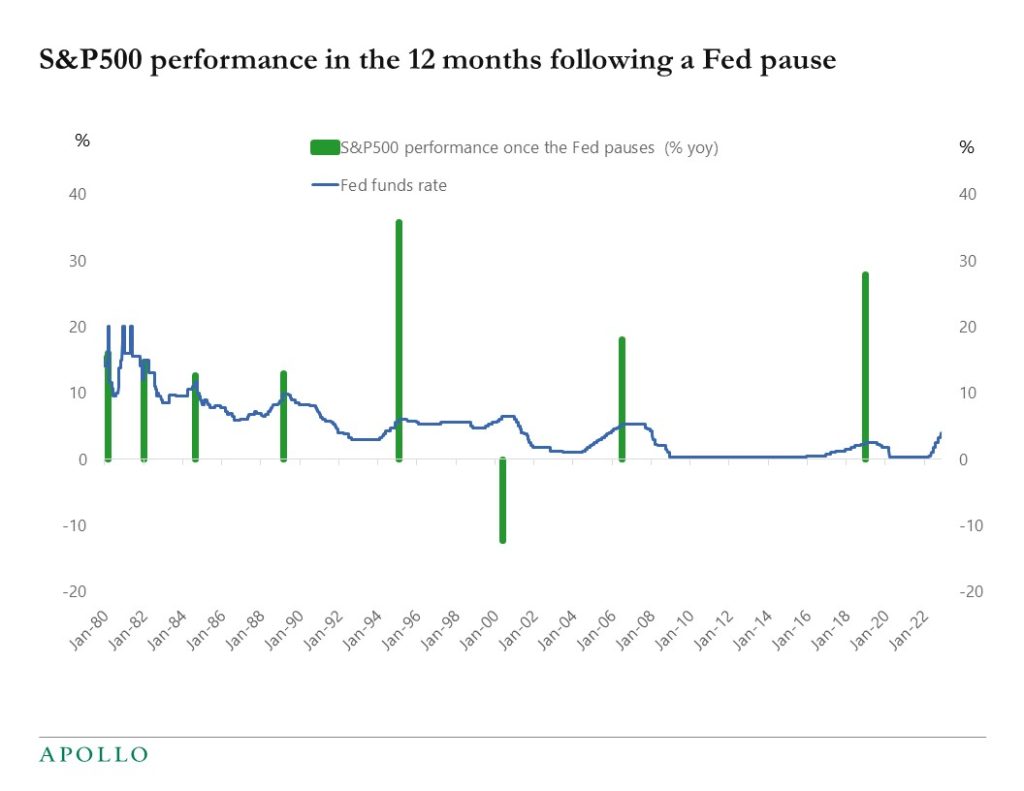
Source: Bloomberg, Apollo Chief Economist See important disclaimers at the bottom of the page.
-
Not only is housing inflation rolling over in both the Zillow and Redfin data, but core CPI ex housing has been coming down and was actually negative in October, see chart below.
A sharp slowdown in core CPI ex shelter combined with the ongoing downturn in the housing market increases the probability that inflation is coming down faster than the market is currently expecting. Which raises the likelihood that the Fed may soon be done with rate hikes.
And note again that this decline in inflation is happening while at the same time the labor market is still strong and consumers have a lot of savings, see also my note yesterday. Maybe the Fed has raised rates enough and we don’t need a lot more demand destruction to get inflation down.
The bottom line is that the likelihood of a soft landing is rising.
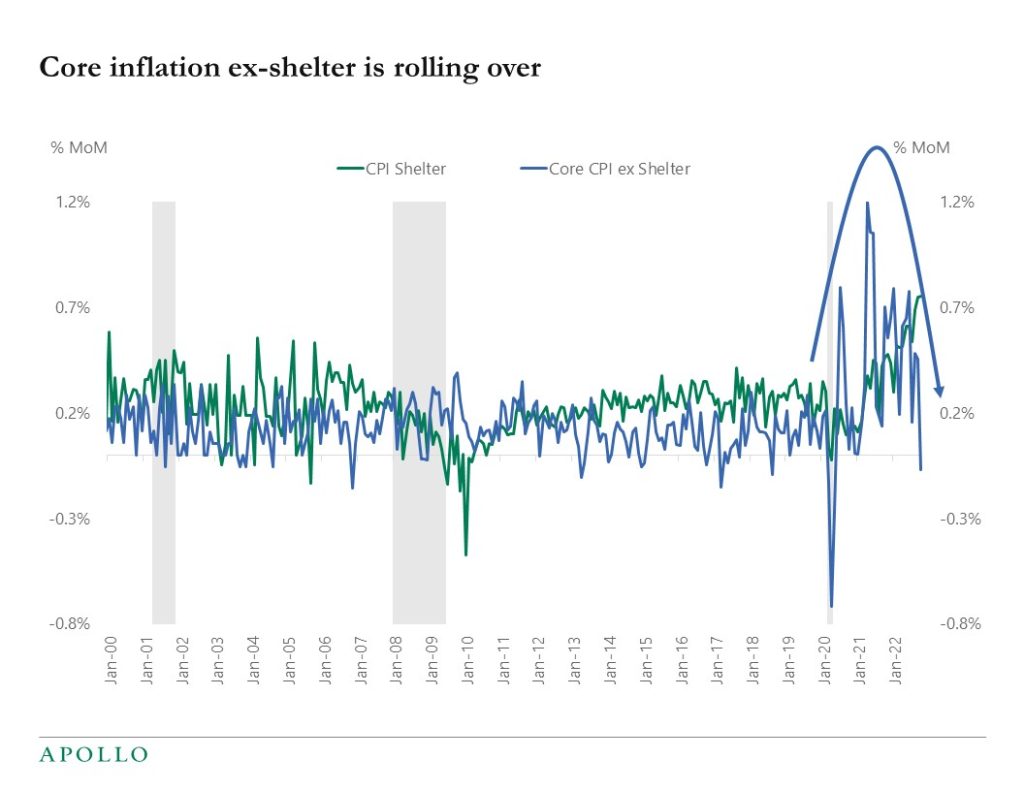
Source: BLS, Haver Analytics, Apollo Chief Economist See important disclaimers at the bottom of the page.
-
With a 9-month lag between rents starting to come down until OER moves lower, we are getting closer to the peak in housing inflation, see chart below. The fact that inflation is coming down before we see any deterioration in the labor market is very important for markets and for the outlook for a soft landing. The Fed hitting the dual mandate with first a decline in inflation and then an increase in unemployment increases the likelihood of a soft landing. If we had first an increase in unemployment with inflation still going up, it would increase the probability of a hard landing because then we would need more demand destruction from the Fed. The bottom line is that the sequencing of how the Fed reaches its dual mandate is key for markets.
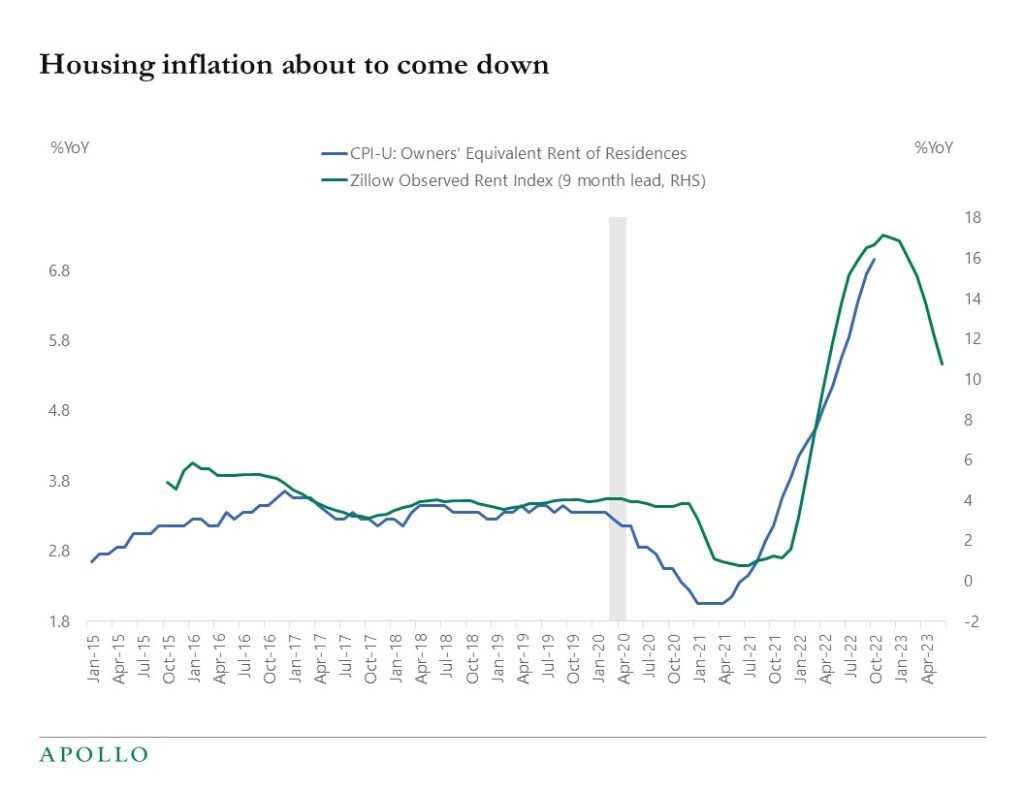
Source: Zillow, BLS, Haver Analytics, Apollo Chief Economist See important disclaimers at the bottom of the page.
-
Early in the pandemic, a lot of people retired early. But the size of the retired population is now back at the pre-pandemic trend, see chart below.
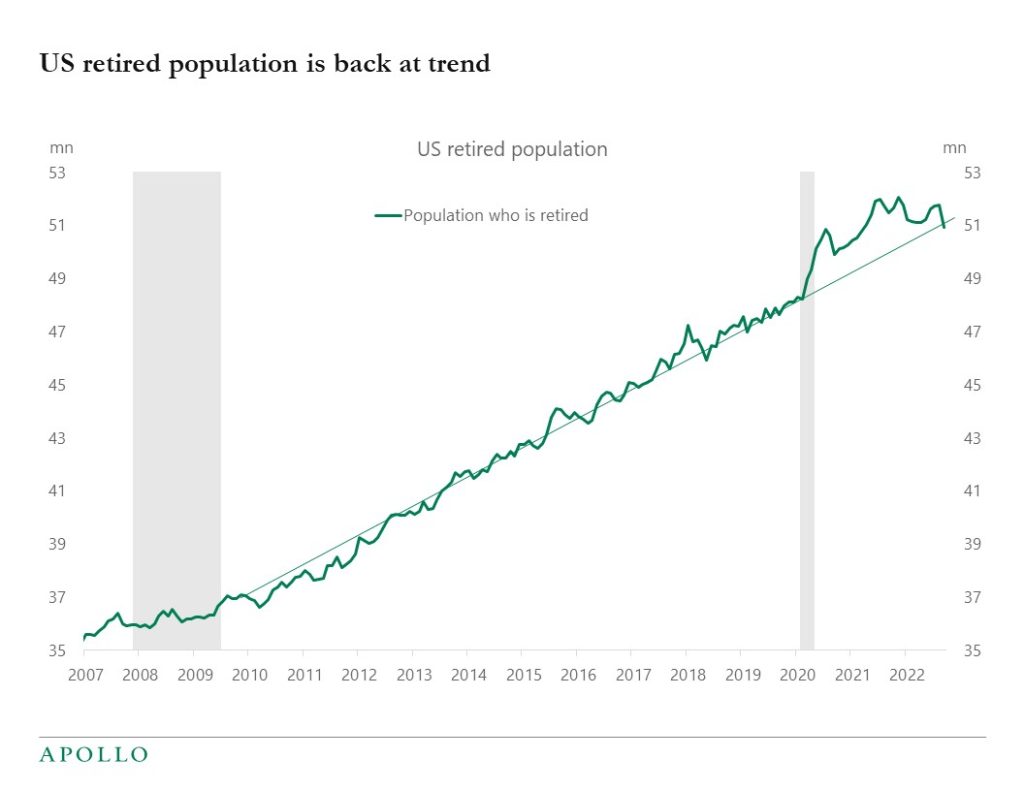
Source: CPS IPUMS, Apollo Chief Economist See important disclaimers at the bottom of the page.
-
The labor force is currently 4 million below the pre-pandemic trend, see chart below. This is a high number when considering that the total number of unemployed is presently at 6 million. The bottom line is that it is difficult to find workers and the labor market remains tight, and the upward pressure on wages will likely continue.
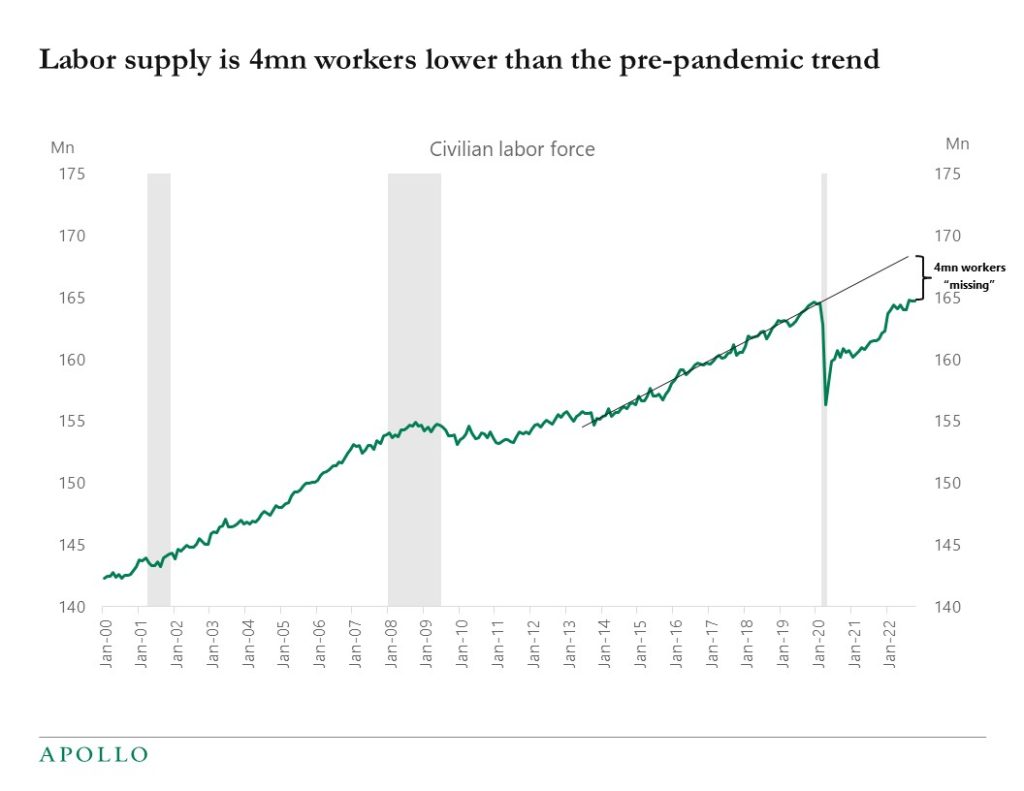
Source: BLS, Haver, Apollo Chief Economist See important disclaimers at the bottom of the page.
-
Normally households move to another house within 15 miles from where they used to live. In 2022 the median distance between the home that recent buyers purchased and the home they moved from was 50 miles, see chart below. The increase is likely driven by covid and affordability considerations.
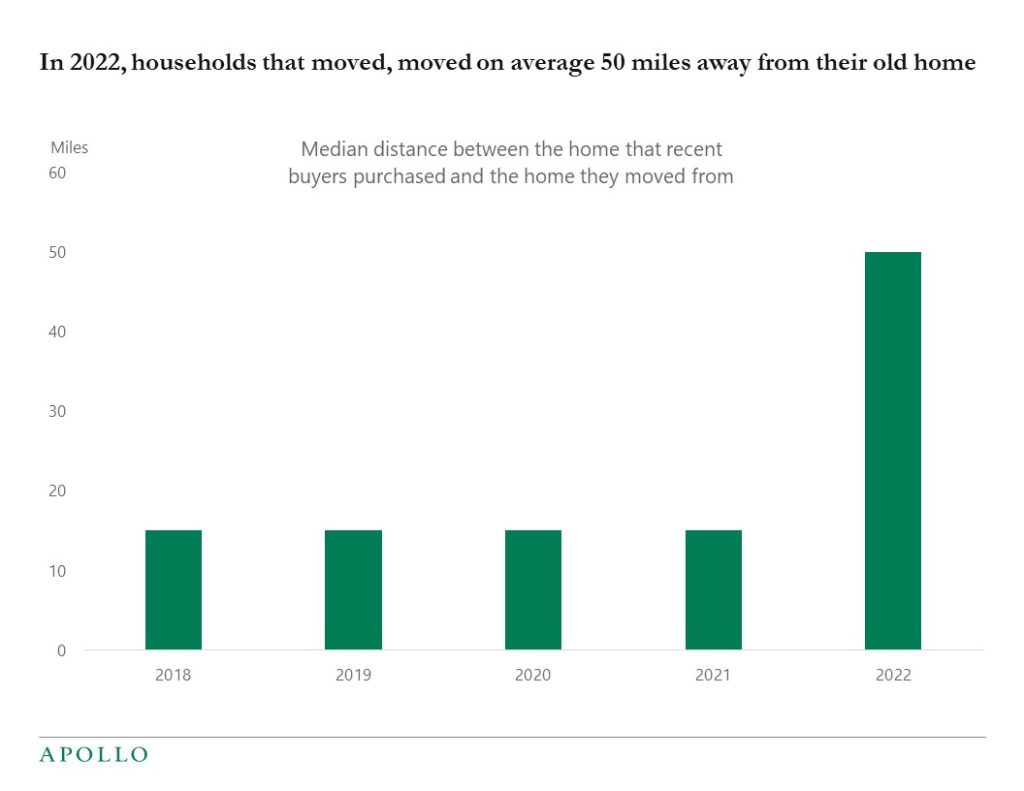
Source: NAR, Apollo Chief Economist See important disclaimers at the bottom of the page.
-
Supply chains are normalizing, and the costs of transportation by ship, truck, and train, are coming down, see charts below. The only exception is air freight rates, they are still at $5.5 per kilo, up from $2.5 before the pandemic. Our collection of supply chain charts is attached. The bottom line is that supply chains are normalizing, which will continue to put downward pressure on inflation.
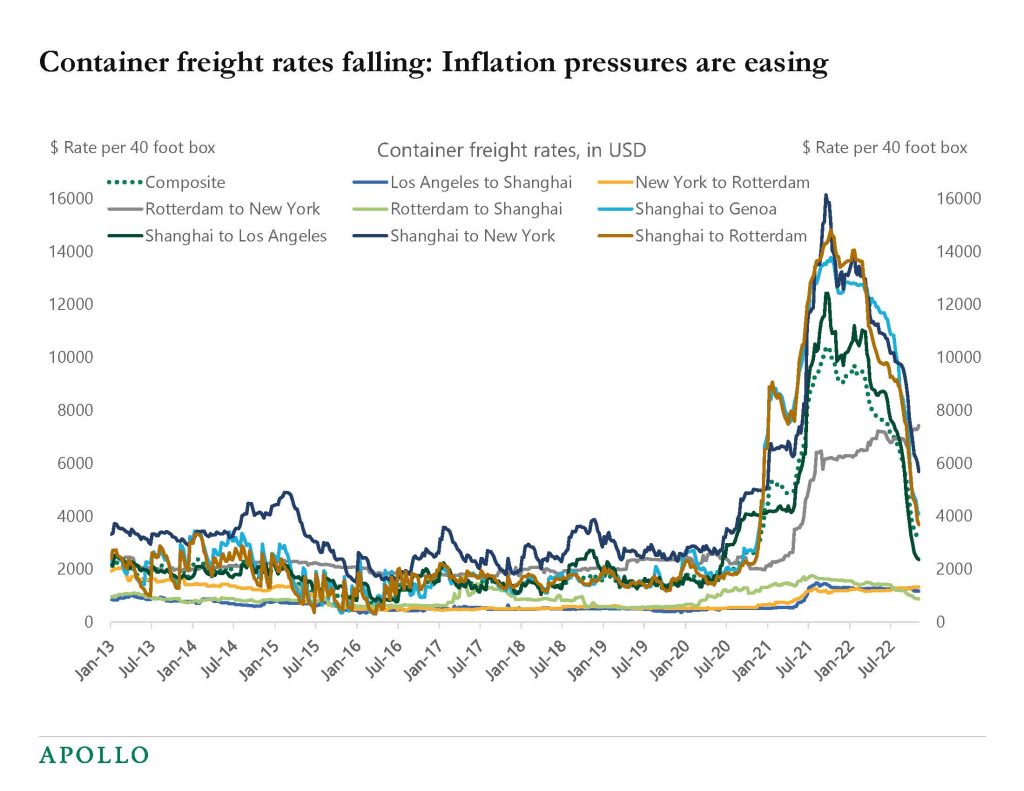
Source: WCI, Bloomberg, Apollo Chief Economist 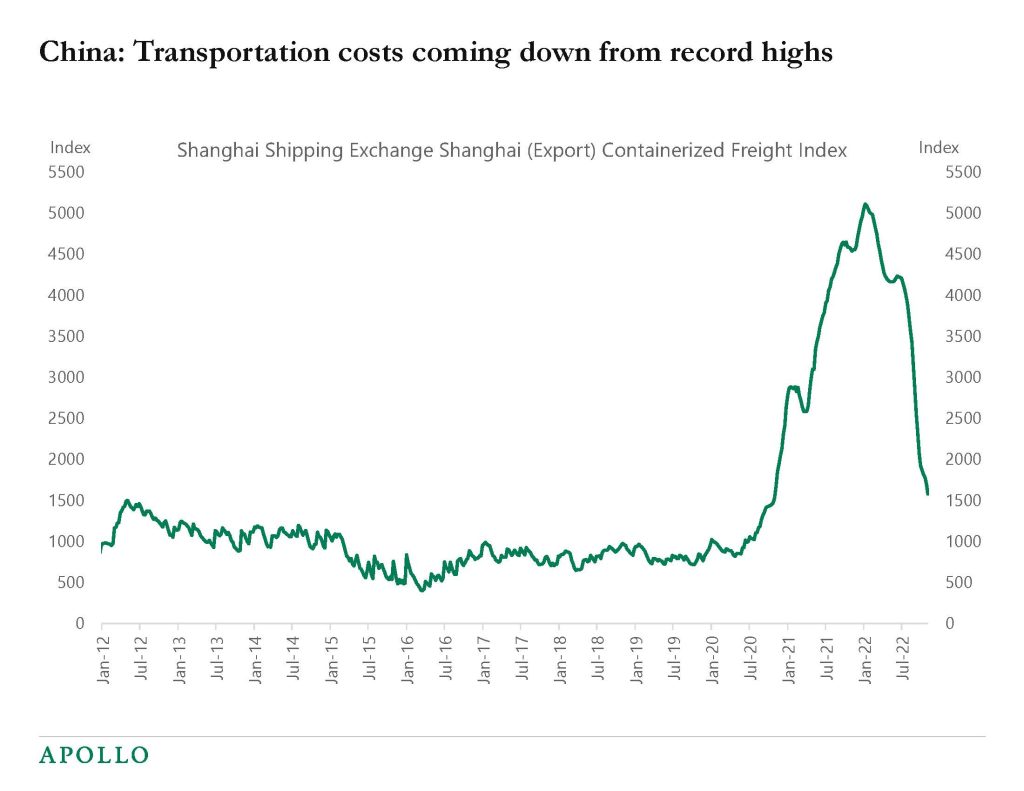
Source: Shanghai Shipping Exchange, Bloomberg, Apollo Chief Economist 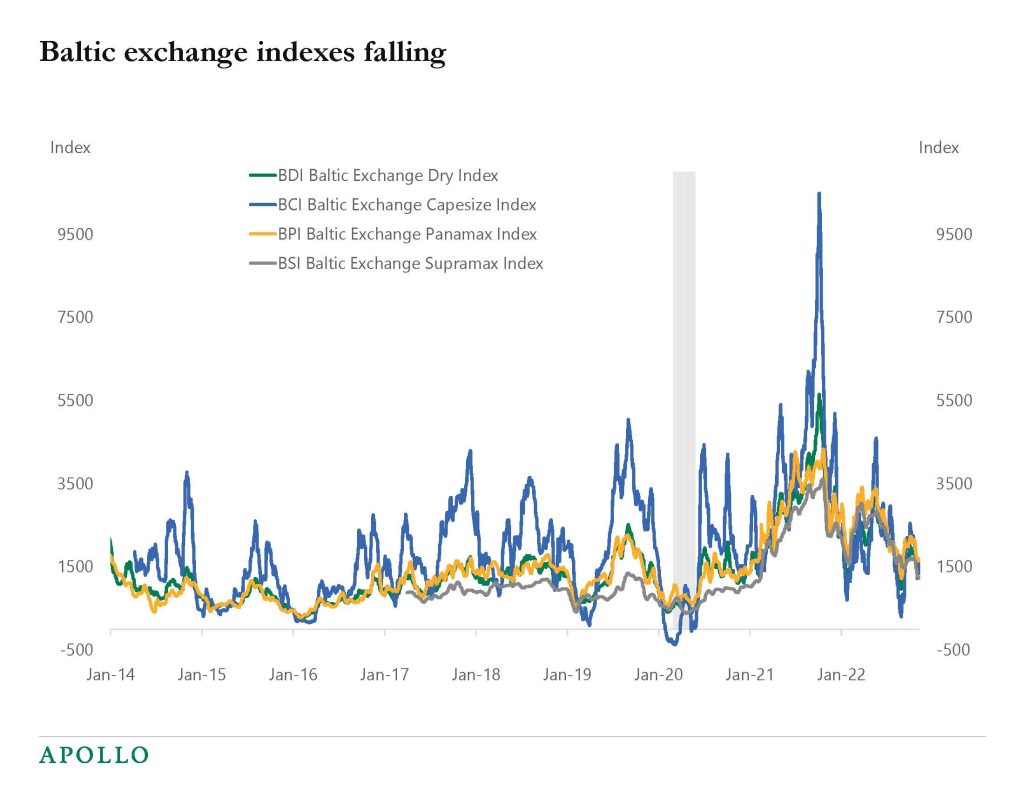
Source: Bloomberg, Apollo Chief Economist 
Source: Bloomberg, Apollo Chief Economist 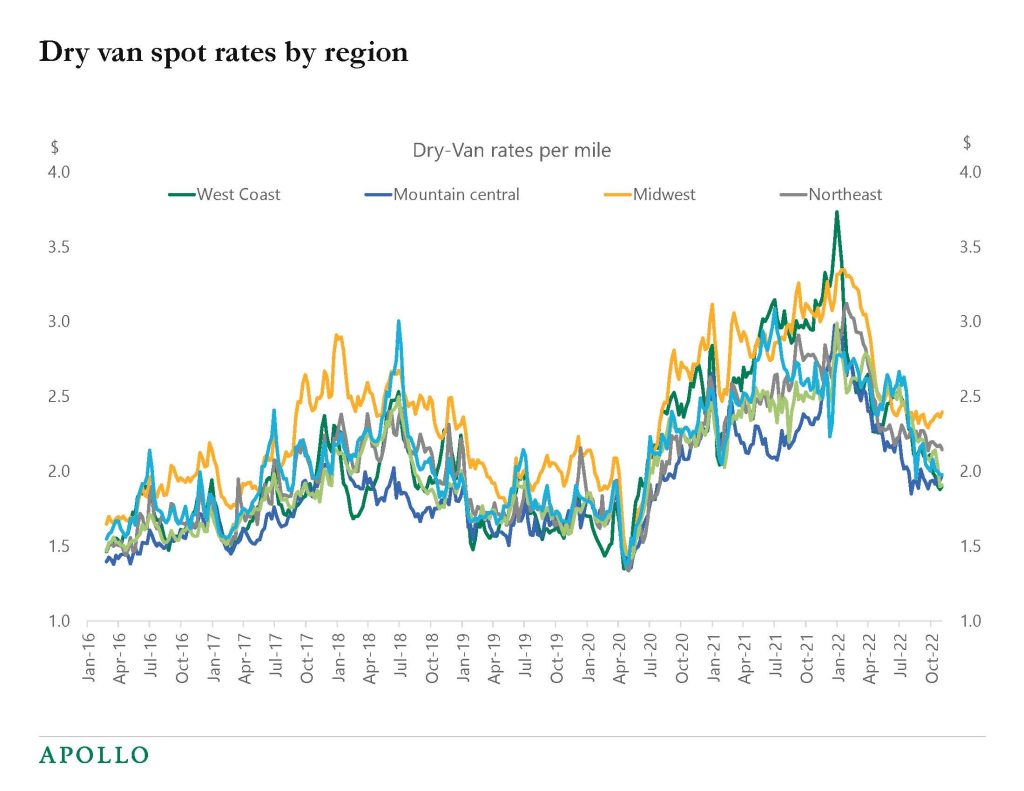
Source: Bloomberg, Apollo Chief Economist 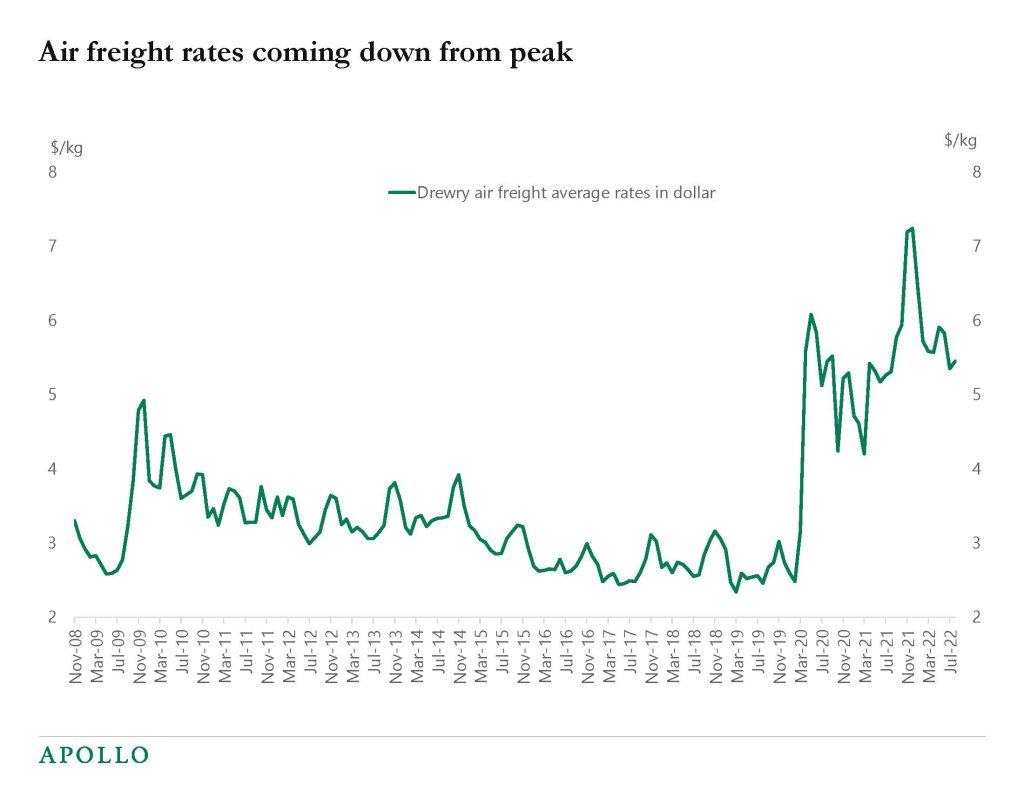
Source: Bloomberg, Apollo Chief Economist 
Source: Census, Haver Analytics, Apollo Chief Economist See important disclaimers at the bottom of the page.
-
The difference between inflation in the US and Europe is noteworthy, see chart below.
Europe is experiencing stagflation with high inflation and the economy in a recession.
The US is seeing falling inflation and still solid growth.
Our set of daily and weekly indicators is available here.
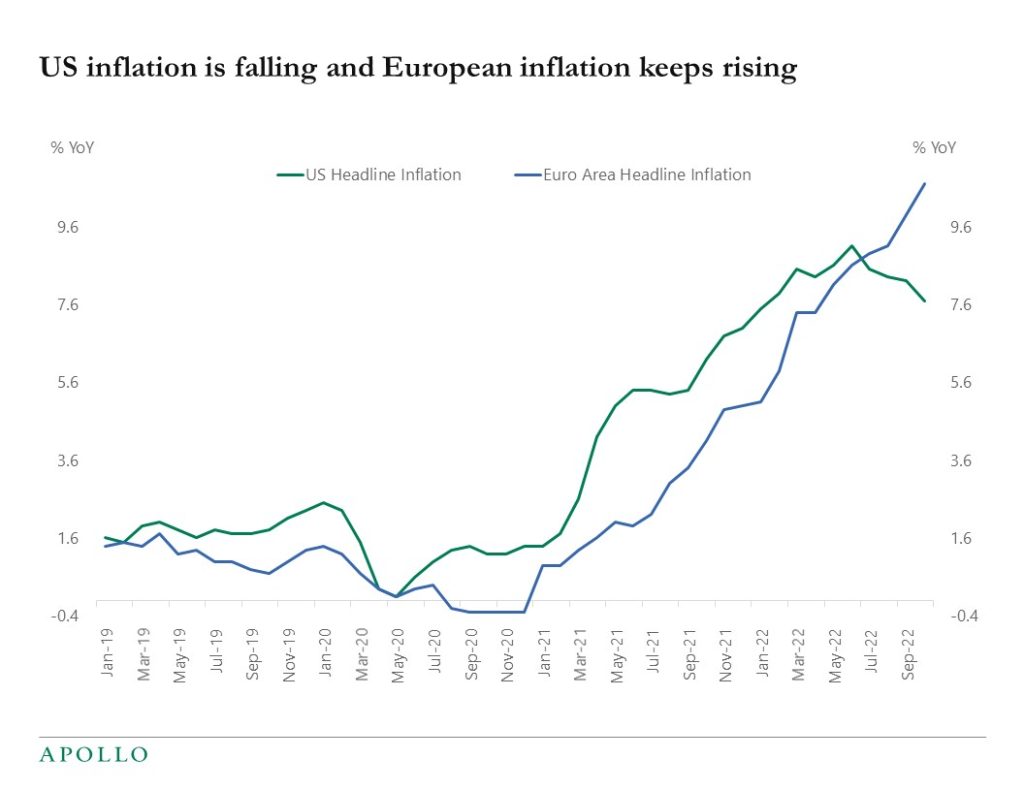
Source: Bloomberg, Apollo Chief Economist See important disclaimers at the bottom of the page.

This presentation may not be distributed, transmitted or otherwise communicated to others in whole or in part without the express consent of Apollo Global Management, Inc. (together with its subsidiaries, “Apollo”).
Apollo makes no representation or warranty, expressed or implied, with respect to the accuracy, reasonableness, or completeness of any of the statements made during this presentation, including, but not limited to, statements obtained from third parties. Opinions, estimates and projections constitute the current judgment of the speaker as of the date indicated. They do not necessarily reflect the views and opinions of Apollo and are subject to change at any time without notice. Apollo does not have any responsibility to update this presentation to account for such changes. There can be no assurance that any trends discussed during this presentation will continue.
Statements made throughout this presentation are not intended to provide, and should not be relied upon for, accounting, legal or tax advice and do not constitute an investment recommendation or investment advice. Investors should make an independent investigation of the information discussed during this presentation, including consulting their tax, legal, accounting or other advisors about such information. Apollo does not act for you and is not responsible for providing you with the protections afforded to its clients. This presentation does not constitute an offer to sell, or the solicitation of an offer to buy, any security, product or service, including interest in any investment product or fund or account managed or advised by Apollo.
Certain statements made throughout this presentation may be “forward-looking” in nature. Due to various risks and uncertainties, actual events or results may differ materially from those reflected or contemplated in such forward-looking information. As such, undue reliance should not be placed on such statements. Forward-looking statements may be identified by the use of terminology including, but not limited to, “may”, “will”, “should”, “expect”, “anticipate”, “target”, “project”, “estimate”, “intend”, “continue” or “believe” or the negatives thereof or other variations thereon or comparable terminology.