Want it delivered daily to your inbox?
-
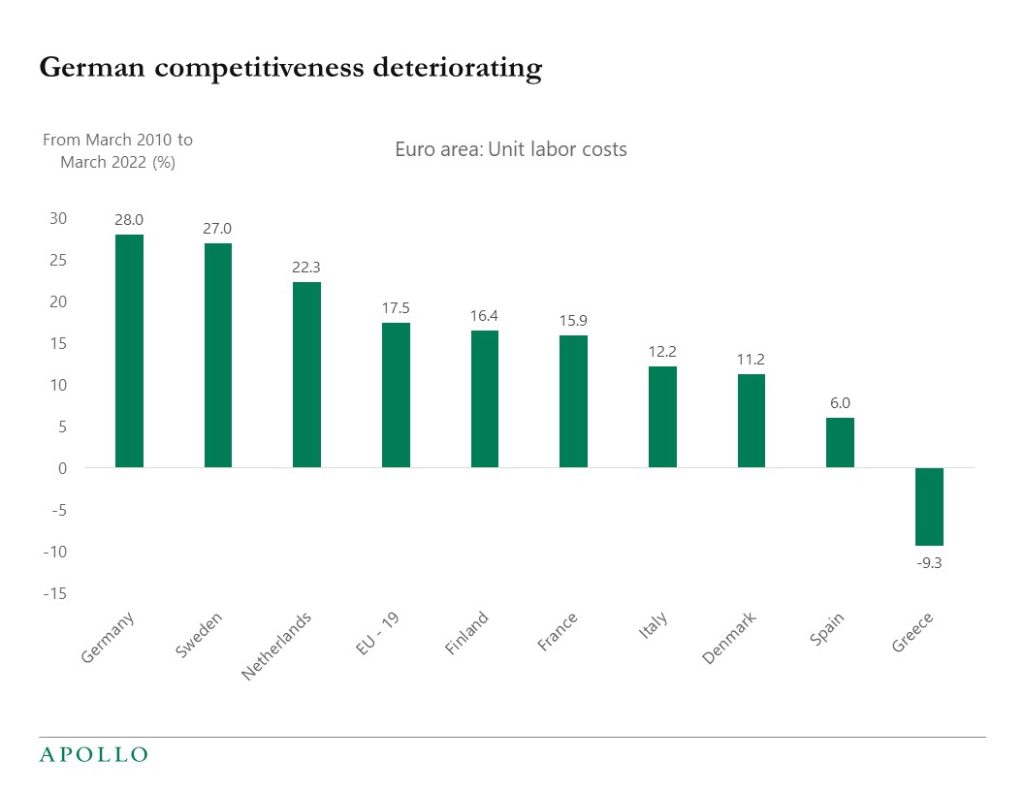
One way to measure a country’s competitiveness is to look at how much wages are rising adjusted for productivity gains, and the chart below shows that since the financial crisis wages have increased much faster than productivity in Germany. The bottom line is that Germany is becoming less competitive relative to the rest of Europe.
Source: OECD, Apollo Chief Economist See important disclaimers at the bottom of the page.
-
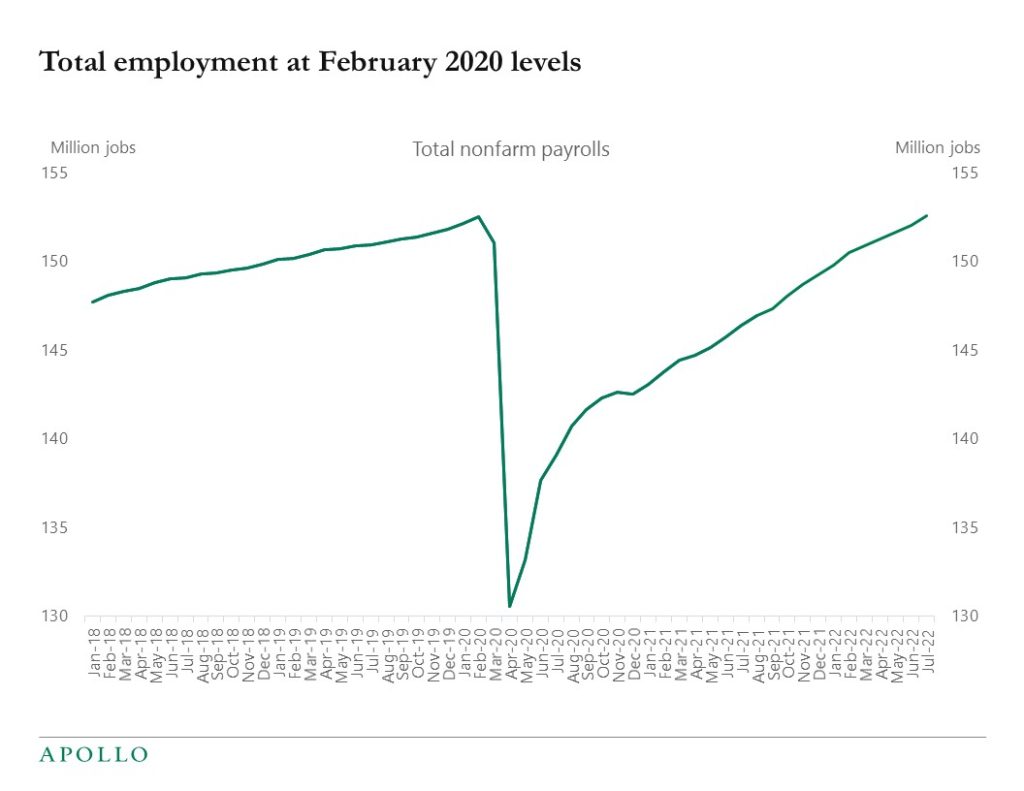
The 22 million jobs lost during the pandemic have now been recovered, see chart below. Total US employment at 153 million jobs is now back at the level seen before the pandemic in February 2020.
Source: BLS, Apollo Chief Economist See important disclaimers at the bottom of the page.
-
IMF: Natural Gas in Europe: The Potential Impact of Disruptions to Supply
https://www.imf.org/-/media/Files/Publications/WP/2022/English/wpiea2022145-print-pdf.ashx
IMF: The Economic Impacts on Germany of a Potential Russian Gas Shutoff
https://www.imf.org/-/media/Files/Publications/WP/2022/English/wpiea2022144-print-pdf.ashx
IMF: Market Size and Supply Disruptions: Sharing the Pain of a Potential Russian Gas Shut-off to the European Union
https://www.imf.org/-/media/Files/Publications/WP/2022/English/wpiea2022143-print-pdf.ashx
See important disclaimers at the bottom of the page.
-
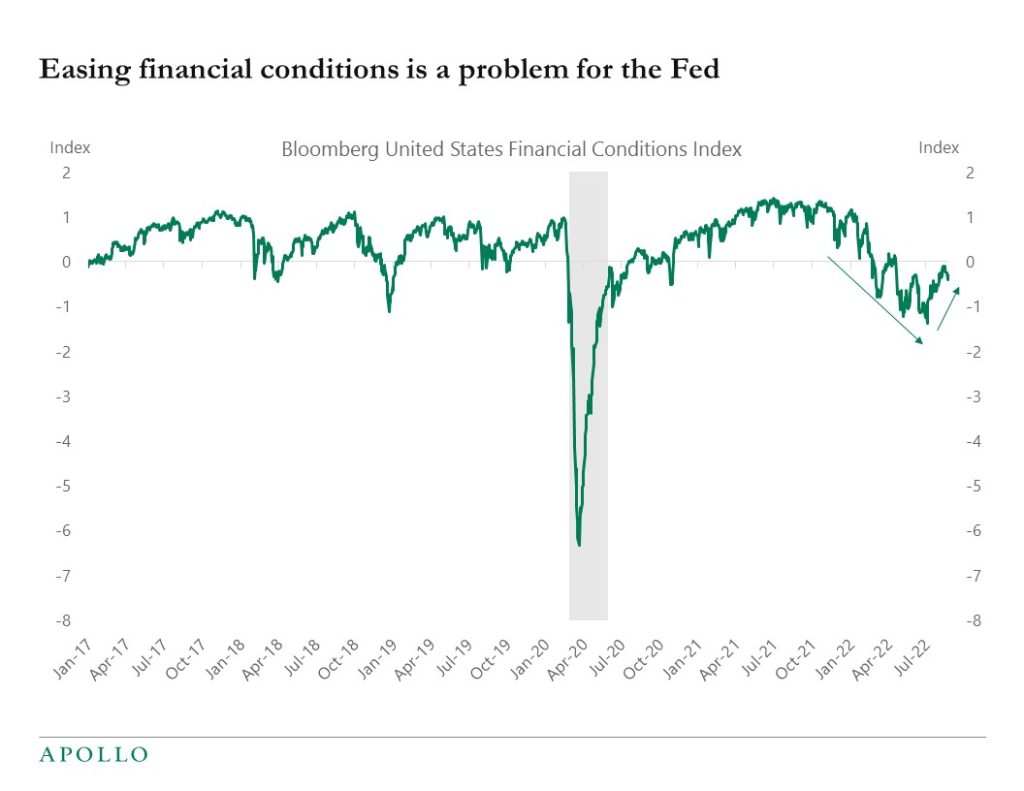
The employment report for July shows that the US economy is still not showing any signs of slowing down. With financial conditions easing, the Fed will have to continue to raise rates aggressively to cool down the economy, see chart below. Our set of daily and weekly indicators for the US economy is available here.
Source: Bloomberg, Apollo Chief Economist See important disclaimers at the bottom of the page.
-
With the spread between IG and HY narrowing over the past six weeks, the market seems to believe that the probability of a recession is declining.
This is inconsistent with the sharp decline in long rates over the same period, suggesting that the Treasury market is getting more worried about a coming slowdown in GDP growth and earnings.
Maybe the reason is that equity and credit markets focus on the past earnings season and the next earnings season, but Treasury markets have a longer horizon. Equity and credit markets are saying that in the near term, everything is fine, but Treasury markets are saying that a recession next year is likely. But both cannot be right at the same time: Either we will have a recession, and credit spreads should be wider. Or we will not have a recession, and rates should be trading higher.
Our latest credit market outlook chart book is available here.
See important disclaimers at the bottom of the page.
-
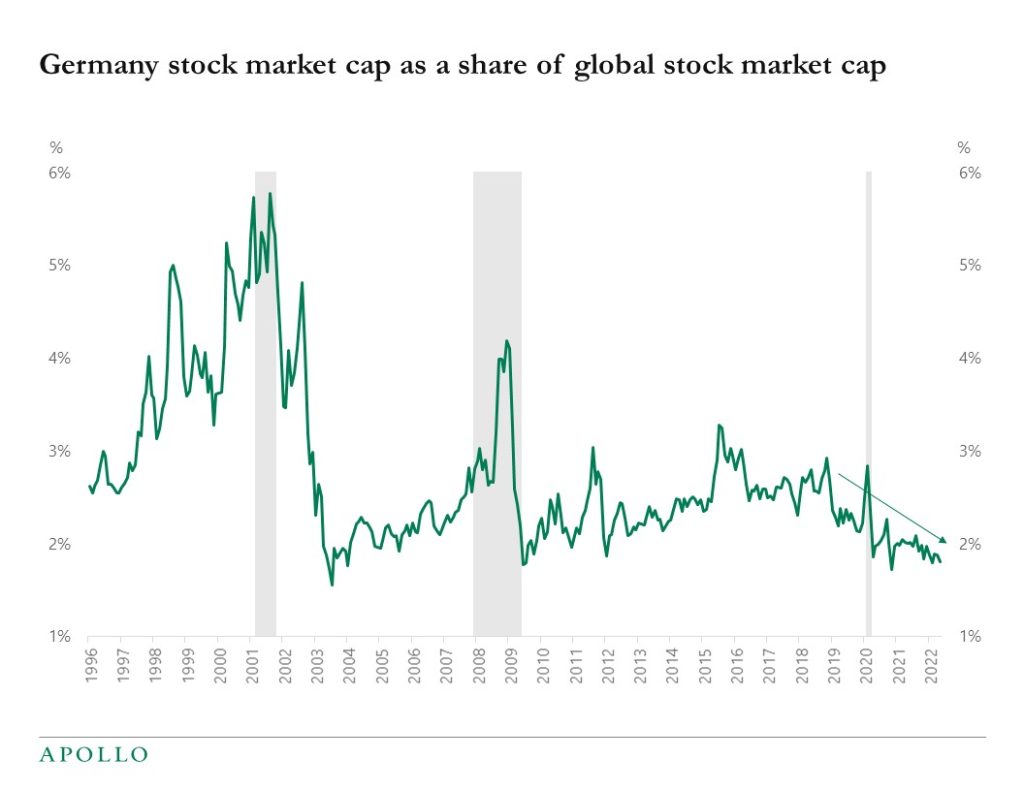
The market cap of the German stock market as a share of global stock markets is near record lows, driven by equity market underperformance and the rising dollar, see chart below. For comparison, Germany’s GDP is currently at 3% of global GDP.
Source: Bloomberg, Apollo Chief Economist See important disclaimers at the bottom of the page.
-
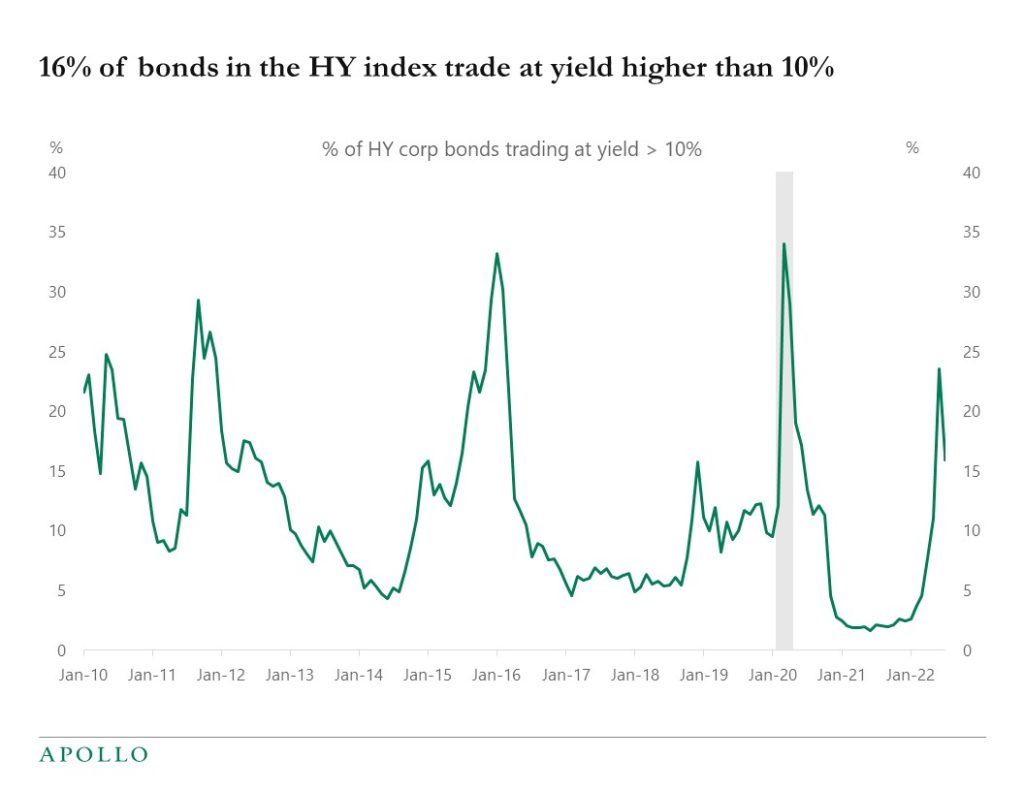
There are around 2000 bonds in the HY index and roughly 16% currently trade at a yield higher than 10%, see chart below.
Source: Bloomberg, Apollo Chief Economist. Note: HY bond universe is H0A0 Index. See important disclaimers at the bottom of the page.
-
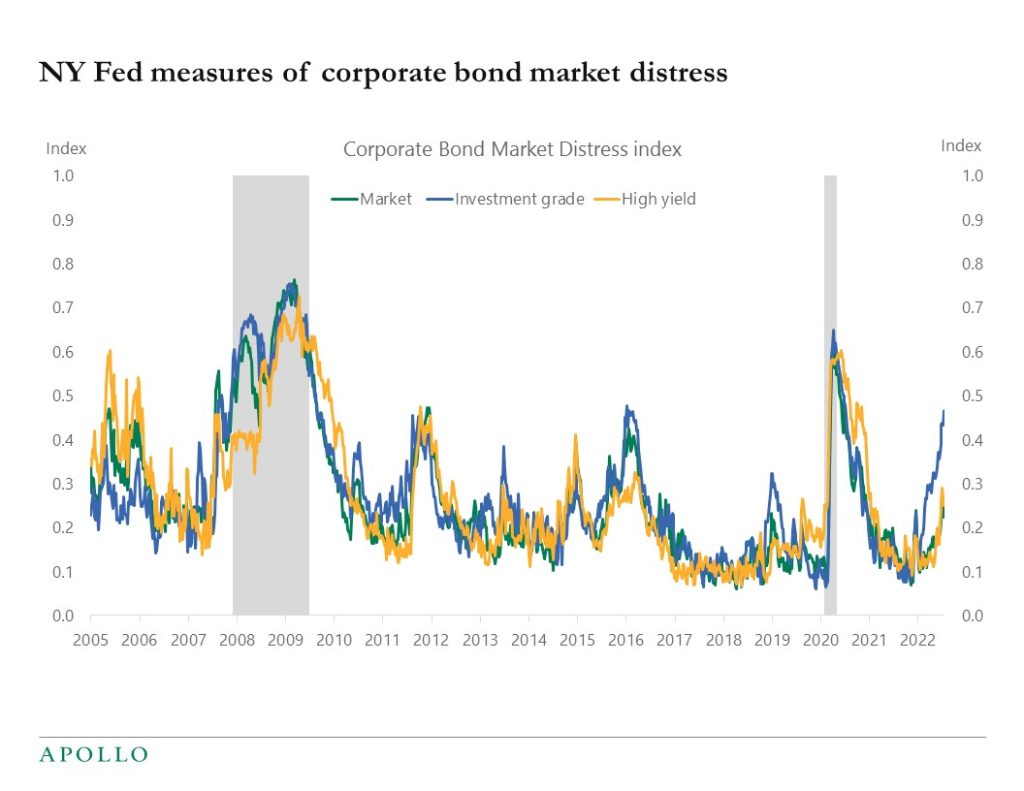
The New York Fed measure of corporate bond market distress is starting to flash red for IG, see chart below. Specifically, the New York Fed corporate bond market distress index is calculated using FISD data on issuance volumes and primary market pricing as well as issuer characteristics.
For the secondary market, the index uses trading data available through TRACE and includes measures that reflect both the central tendencies, and other aspects of the distributions, of volume, liquidity, nontraded bonds, spreads, and default-adjusted spreads. Finally, the index also uses quoted prices from ICE BoA to capture the differential secondary market conditions for traded and non-traded bonds. For more see also here.
Source: FRB of New York, Apollo Chief Economist Note: The CMDI index offers a single measure to quantify joint dislocations in the primary and secondary corporate bond markets. Ranging from 0 to 1, a higher level of CMDI corresponds with historically extreme levels of dislocation. CMDI links bond market functioning to future economic activity. See important disclaimers at the bottom of the page.
-
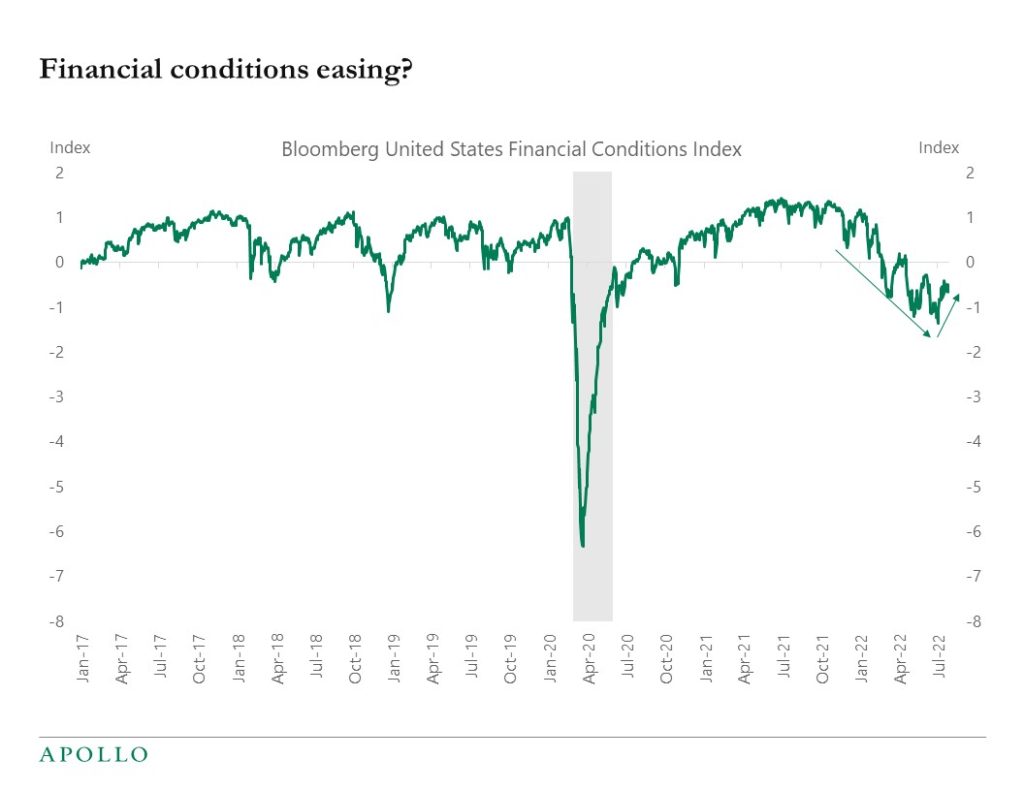
The Fed is trying to tighten financial conditions to cool down inflation, and they do this by raising the Fed funds rate. And the Fed’s models find that the neutral Fed funds rate where monetary policy is neither accommodative nor restrictive is when the Fed funds rate is 2.5%, which is where the Fed funds rate is today. Last week, the Fed argued that with the Fed funds rate now at neutral, they would drop forward guidance and instead be flexible meeting-by-meeting.
The analytical challenge is that the models estimating r-star, or the neutral Fed funds rate, only include one interest rate, namely the Fed funds rate, and don’t include the true costs of capital for firms and costs of borrowing for households such as the yields on IG, HY, and loans, and also the level of the S&P500 for companies, and the costs of borrowing on auto loans and credit cards and mortgages.
Put differently, the Fed funds rate can be at 2.5% and S&P500 at 3000, and HY spreads at 10%, and this would probably not be considered neutral.
Similarly, the Fed funds rate at 2.5%, S&P500 at 5000, and HY spreads of 3% would probably be regarded as easy financial conditions.
The bottom line is that the assumptions going into the academic models estimating the neutral Fed funds rate are simply too far away from the real world to make their estimates of r-star useful. With equities and credit now rallying, the bottom line is that the true r-star is higher, which is a different way of saying that to successfully cool the economy down, the Fed will likely have to raise rates more than the market is currently pricing.
Source: Bloomberg, Apollo Chief Economist See important disclaimers at the bottom of the page.
-
Predictably Bad Investments: Evidence from Venture Capitalists
https://papers.ssrn.com/sol3/papers.cfm?abstract_id=4135861
Central Bank Communication with the General Public
Directed Search with Phantom Vacancies
See important disclaimers at the bottom of the page.
This presentation may not be distributed, transmitted or otherwise communicated to others in whole or in part without the express consent of Apollo Global Management, Inc. (together with its subsidiaries, “Apollo”).
Apollo makes no representation or warranty, expressed or implied, with respect to the accuracy, reasonableness, or completeness of any of the statements made during this presentation, including, but not limited to, statements obtained from third parties. Opinions, estimates and projections constitute the current judgment of the speaker as of the date indicated. They do not necessarily reflect the views and opinions of Apollo and are subject to change at any time without notice. Apollo does not have any responsibility to update this presentation to account for such changes. There can be no assurance that any trends discussed during this presentation will continue.
Statements made throughout this presentation are not intended to provide, and should not be relied upon for, accounting, legal or tax advice and do not constitute an investment recommendation or investment advice. Investors should make an independent investigation of the information discussed during this presentation, including consulting their tax, legal, accounting or other advisors about such information. Apollo does not act for you and is not responsible for providing you with the protections afforded to its clients. This presentation does not constitute an offer to sell, or the solicitation of an offer to buy, any security, product or service, including interest in any investment product or fund or account managed or advised by Apollo.
Certain statements made throughout this presentation may be “forward-looking” in nature. Due to various risks and uncertainties, actual events or results may differ materially from those reflected or contemplated in such forward-looking information. As such, undue reliance should not be placed on such statements. Forward-looking statements may be identified by the use of terminology including, but not limited to, “may”, “will”, “should”, “expect”, “anticipate”, “target”, “project”, “estimate”, “intend”, “continue” or “believe” or the negatives thereof or other variations thereon or comparable terminology.


