Want it delivered daily to your inbox?
-
Fed: Vulnerable Workers and the State of the U.S. Labor Market
https://www.stlouisfed.org/on-the-economy/2022/sep/vulnerable-workers-state-us-labor-market
Fed: The Financial Stability Implications of Digital Assets
https://www.federalreserve.gov/econres/feds/files/2022058pap.pdf
Fed: The Reversal Interest Rate
https://www.philadelphiafed.org/-/media/frbp/assets/working-papers/2022/wp22-28.pdf
See important disclaimers at the bottom of the page.
-
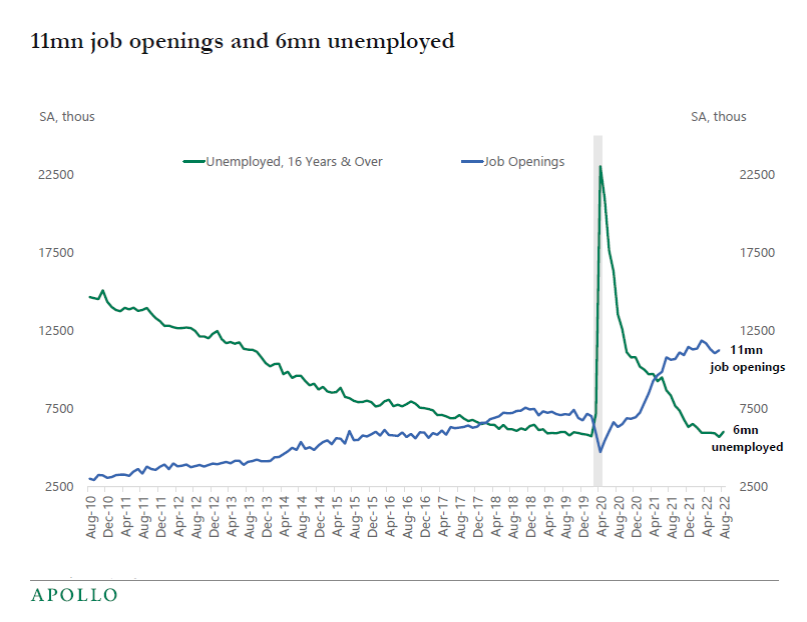
The labor market is still tight with 6 million unemployed and 11 million job openings, see chart below and this chart book.
The labor market continues to be tight, and the OIS curve is currently pricing that the Fed funds rate will peak at just below 4% in March 2023, but the risks are rising that the Fed will need to raise rates more to slow down hiring and cool down inflation.
Source: BLS, Haver Analytics, Apollo Chief Economist See important disclaimers at the bottom of the page.
-
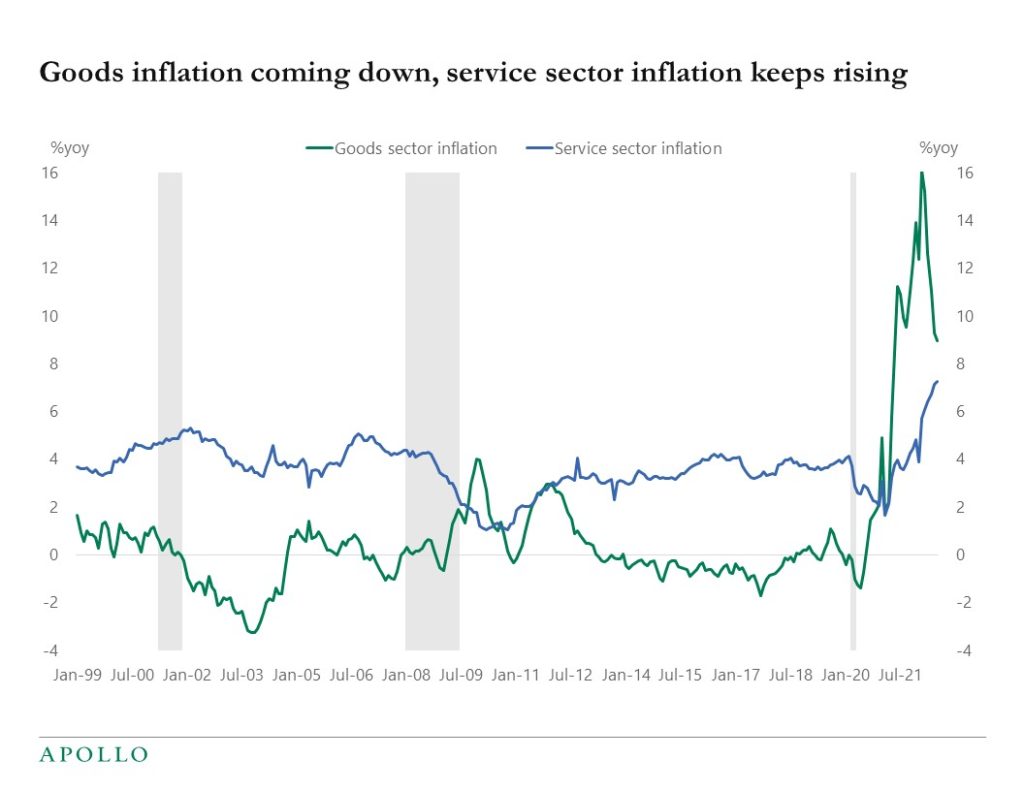
The inflation outlook is complicated by the goods sector (including housing and autos) cooling down, and the service sector, including the labor market, still overheating.
With the service sector making up 2/3 of the economy, the Fed is likely worried that goods inflation may be coming down, but service sector inflation continues to rise, see chart below.
The bottom line is that we will need to see a meaningful softening in the labor market for the Fed to slow down the speed of rate hikes. This is not expected in today’s employment report, where the consensus sees headline nonfarm payrolls growing at 300K, wage inflation rising to 5.3%, and the unemployment rate staying steady at 3.5%, the lowest level in over 50 years.
In short: As long as hiring remains strong and wage growth remains high, the Fed will keep raising rates, and equities and credit will be under pressure because of the negative impact of higher wage and cost inflation on margins. And once the labor market starts softening, the market will turn its attention to the speed of the softening and whether it is a soft landing or a hard landing, i.e. a recession.
For investors, the implication is that we need inflation to come down from 8.5% and closer to the Fed’s 2% target, and we need a soft landing in the labor market before we can get a sustained rally in equities and credit.
Source: BLS, Haver Analytics, Apollo Chief Economist See important disclaimers at the bottom of the page.
-
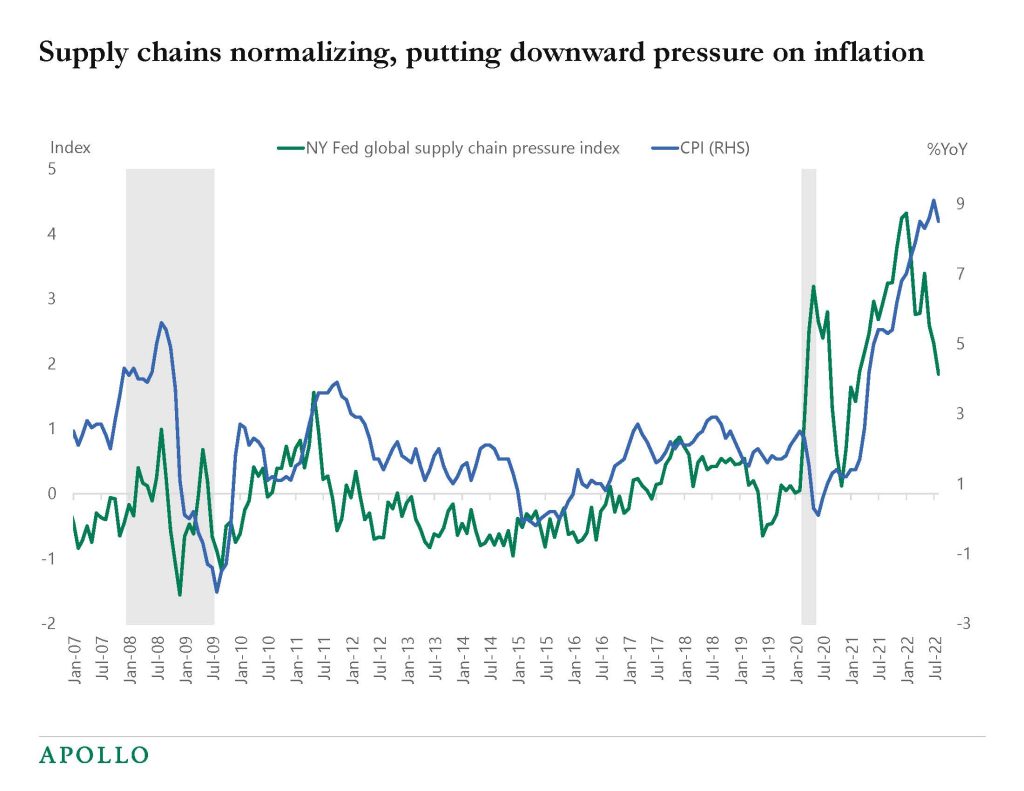
The attached presentation looks at the ongoing normalization of supply chains. Transportation costs are declining across all types (container, truck, train, air), delivery times are normalizing, the average of unfilled orders is normalizing, the New York Fed supply chain pressure index is normalizing, and the number of container vessels at Long Beach/Los Angeles is back at pre-pandemic levels. If supply-side problems drove two-thirds of the increase in inflation, then we could see a quick decline in inflation over the coming quarters.
Source: NY Fed, BLS, Haver Analytics, Apollo Chief Economist See important disclaimers at the bottom of the page.
-
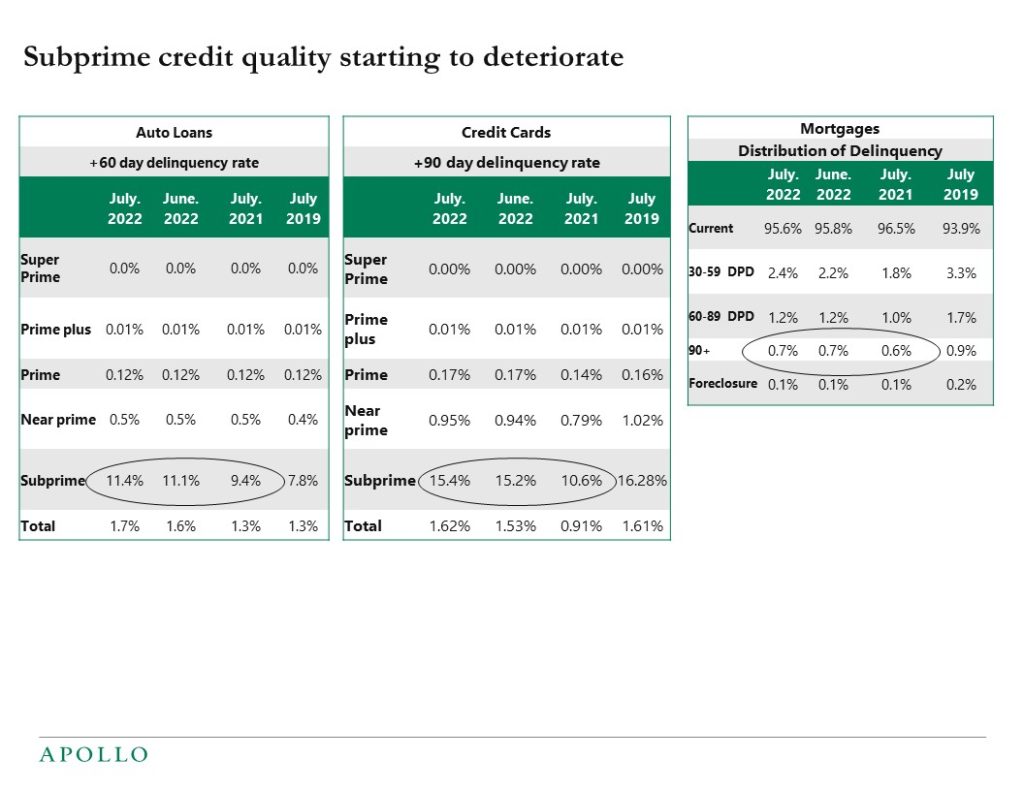
Delinquency rates for subprime borrowers are starting to rise, see chart below.
Source: Transunion Monthly Industry Snapshot July 2022 See important disclaimers at the bottom of the page.
-
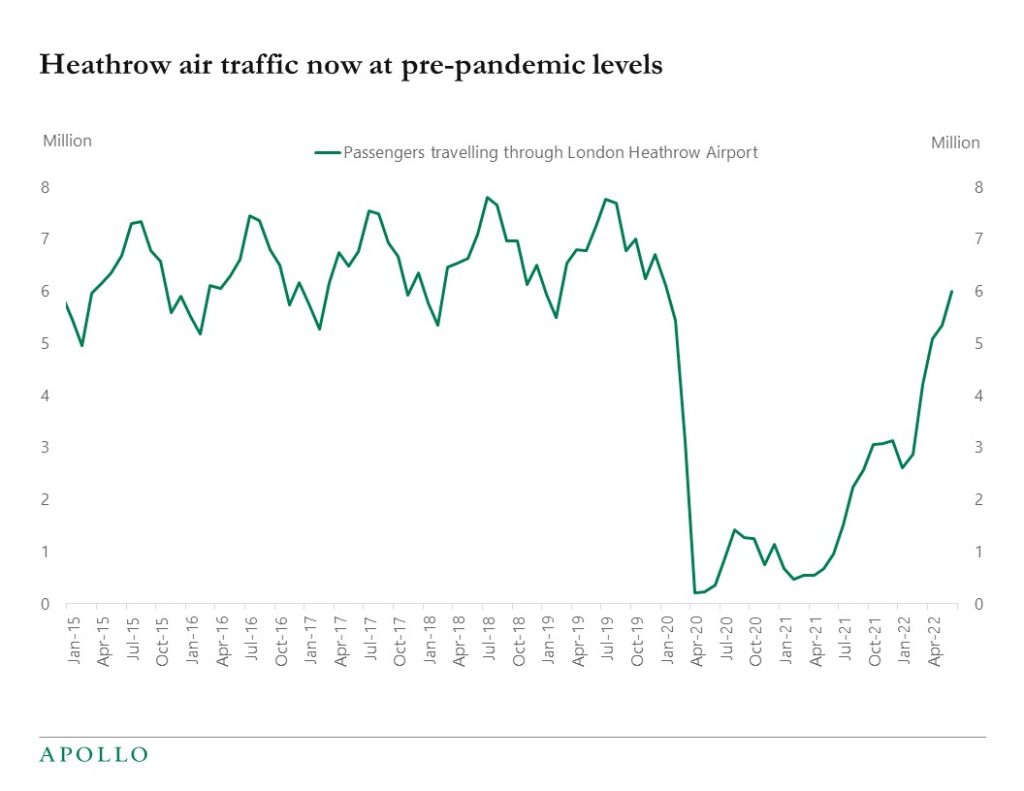
Air traffic in London’s Heathrow airport is back at pre-pandemic levels, and US air traffic to Europe is also at pre-pandemic levels, but US air traffic to Asia is still significantly below 2019 levels, see charts below.
Source: Bloomberg, Apollo Chief Economist 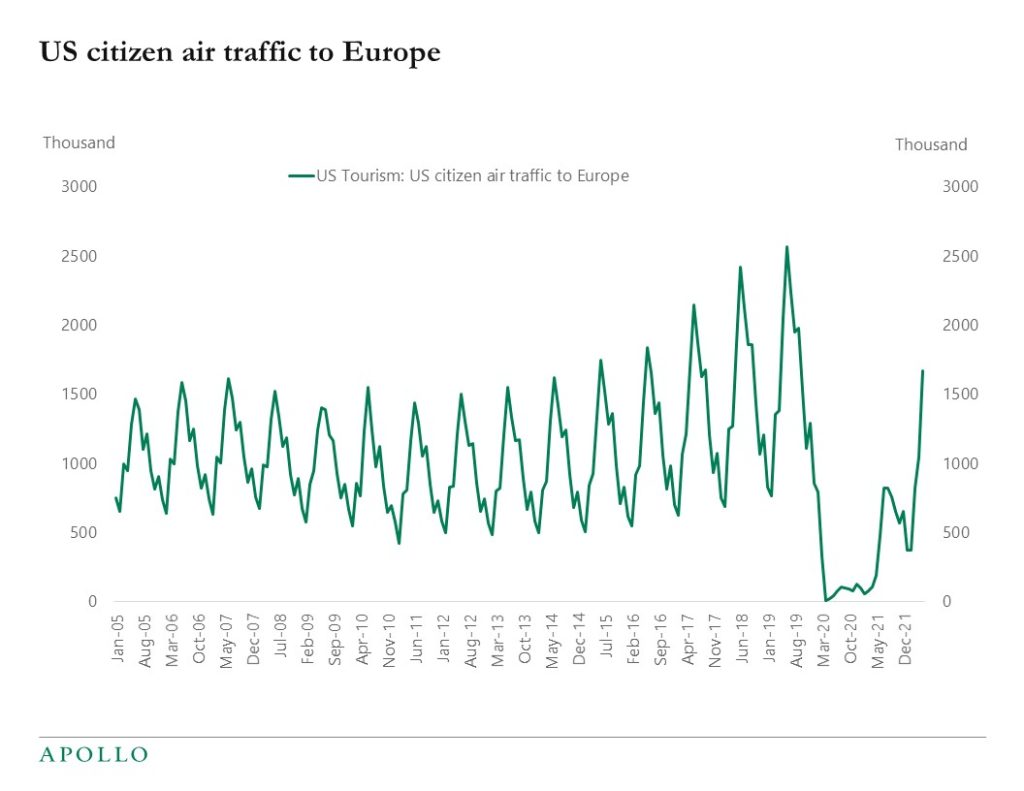
Source: Haver, Apollo Chief Economist 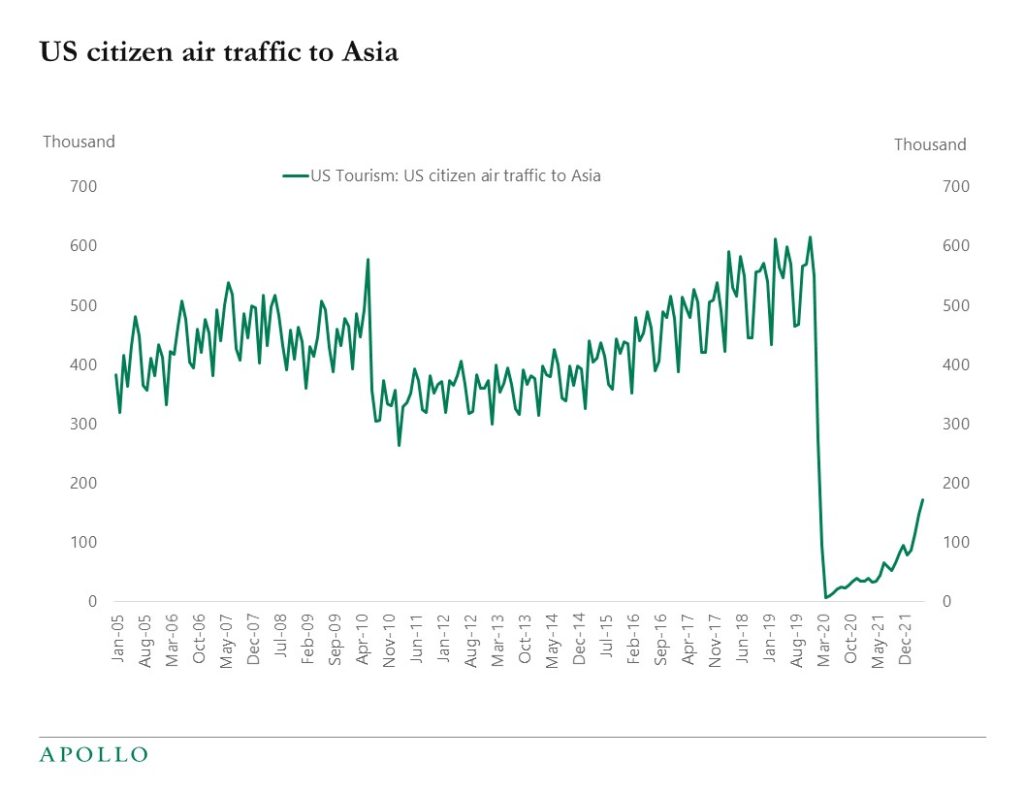
Source: Haver, Apollo Chief Economist See important disclaimers at the bottom of the page.
-
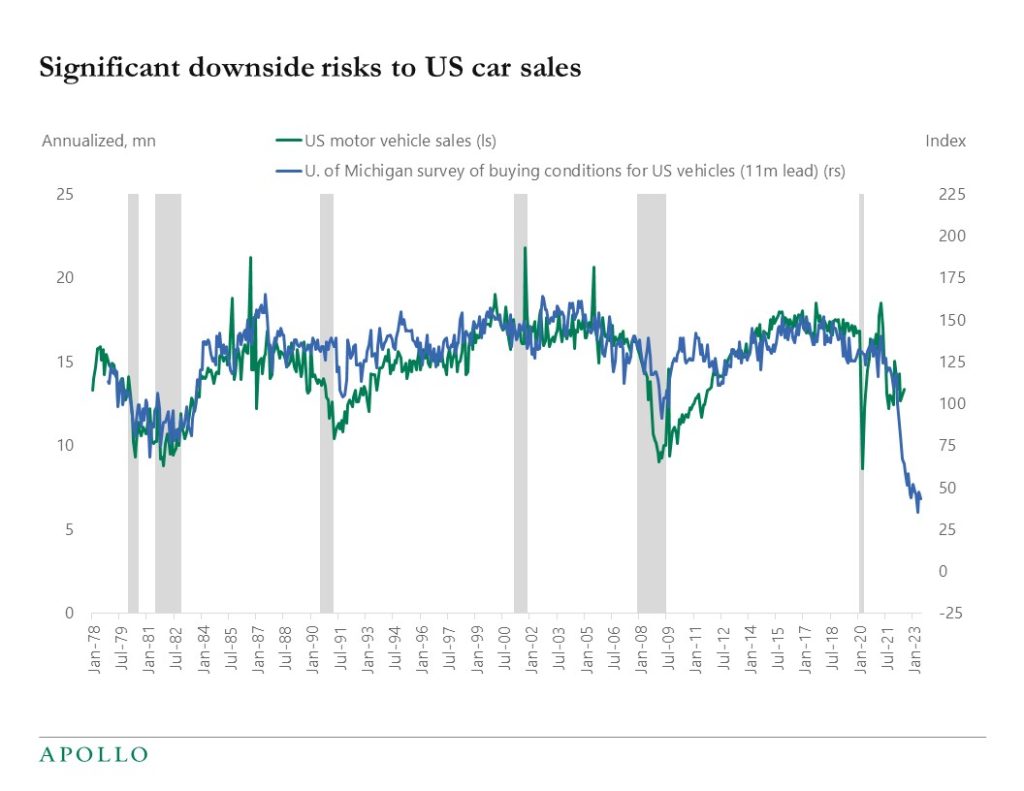
The interest-rate sensitive components of GDP are starting to respond to higher rates and recession worries, see charts below
Source: Bloomberg, Apollo Chief Economist 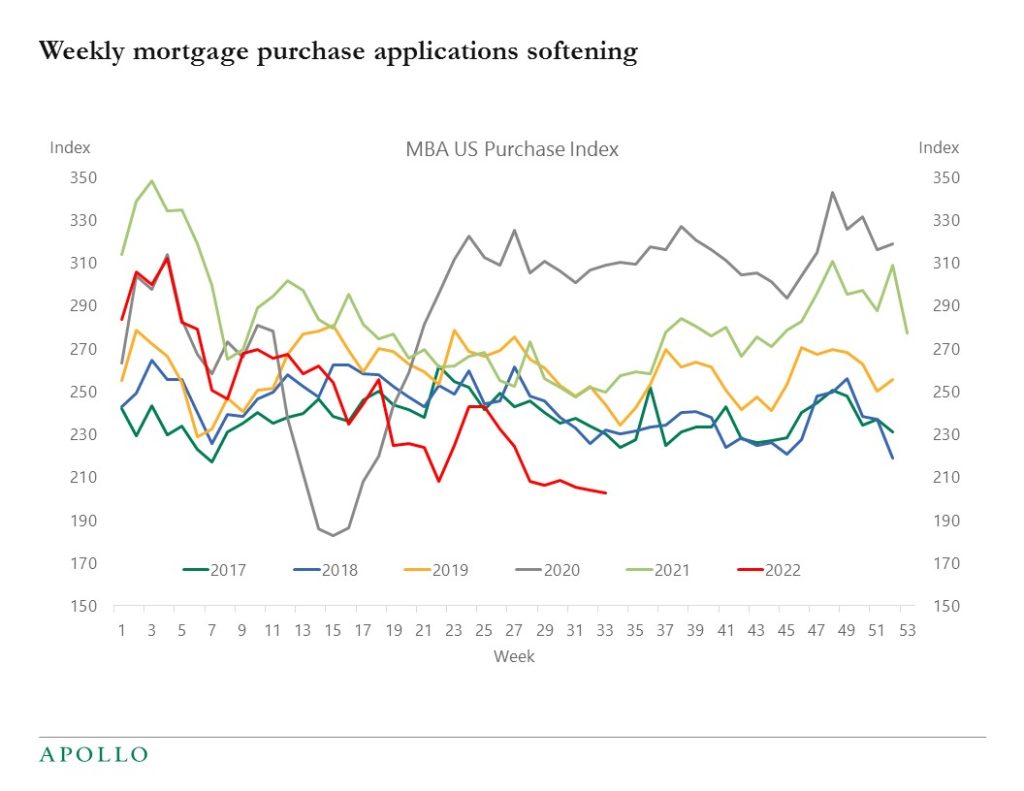
Source: Mortgage Bankers Association, Bloomberg, Apollo Chief Economist See important disclaimers at the bottom of the page.
-
Weekly jobless claims declined this week and US indicators for air travel, hotel bookings, and restaurant visits continue to show no signs of slowing down, see chart below. Inflation at 8.5% is too high, and the labor market is overheated, with unemployment at 3.5%. The only part of the economy slowing down is housing. Our weekly Slowdown Watch is available here.
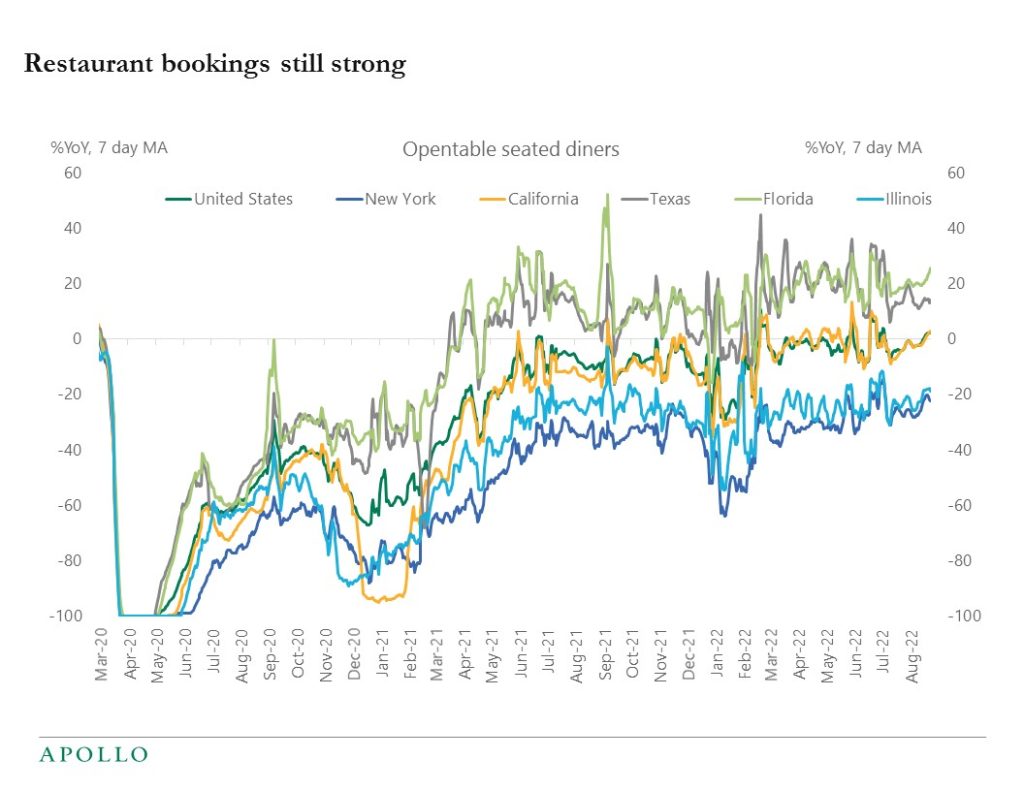
Source: OpenTable, Apollo Chief Economist See important disclaimers at the bottom of the page.
-
A new Brookings piece looks at Census data and finds that about 4 million workers are out of work because of long covid.
For comparison, the total number of unemployed is about 6 million, and total employment is 153 million.
The bottom line is that long covid is a key reason why there are labor shortages and hence why wage inflation remains so high.
It is difficult for the Fed to increase the labor supply, but by raising interest rates, the FOMC can lower labor demand and increase the unemployment rate to get wage and price inflation down to the Fed’s target.
The challenge for the Fed is that the unemployment rate has not increased yet, so the Fed will likely have to raise rates more than the market currently expects to get the softening in the labor market that is needed to get inflation down to sustainable levels.
See important disclaimers at the bottom of the page.
-
The costs of transporting goods are normalizing across all types of transportation, see charts below. For example, the dry van spot rate per mile has declined over the past six months from $3 to $2. This is all putting downward pressure on inflation and costs of production.
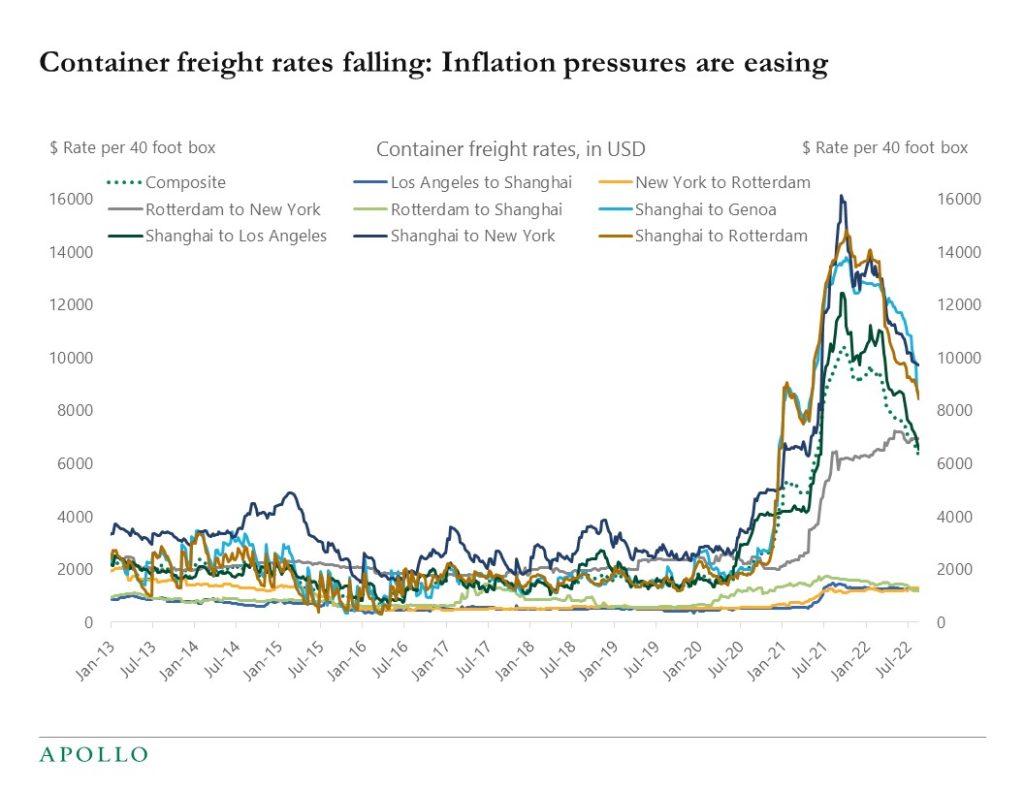
Source: WCI, Bloomberg, Apollo Chief Economist 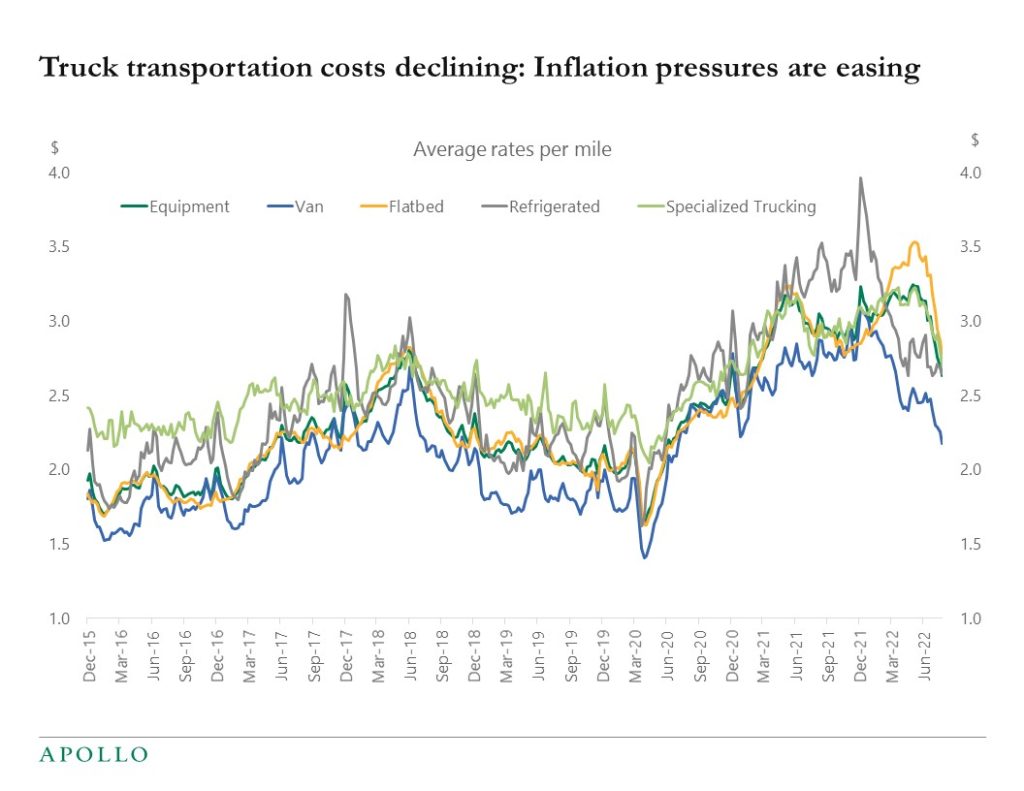
Source: Bloomberg, Apollo Chief Economist 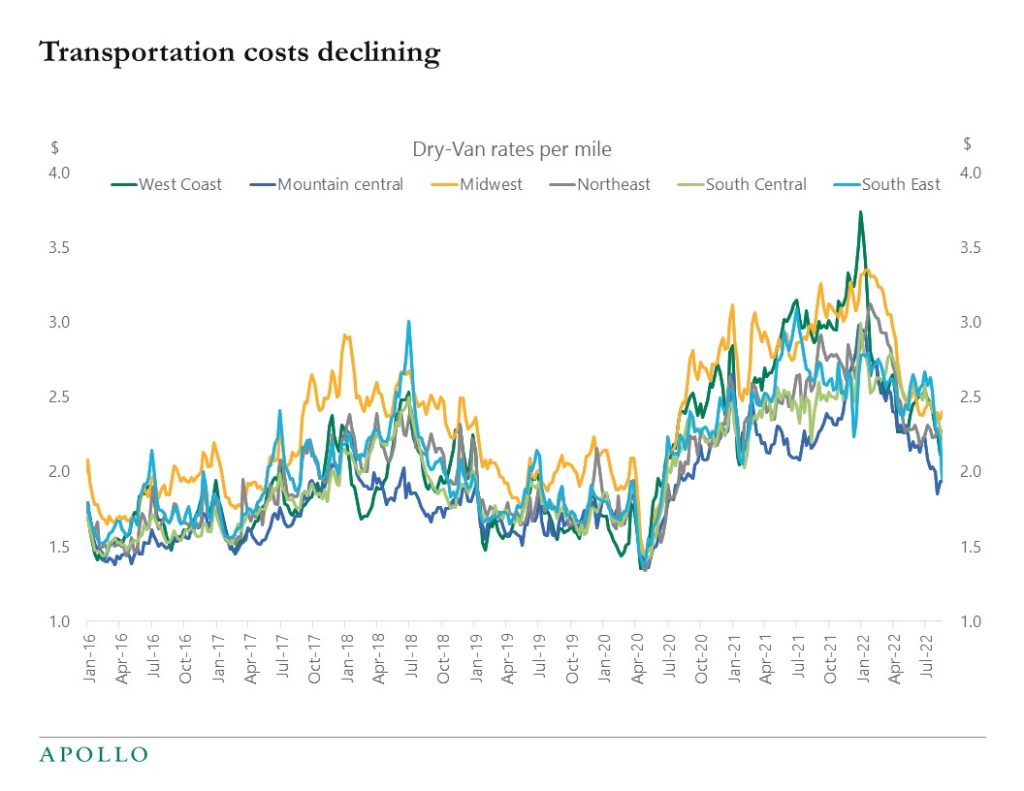
Source: Bloomberg, Apollo Chief Economist See important disclaimers at the bottom of the page.
This presentation may not be distributed, transmitted or otherwise communicated to others in whole or in part without the express consent of Apollo Global Management, Inc. (together with its subsidiaries, “Apollo”).
Apollo makes no representation or warranty, expressed or implied, with respect to the accuracy, reasonableness, or completeness of any of the statements made during this presentation, including, but not limited to, statements obtained from third parties. Opinions, estimates and projections constitute the current judgment of the speaker as of the date indicated. They do not necessarily reflect the views and opinions of Apollo and are subject to change at any time without notice. Apollo does not have any responsibility to update this presentation to account for such changes. There can be no assurance that any trends discussed during this presentation will continue.
Statements made throughout this presentation are not intended to provide, and should not be relied upon for, accounting, legal or tax advice and do not constitute an investment recommendation or investment advice. Investors should make an independent investigation of the information discussed during this presentation, including consulting their tax, legal, accounting or other advisors about such information. Apollo does not act for you and is not responsible for providing you with the protections afforded to its clients. This presentation does not constitute an offer to sell, or the solicitation of an offer to buy, any security, product or service, including interest in any investment product or fund or account managed or advised by Apollo.
Certain statements made throughout this presentation may be “forward-looking” in nature. Due to various risks and uncertainties, actual events or results may differ materially from those reflected or contemplated in such forward-looking information. As such, undue reliance should not be placed on such statements. Forward-looking statements may be identified by the use of terminology including, but not limited to, “may”, “will”, “should”, “expect”, “anticipate”, “target”, “project”, “estimate”, “intend”, “continue” or “believe” or the negatives thereof or other variations thereon or comparable terminology.


