Want it delivered daily to your inbox?
-
QE had a positive impact on the stock market and QT will have the opposite effect see chart below.
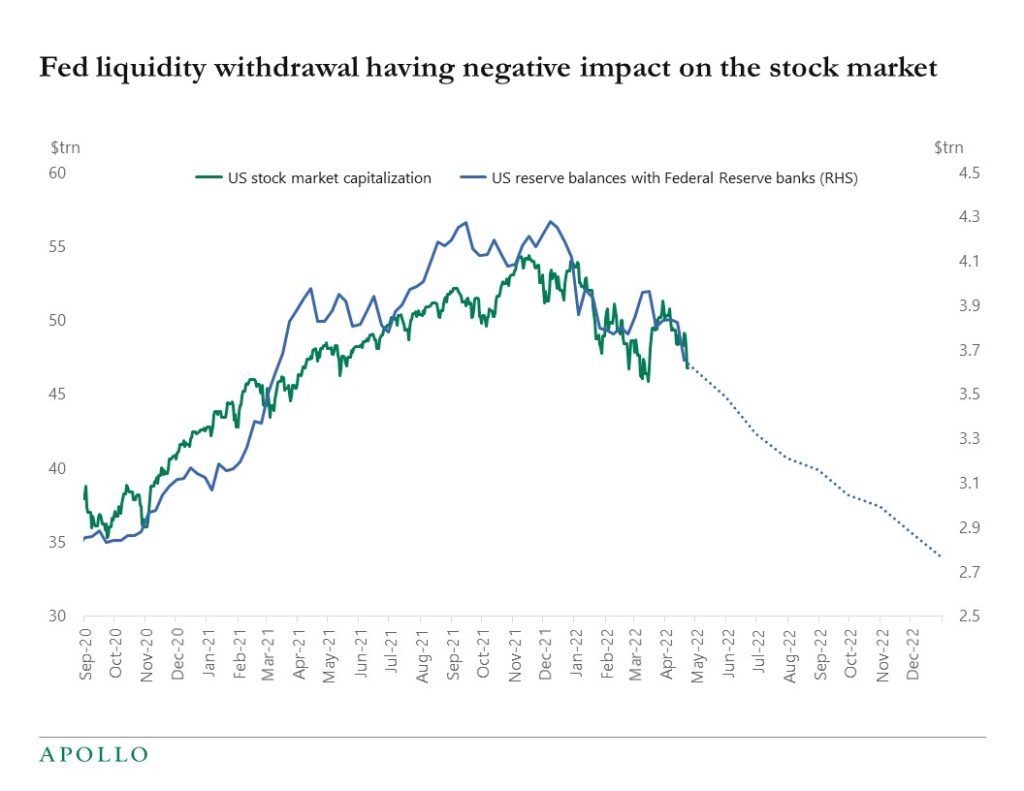
Source: Bloomberg, Apollo Chief Economist. Note: US reserve balance forecast generated by regressing reserve balances on Fed Funds target rate and Fed balance sheet. See important disclaimers at the bottom of the page.
-
The weekly data for bankruptcy filings have shown a modest uptick in recent weeks see chart below. This data is for companies with more than $50mn in liabilities. With the Fed keen on slowing down inflation investors must monitor high-frequency data for any sign of monetary policy beginning to cool down the economy.
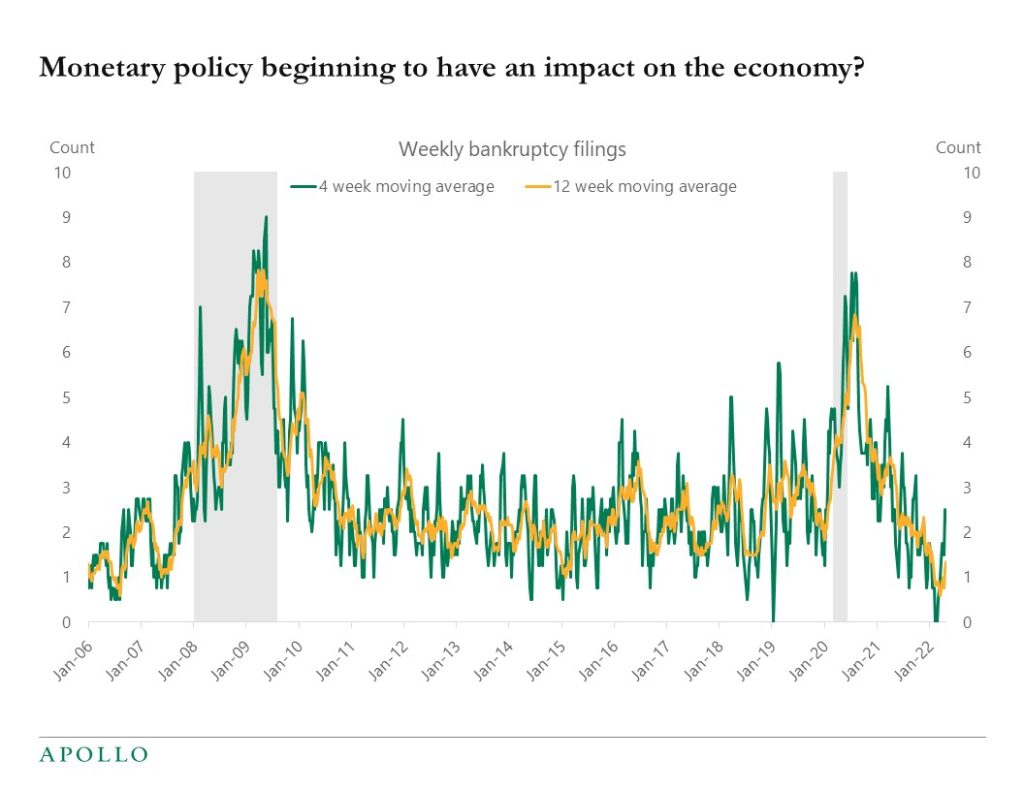
Source: Bloomberg, Apollo Chief Economist. Note: Filings are for companies with more than $50mn in liabilities See important disclaimers at the bottom of the page.
-
Yes, interest rates have increased, but 61% of all bonds in the world still trade at less than 3%. See chart below.
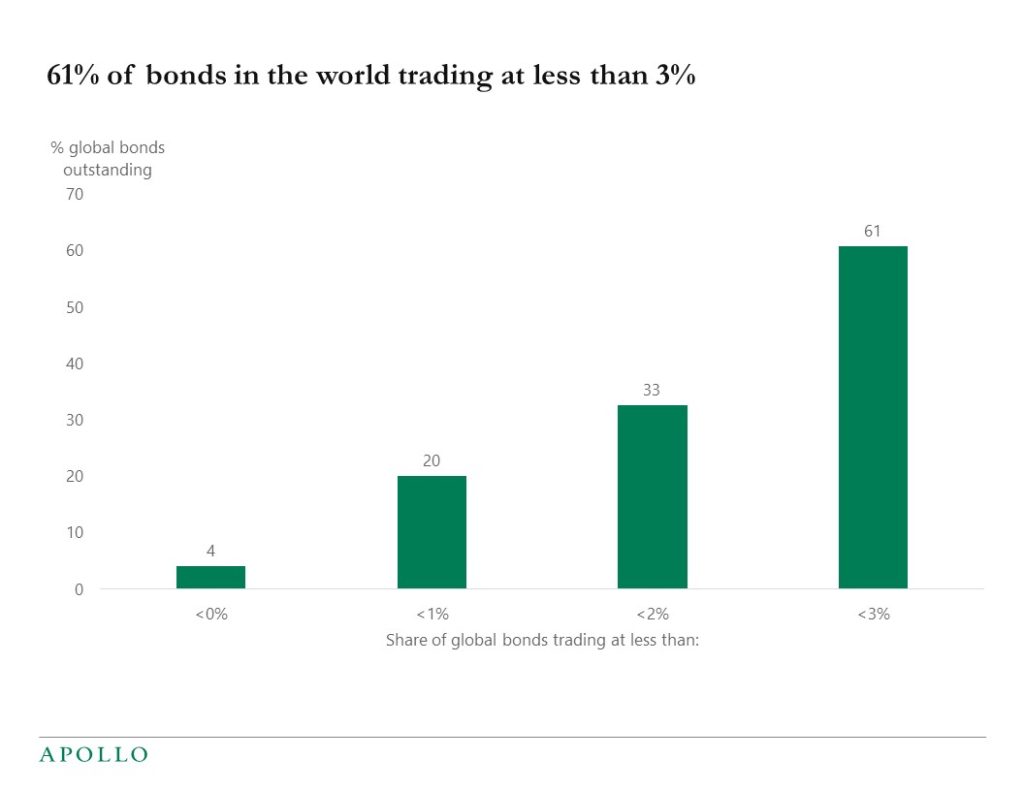
Source: Bloomberg, Apollo Chief Economist See important disclaimers at the bottom of the page.
-
I had a 45-minute conversation with Nic Millikan at CAIS about the outlook for markets and asset allocation including for alternatives:
See important disclaimers at the bottom of the page.
-
The chart below shows consensus expectations for GDP growth and consensus expectations for earnings growth over the coming quarters. Economists see growth slowing as we go through 2022. Equity investors see a rebound. This is not consistent. Either equity investors are too optimistic or economic forecasters are too pessimistic.
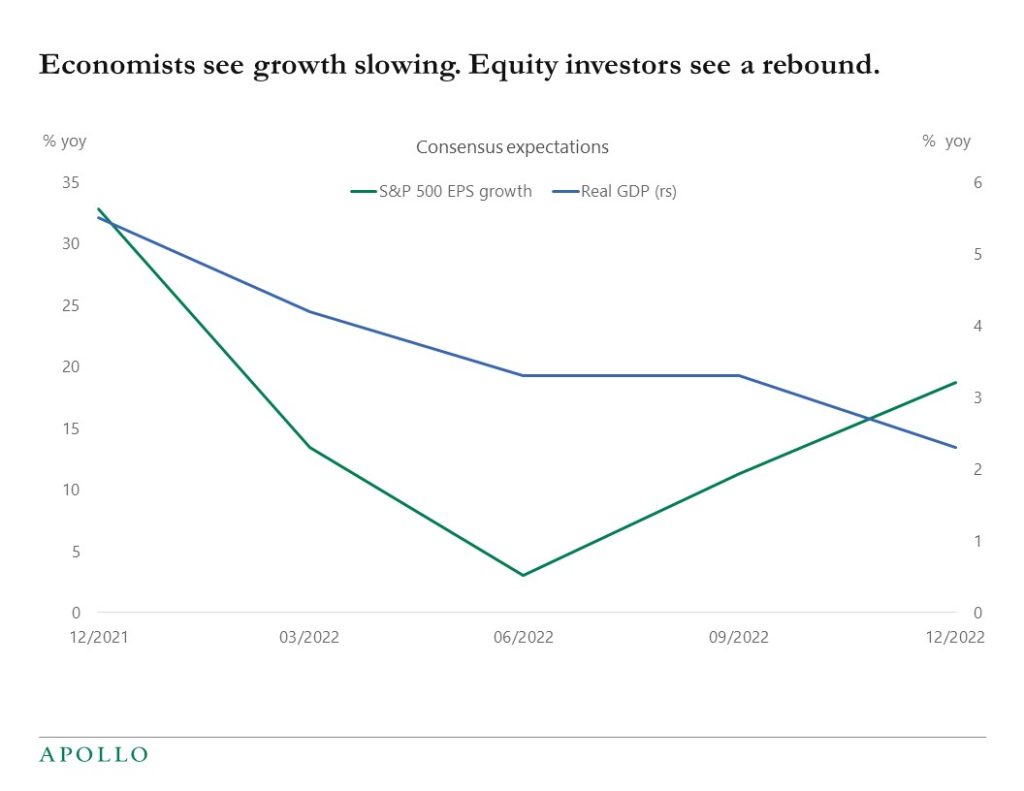
Source: Bloomberg, Apollo Chief Economist See important disclaimers at the bottom of the page.
-
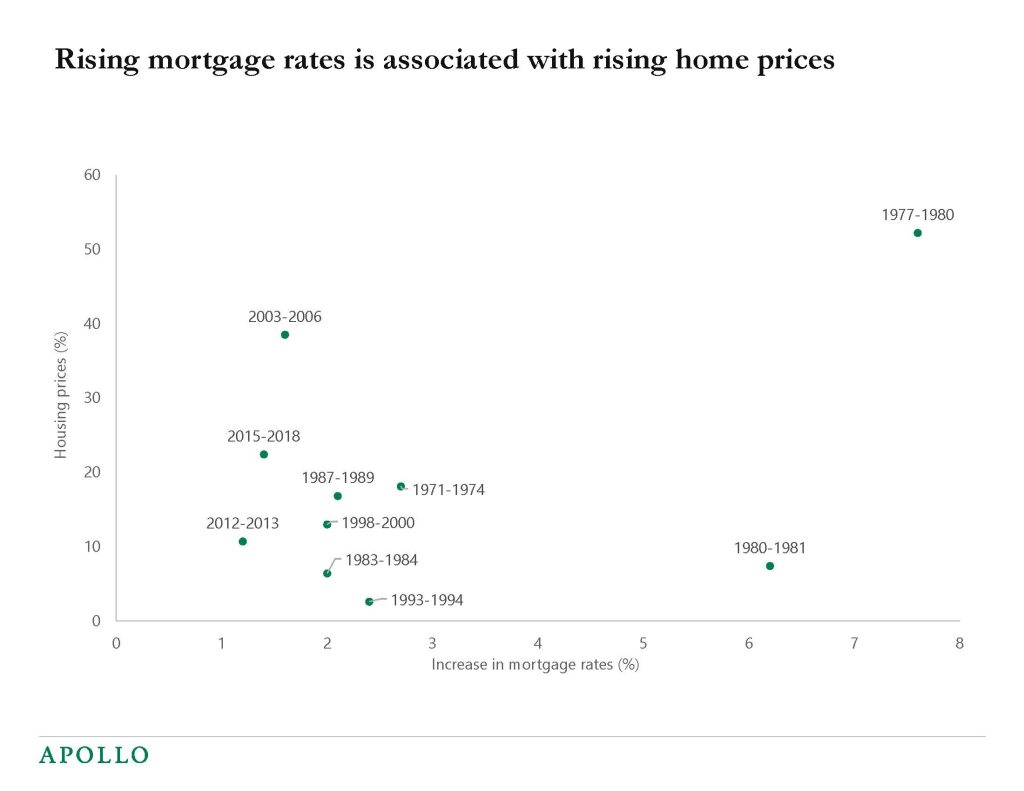
When mortgage rates go up, home prices rise. This may sound counter-intuitive, but the logic is simply that when growth is strong and incomes go up, the housing market also tends to be strong, leading to a more hawkish Fed and higher rates.
The chart below shows that episodes with a positive correlation between rising rates and rising home prices typically last several years. For more see also our US housing outlook.
Source: FRED, Apollo Chief Economist See important disclaimers at the bottom of the page.
-
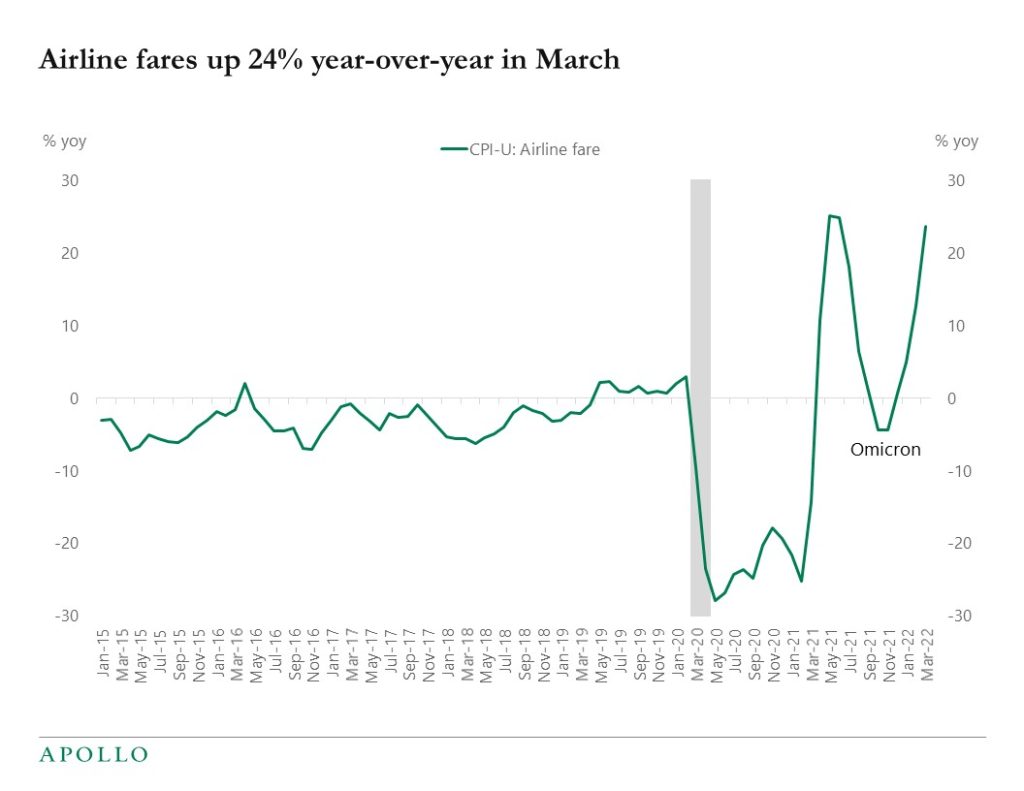
Airfares increased 10% month over month in March bringing the annual increase in ticket prices to 24%, see chart below.
Source: BLS, Apollo Chief Economist See important disclaimers at the bottom of the page.
-
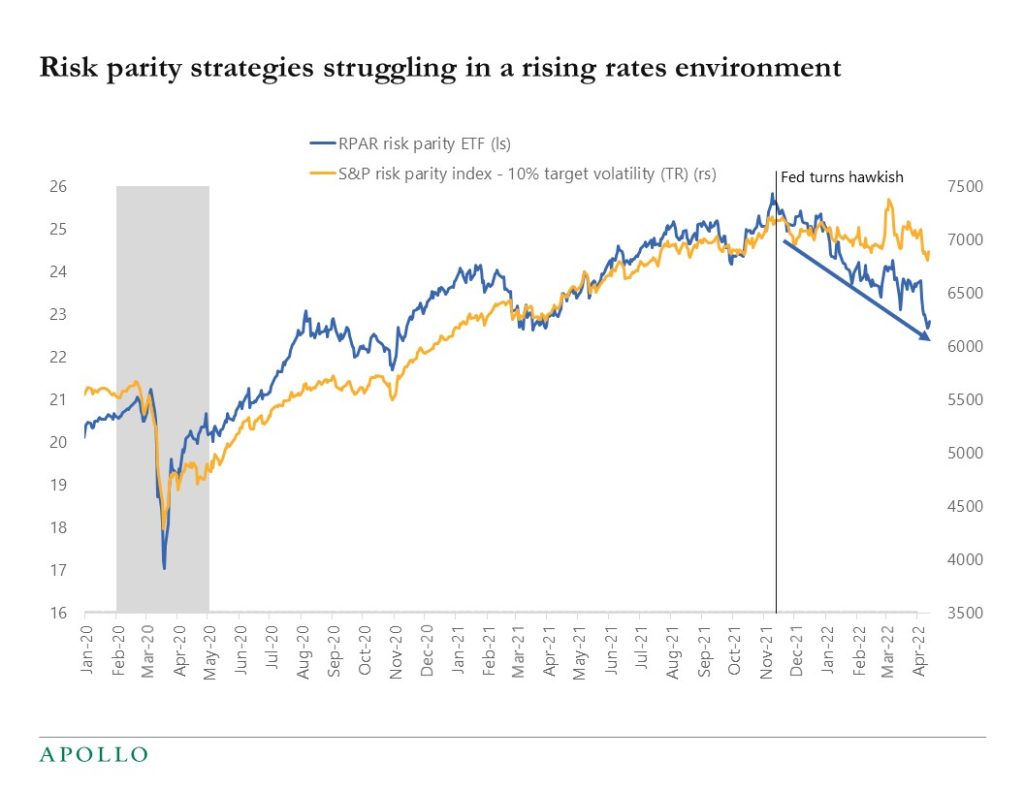
Risk parity has not worked well since the Fed turned hawkish in November, see chart below. Also, quant strategies assuming stable historical relationships are not working very well at the moment simply because they have not seen these levels of inflation before.
Source: Bloomberg, Apollo Chief Economist (BBG ticker: RPAR US Equity, SPRP10T Index ) See important disclaimers at the bottom of the page.
-
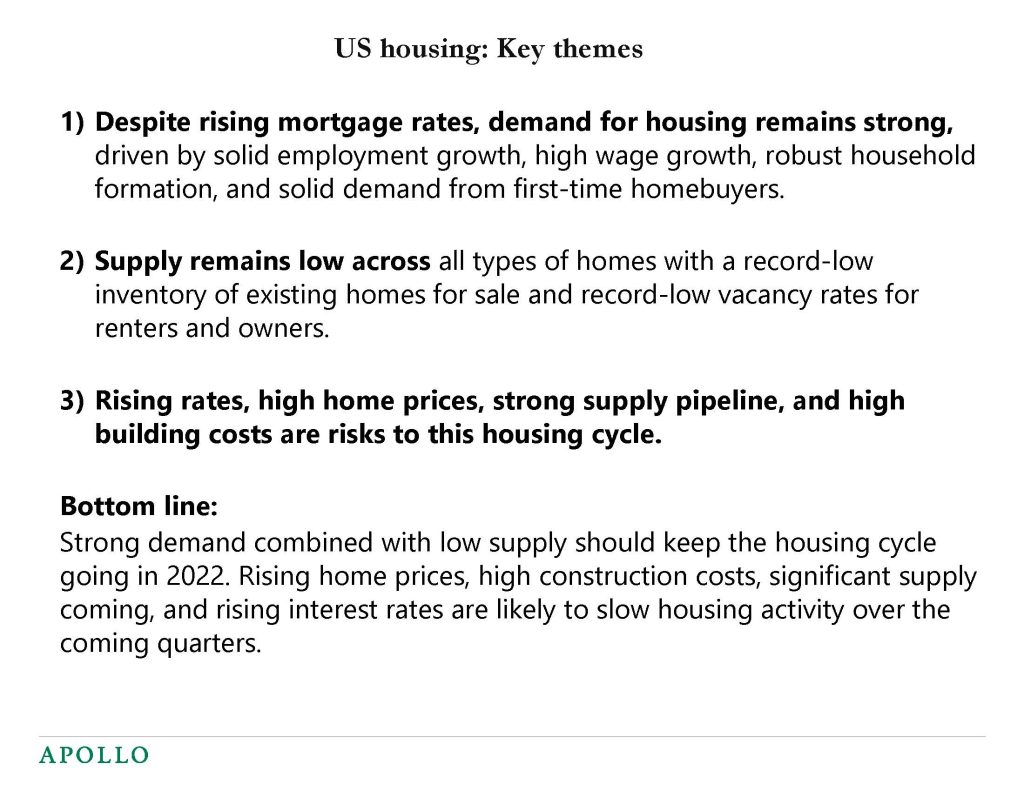
Our latest US housing outlook is available here, and the bottom line is that despite rising mortgage rates, demand for housing remains strong. Combined with record-low supply the housing market is expected to continue to do well over the coming quarters. A soft landing remains the most likely scenario.
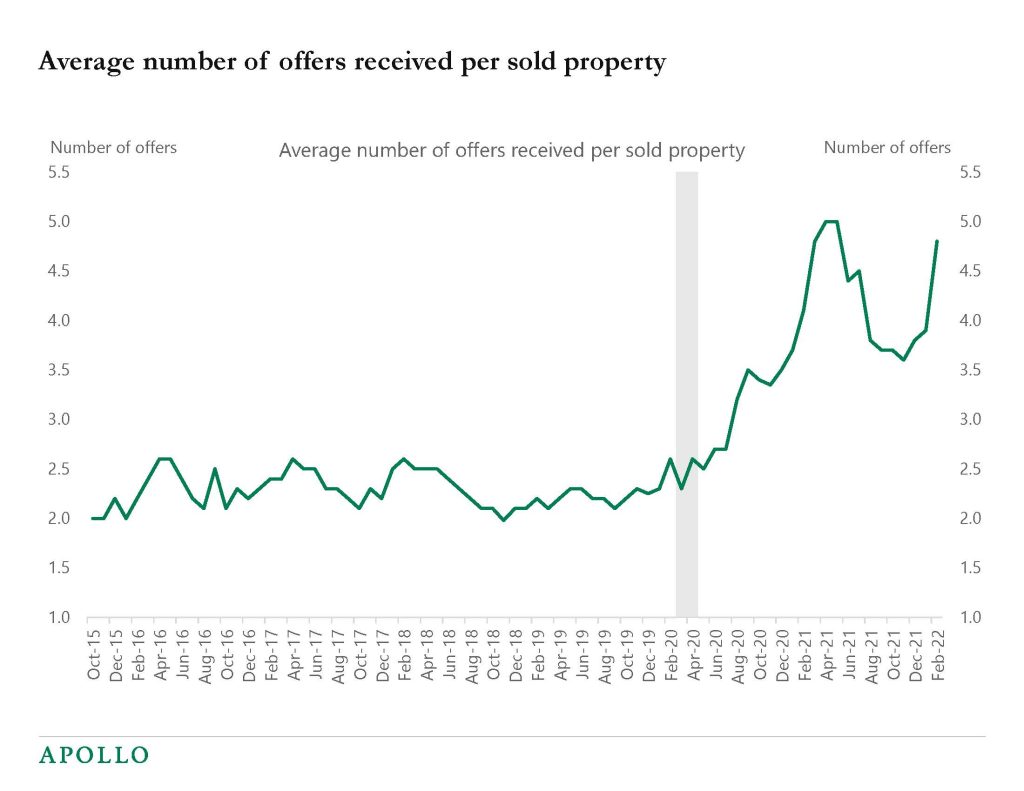
Source: NAR, Apollo Chief Economist 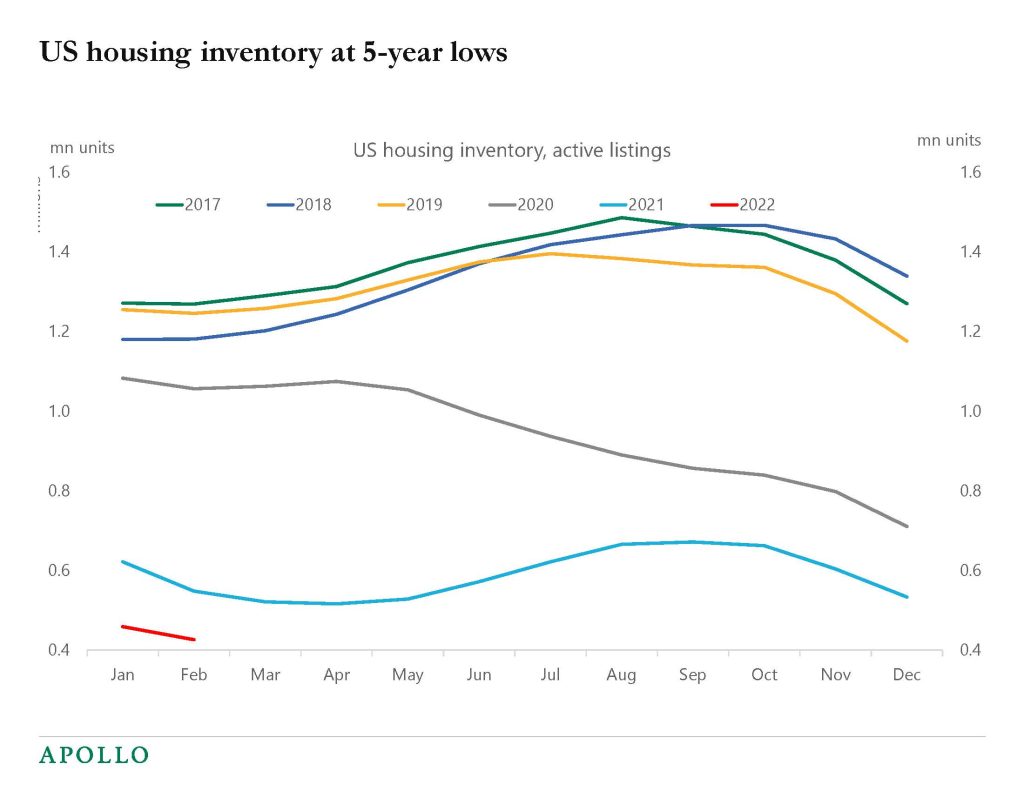
Source: Realtor.com, Apollo Chief Economist 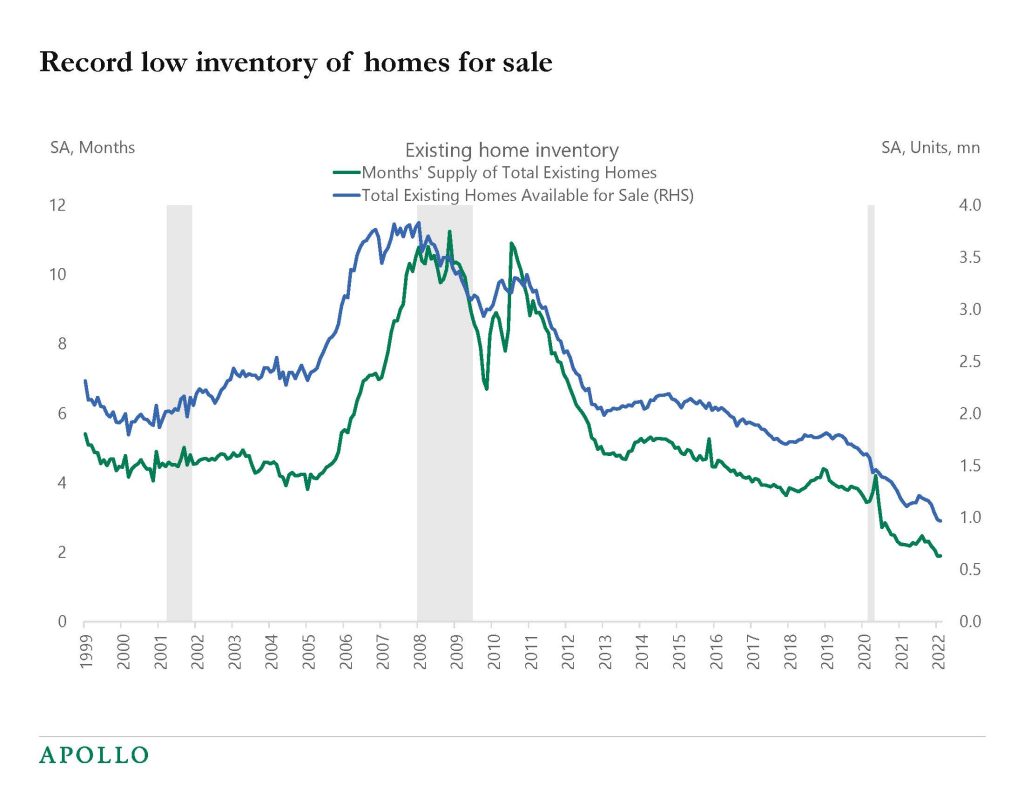
Source: NAR, Apollo Chief Economist 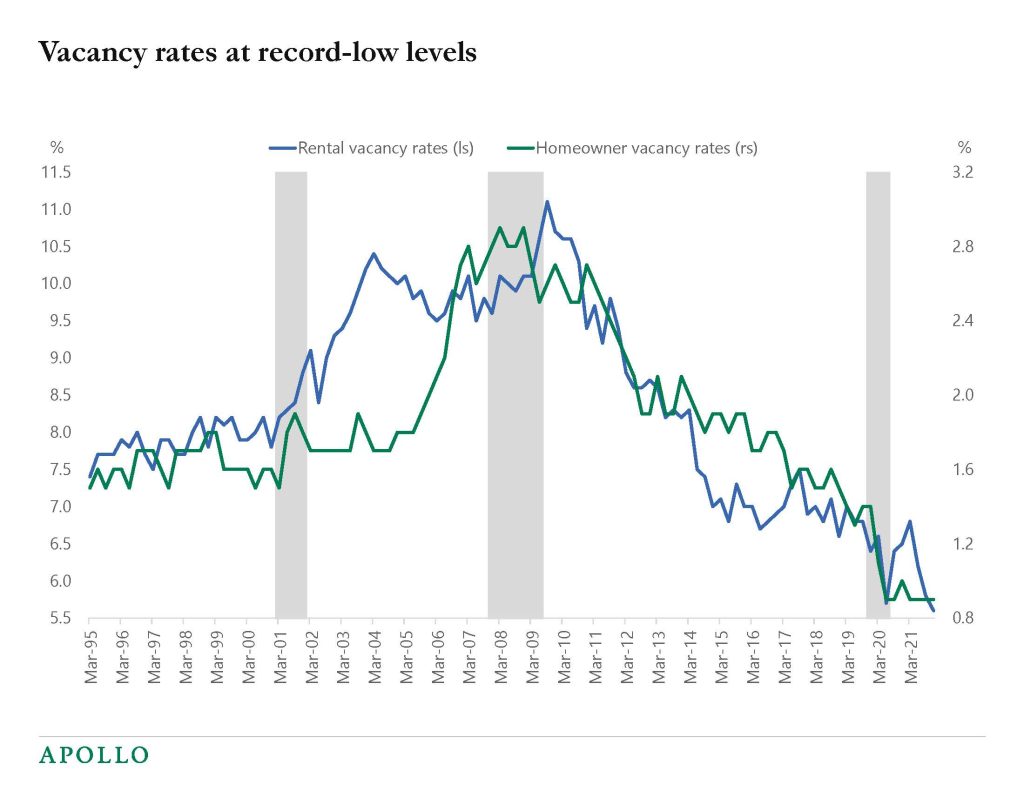
Source: Bloomberg, Apollo Chief Economist See important disclaimers at the bottom of the page.
-
The Fed is raising rates to cool down inflation, but daily indicators for consumer spending, airline travel, hotel reservations, and restaurant bookings show no signs of the economy slowing down, see charts below.
Combined with the strong March employment report, the conclusion is that despite higher rates and heightened geopolitical uncertainty, the incoming data is still strong and the Fed will continue to be hawkish until the economy starts to show signs of slowing down.
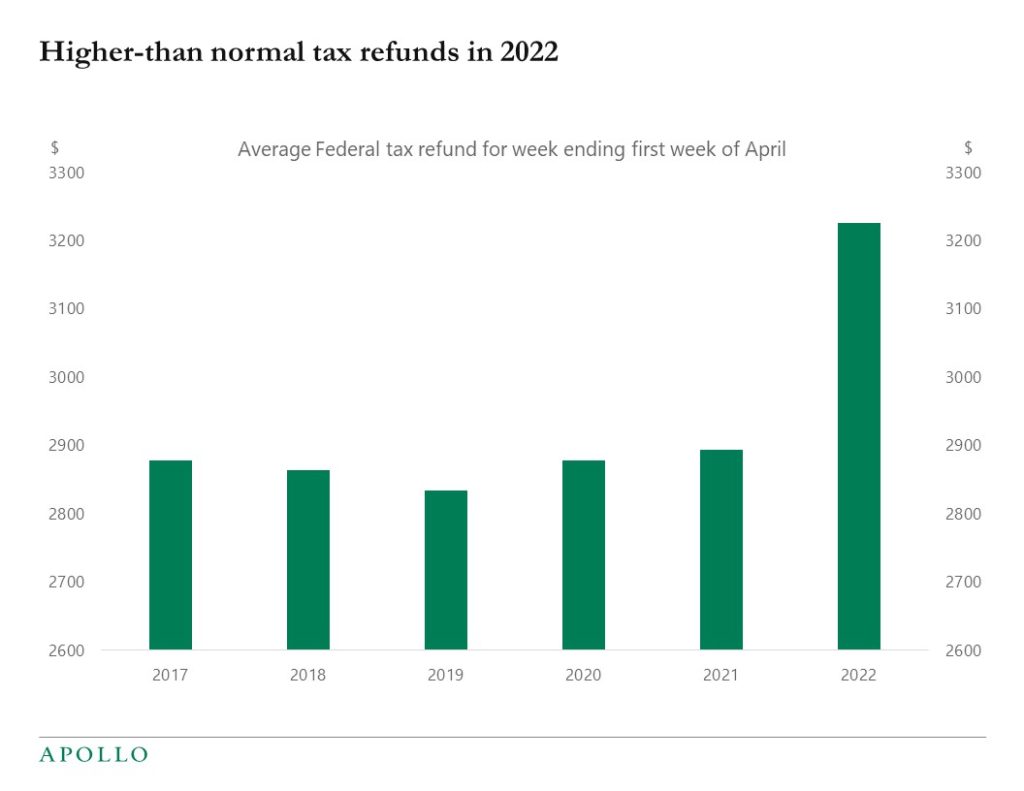
Source: IRS, Apollo Chief Economist 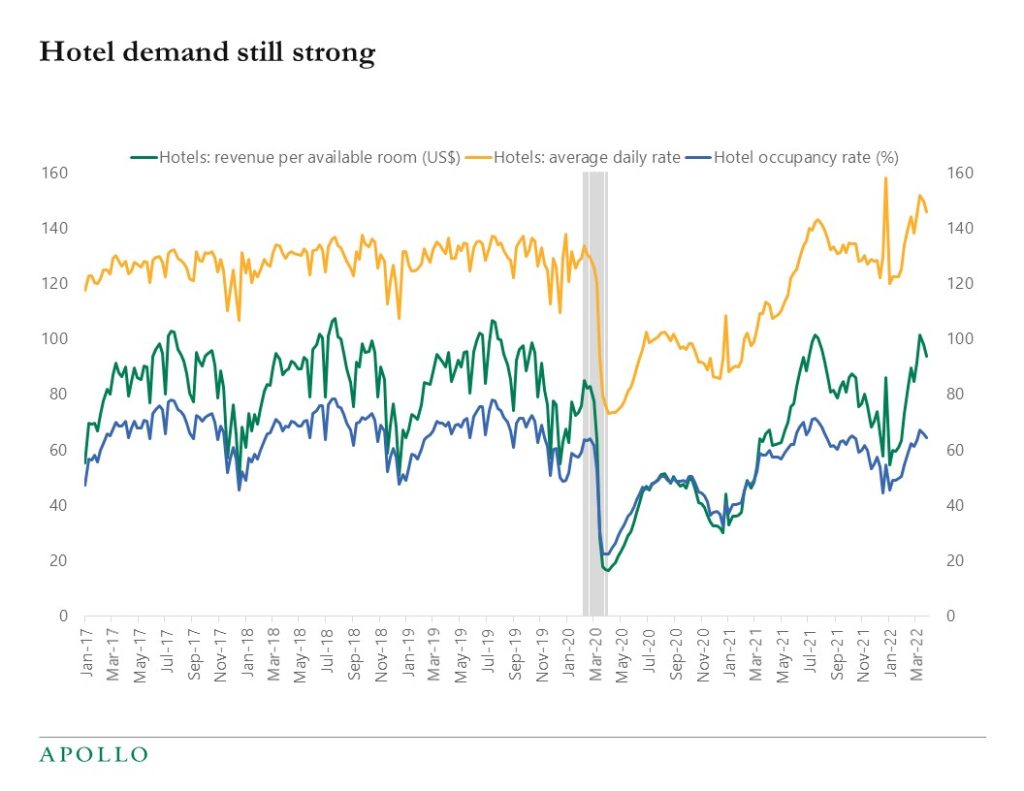
Source: STR, Haver Analytics, Apollo Chief Economist 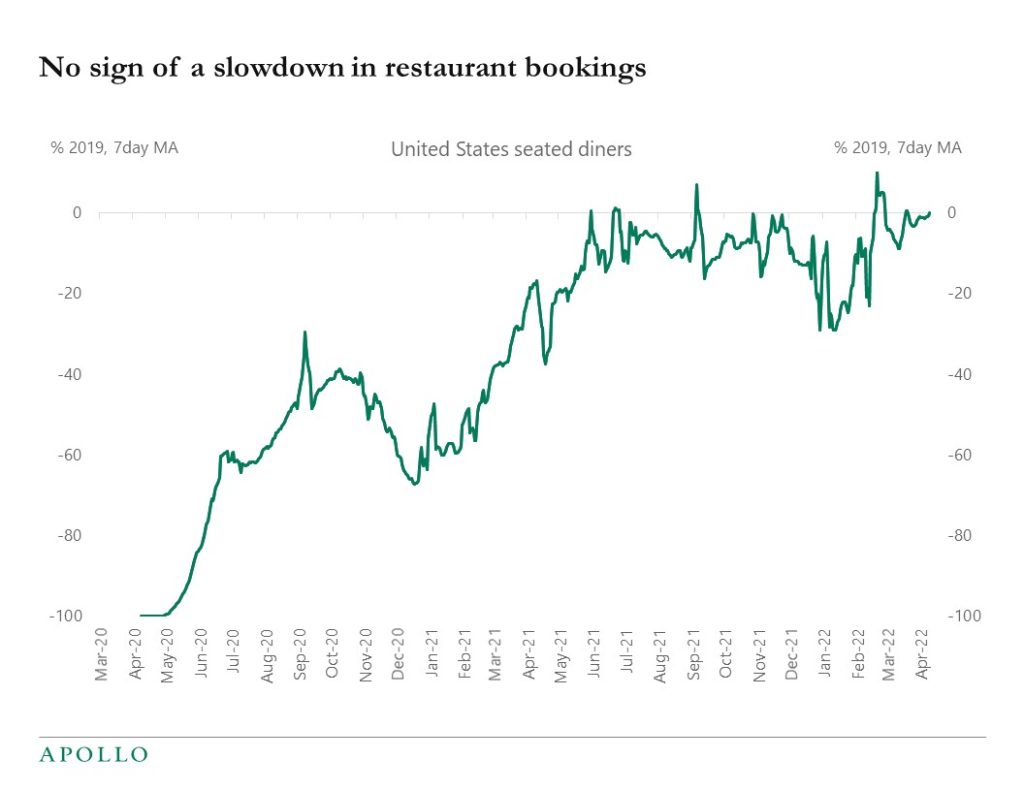
Source: OpenTable, Bloomberg, Apollo Chief Economist 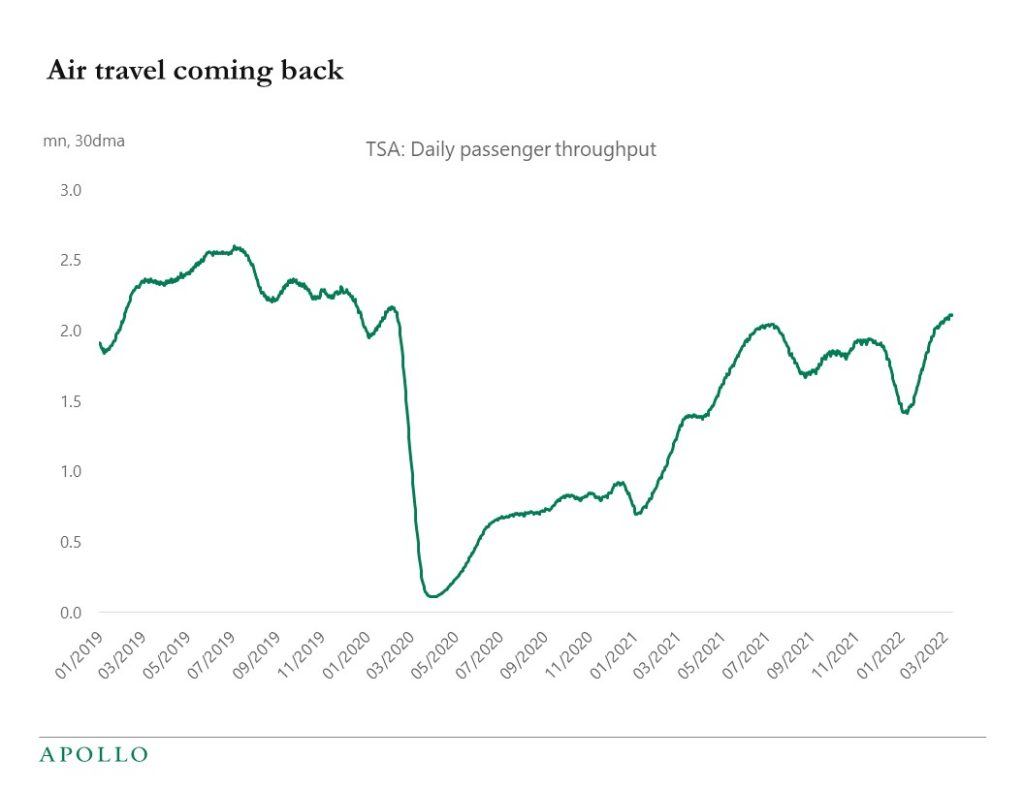
Source: TSA, Bloomberg, Apollo Chief Economist 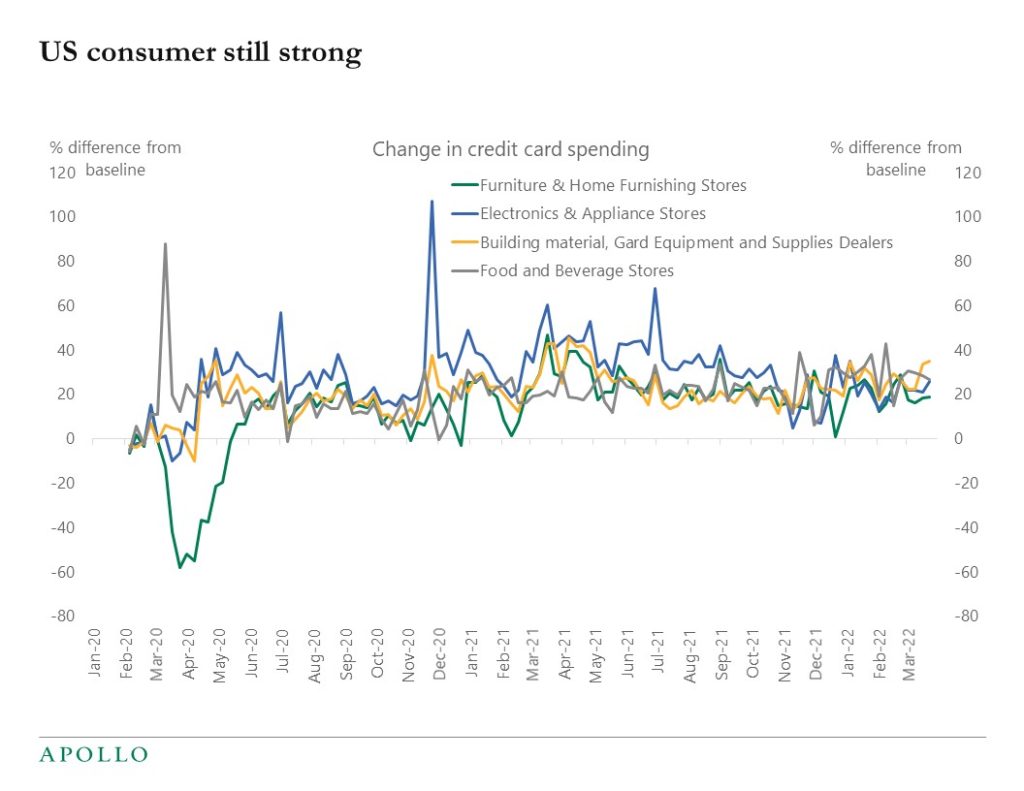
Source: BEA, Haver analytics, Apollo Chief Economist. Note: The weekly values represent the predicted percentage difference from the typical level of spending (prior to the pandemic declared by the World Health Organization on March 11, 2020) after adjusting for day-of-week, month, and year effects, based on daily data. The typical level corresponds to a value of zero. 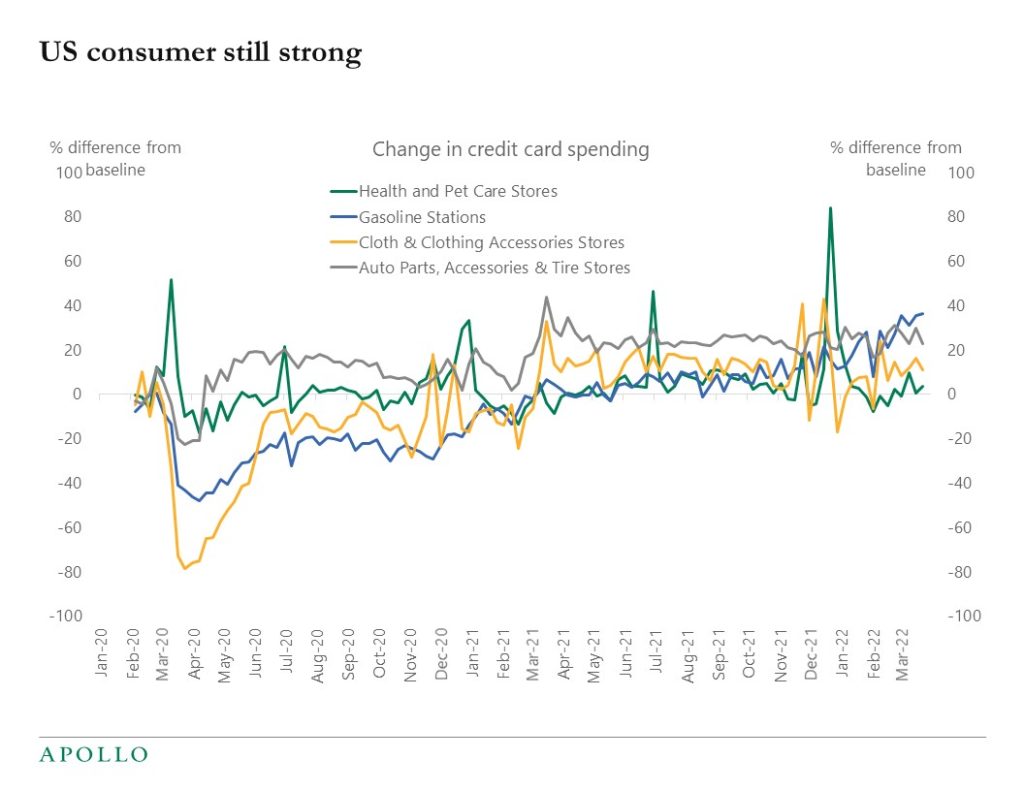
Source: BEA, Haver analytics, Apollo Chief Economist. Note: The weekly values represent the predicted percentage difference from the typical level of spending (prior to the pandemic declared by the World Health Organization on March 11, 2020) after adjusting for day-of-week, month, and year effects, based on daily data. The typical level corresponds to a value of zero. 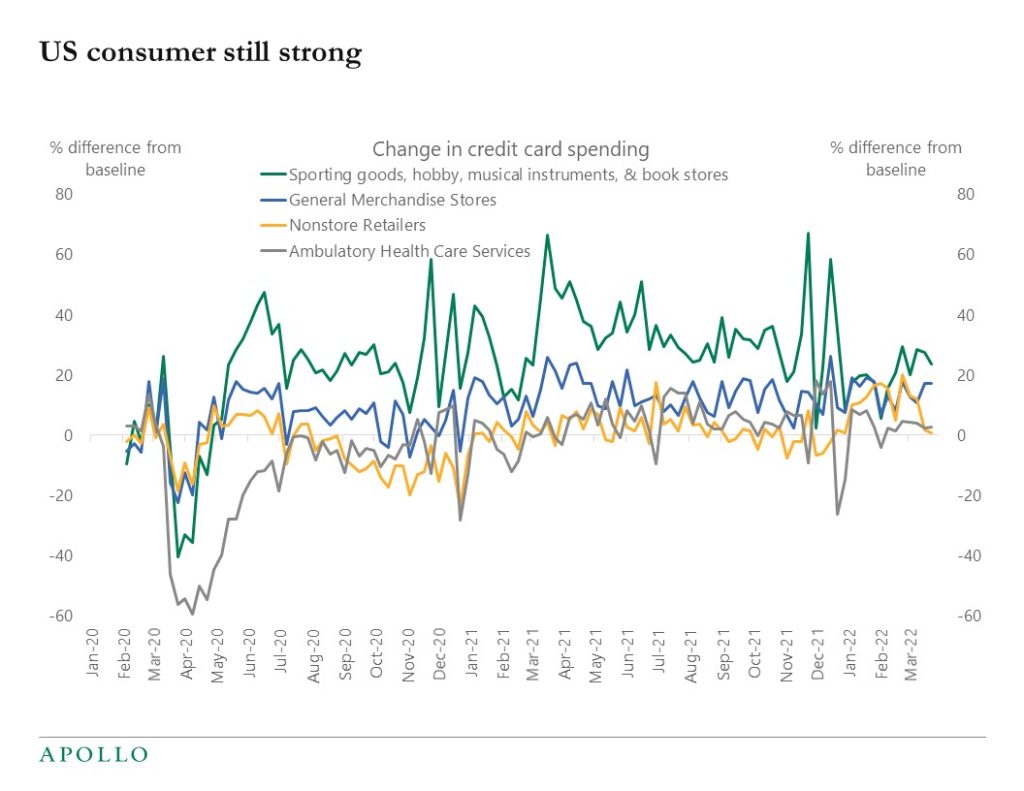
Source: BEA, Haver analytics, Apollo Chief Economist. Note: The weekly values represent the predicted percentage difference from the typical level of spending (prior to the pandemic declared by the World Health Organization on March 11, 2020) after adjusting for day-of-week, month, and year effects, based on daily data. The typical level corresponds to a value of zero. See important disclaimers at the bottom of the page.
This presentation may not be distributed, transmitted or otherwise communicated to others in whole or in part without the express consent of Apollo Global Management, Inc. (together with its subsidiaries, “Apollo”).
Apollo makes no representation or warranty, expressed or implied, with respect to the accuracy, reasonableness, or completeness of any of the statements made during this presentation, including, but not limited to, statements obtained from third parties. Opinions, estimates and projections constitute the current judgment of the speaker as of the date indicated. They do not necessarily reflect the views and opinions of Apollo and are subject to change at any time without notice. Apollo does not have any responsibility to update this presentation to account for such changes. There can be no assurance that any trends discussed during this presentation will continue.
Statements made throughout this presentation are not intended to provide, and should not be relied upon for, accounting, legal or tax advice and do not constitute an investment recommendation or investment advice. Investors should make an independent investigation of the information discussed during this presentation, including consulting their tax, legal, accounting or other advisors about such information. Apollo does not act for you and is not responsible for providing you with the protections afforded to its clients. This presentation does not constitute an offer to sell, or the solicitation of an offer to buy, any security, product or service, including interest in any investment product or fund or account managed or advised by Apollo.
Certain statements made throughout this presentation may be “forward-looking” in nature. Due to various risks and uncertainties, actual events or results may differ materially from those reflected or contemplated in such forward-looking information. As such, undue reliance should not be placed on such statements. Forward-looking statements may be identified by the use of terminology including, but not limited to, “may”, “will”, “should”, “expect”, “anticipate”, “target”, “project”, “estimate”, “intend”, “continue” or “believe” or the negatives thereof or other variations thereon or comparable terminology.


