Want it delivered daily to your inbox?
-
Sixty-seven percent of global manufacturing capacity for electric vehicles is in China.
Similarly, most manufacturing capacity for batteries, solar, and wind is also in China, see chart below.
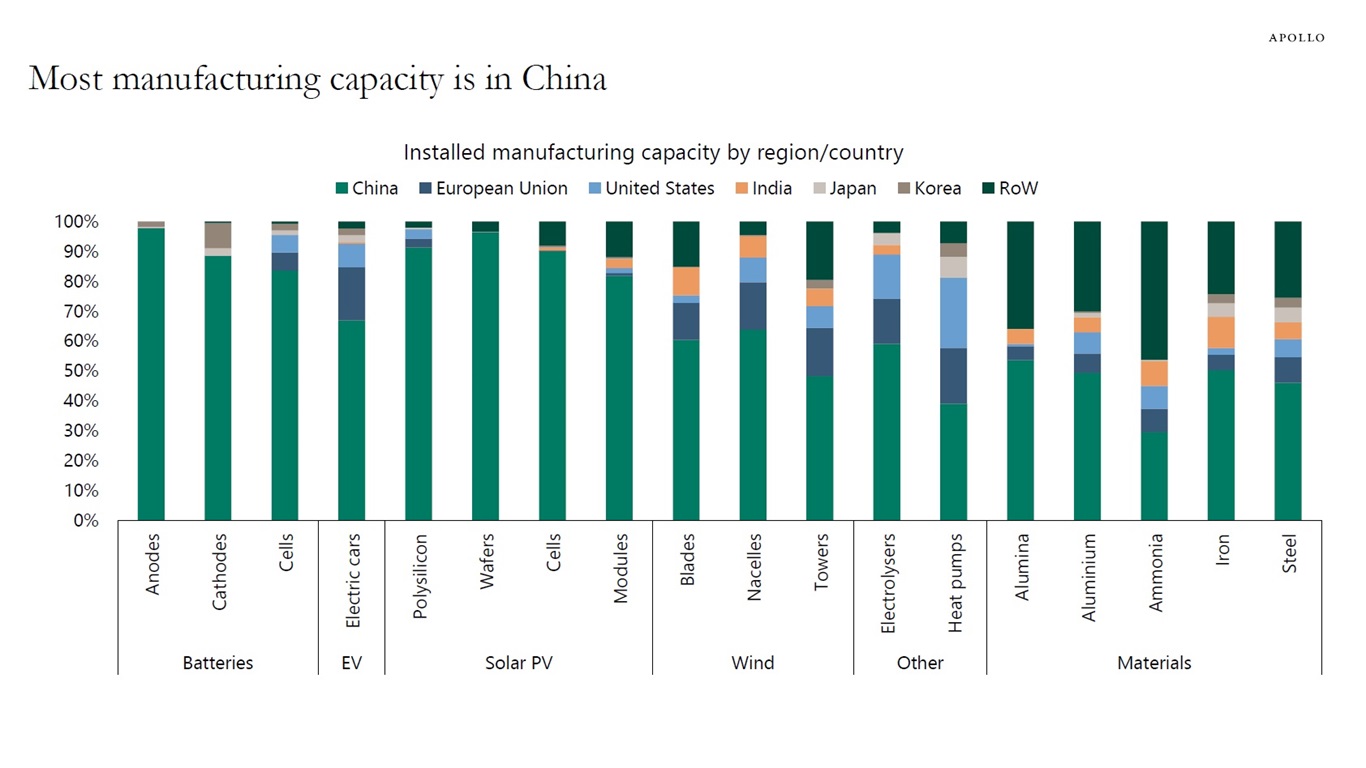
Note: Data for 2023. RoW = Rest of World. “Electric cars” values are calculated based on 2023 production numbers, adjusted according to the utilization rates of car assembly plants in the region. Source: IEA analysis based on IEA (2024a) and IEA (2023b), Apollo Chief Economist See important disclaimers at the bottom of the page.
-
Medicaid provides healthcare coverage to low-income families (generally making less than $25,000 a year), and roughly 20% of the US population, or about 72 million people, are covered by Medicaid.
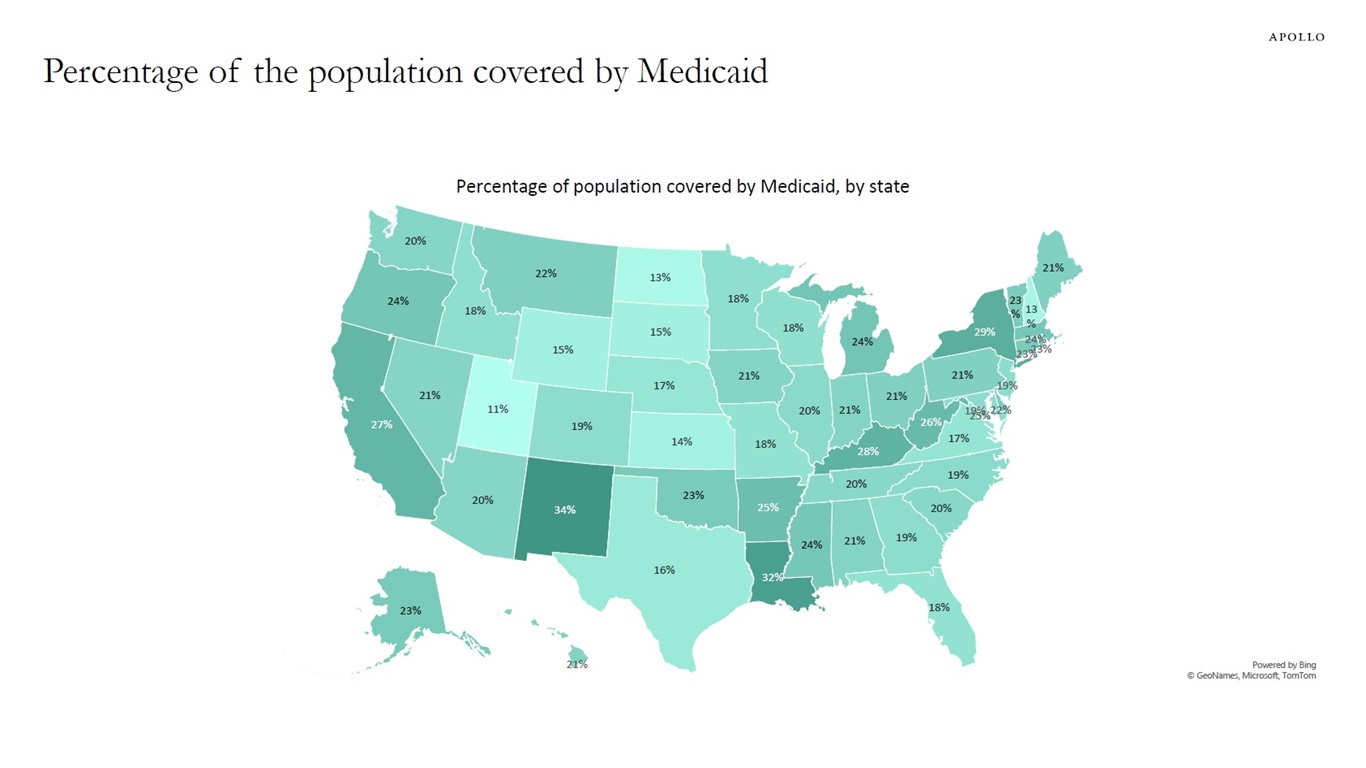
Note: Data for 2023. Source: KFF Health Insurance Coverage of the Total Population, Apollo Chief Economist See important disclaimers at the bottom of the page.
-
The US dollar is the global reserve currency because America is the most dynamic economy in the world, and the US provides stability and security. As a result, there is upward pressure on the US dollar because everyone wants to own the world’s safest asset.
This safe-haven upward pressure on the dollar overwhelms the negative impact on the dollar coming from the US current account deficit.
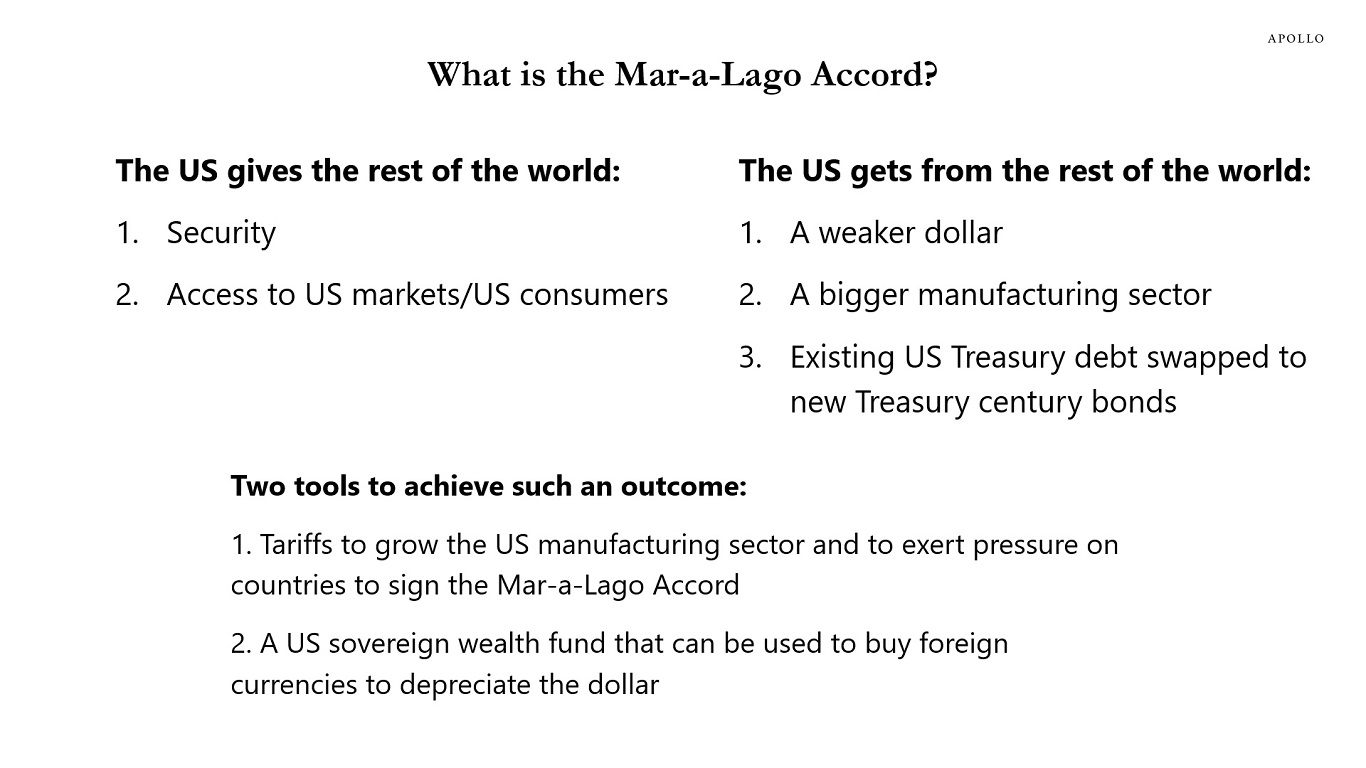
With safe asset flows putting constant upward pressure on the dollar, there is a need for a deal—a Mar-a-Lago Accord—to put downward pressure on the US dollar to increase US exports and bring manufacturing jobs back to the US.
The Mar-a-Largo Accord is the idea that the US will give the G7, the Middle East, and Latin America security and access to US markets, and in return, these countries agree to intervene to depreciate the US dollar, grow the size of the US manufacturing sector, and solve the US fiscal debt problems by swapping existing US government debt with new US Treasury century bonds.
In short, the idea is that the US provides the world with security, and in return, the rest of the world helps push the dollar down in order to grow the US manufacturing sector.
There are two instruments for the US to achieve this goal. The first tool is tariffs, which also have the benefit that tariffs raise the tax revenue for the US government. The second tool is a sovereign wealth fund to likely accumulate foreign currencies such as EUR, JPY, and RMB to intervene in FX markets to help put additional downward pressure on the US dollar.
For markets, this raises three questions:
1) The changes that are required to existing US manufacturing production, including eliminating Canada and Mexico from all auto supply chains, will take many years. Can the US achieve the long-term gain without too much short-term pain?
2) Globalization has for decades put downward pressure on US inflation. Will a more segmented global economy with a much bigger manufacturing sector in the US put too much upward pressure on US inflation, given the higher wage costs in the US than in many other countries?
3) With tariffs being implemented, the rest of the world may over time begin to decrease its reliance on US markets and also increase their own defense spending. Under such a scenario, what are the incentives for the rest of the world to sign a Mar-a-Lago Accord?
Source: Apollo Chief Economist See important disclaimers at the bottom of the page.
-
There are adjustment costs associated with changing trade policy and changing the size of the government sector, see chart below. The immediate question for markets is how big the short-term pain will be, see chart below.
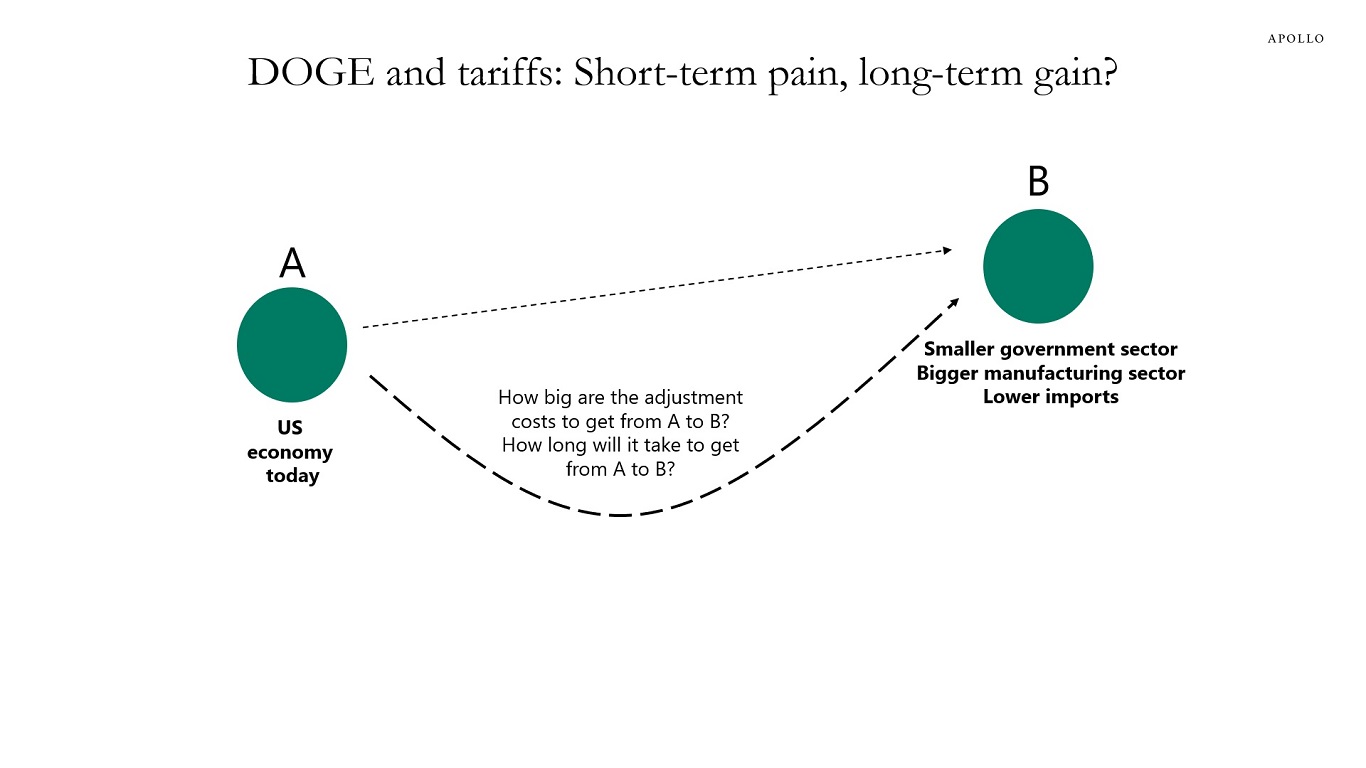
Source: Apollo Chief Economist See important disclaimers at the bottom of the page.
-
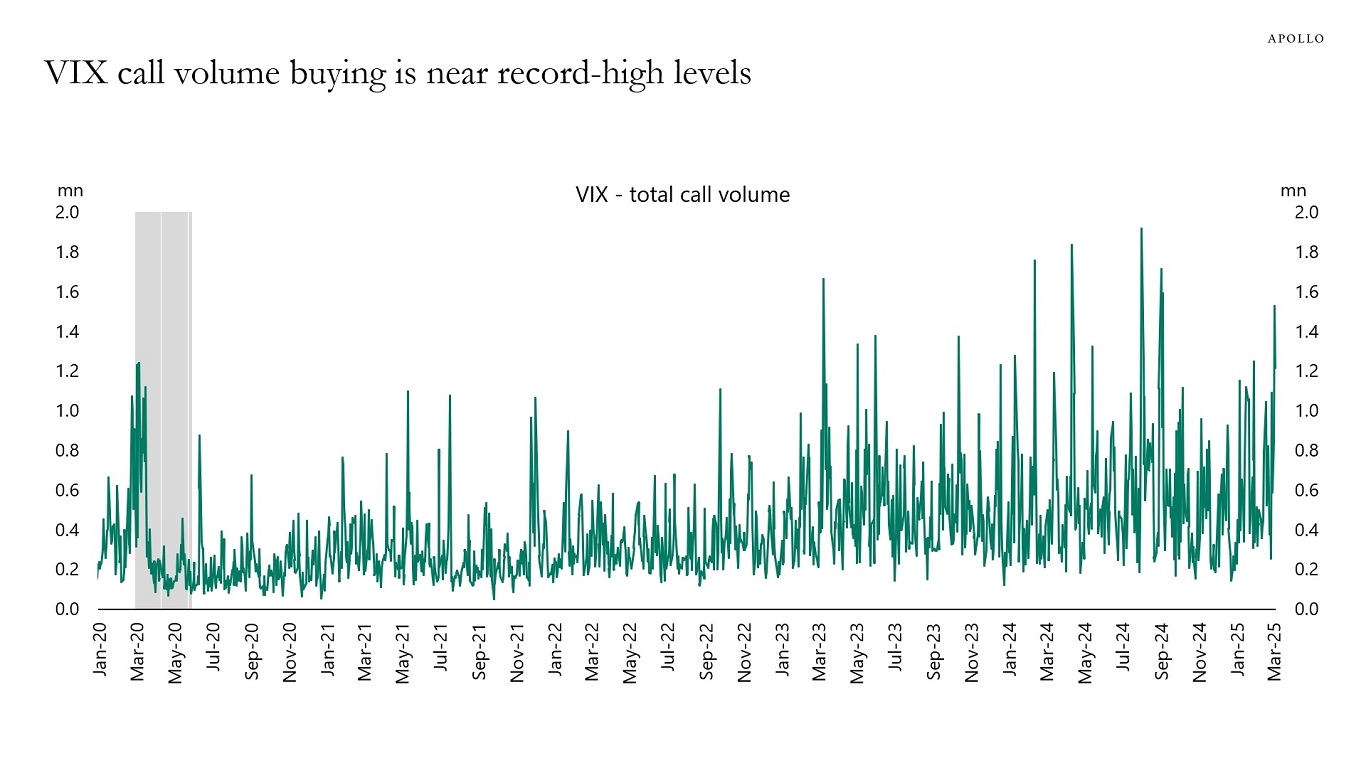
Investors are getting very worried about the downside risks to their portfolios. VIX call volume buying is near record-high levels, and S&P 500 put volume buying is near record-high levels, see charts below.
Source: Bloomberg, Apollo Chief Economist 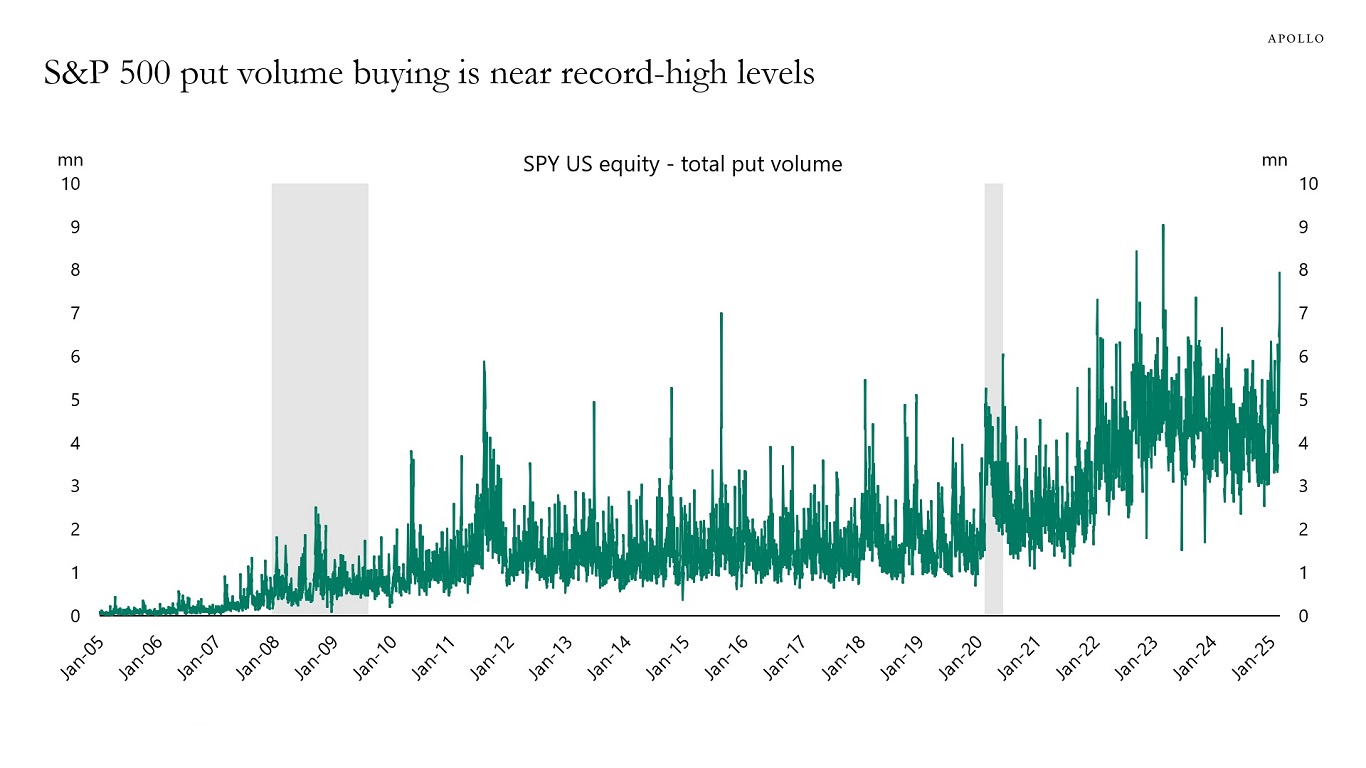
Source: Bloomberg, Apollo Chief Economist See important disclaimers at the bottom of the page.
-
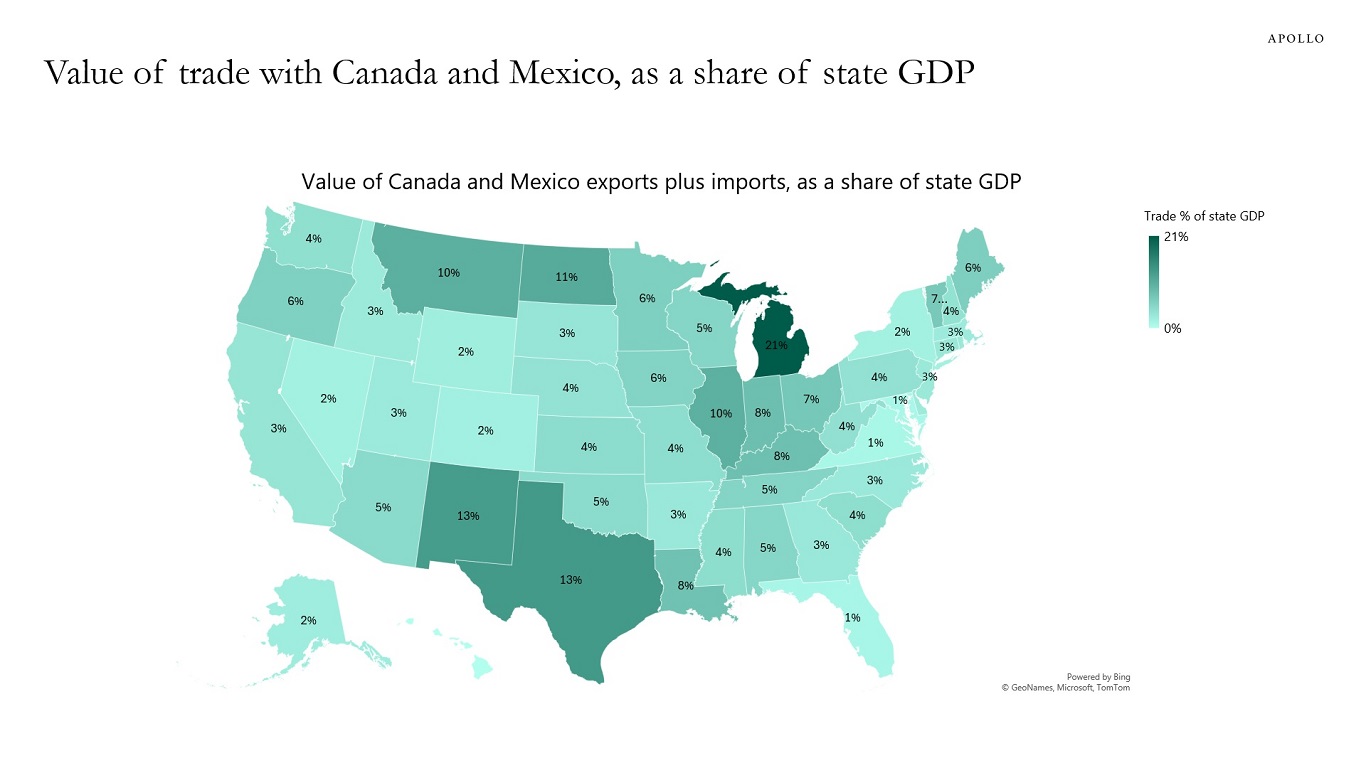
The chart below shows Canada and Mexico imports plus exports as a share of state GDP, and the states that are most impacted by the trade war with Canada and Mexico are Michigan, Texas, New Mexico, North Dakota, Montana, Illinois, Kentucky, Indiana, Louisiana, and Ohio.
Note: Data for 2024. Source: International Trade Administration, BEA, Apollo Chief Economist See important disclaimers at the bottom of the page.
-
There are adjustment costs associated with changing trade policy and changing the size of the government sector, and the immediate question for markets is how big the short-term pain will be.
- The impact on markets and the economy depends entirely on how long the 25% tariffs on Canada and Mexico are in place. If they are removed tomorrow or later this week, then the impact on the economy will be small. If they continue for months, then the negative impact will be more significant, especially to the auto sector.
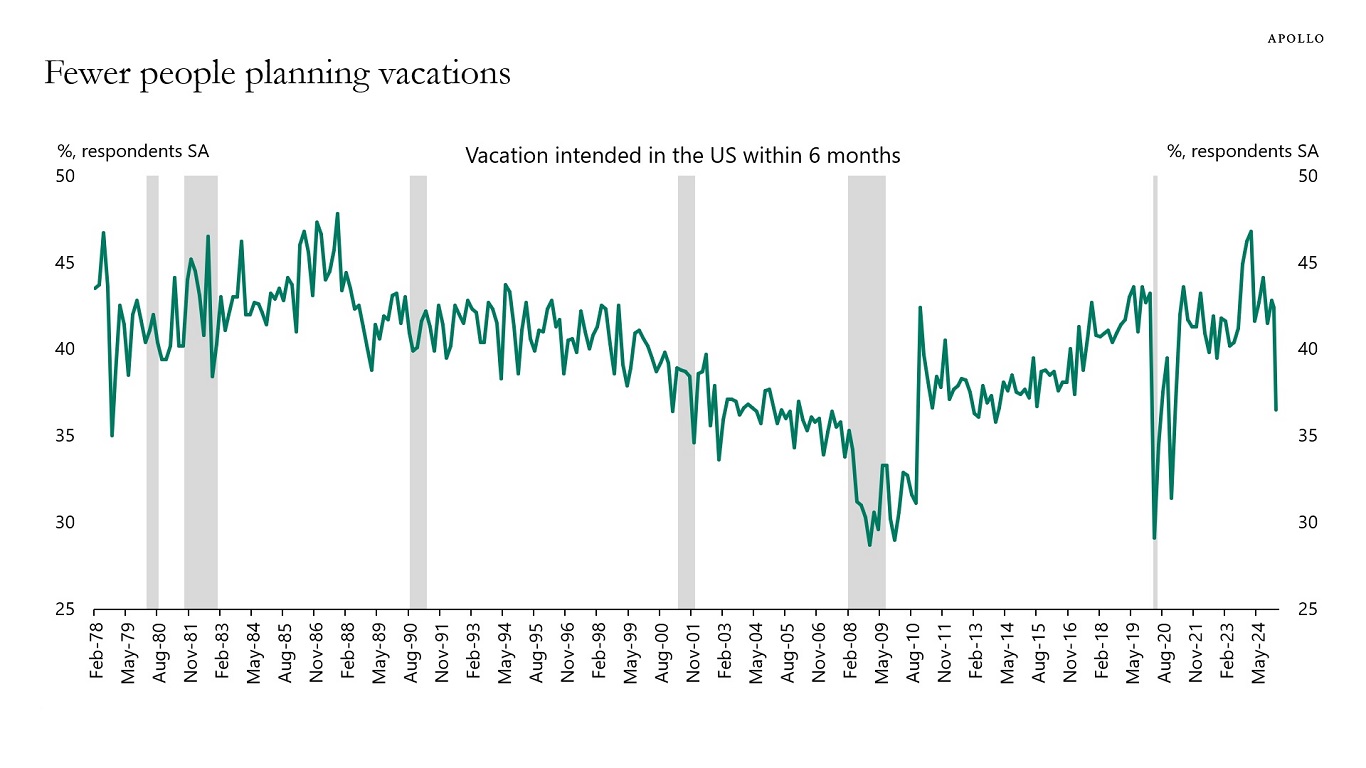
- The bigger risk to markets is sentiment. We are already seeing consumer sentiment and corporate sentiment being impacted, see charts below. If policy uncertainty persists, consumers and firms may begin to hold back spending decisions. Combined with DOGE-driven layoffs, this will put upward pressure on the unemployment rate.
- From a Fed perspective, the biggest problem is that tariffs increase prices and hence inflation. That is why a trade war, by definition, is a stagflation shock: Higher prices and lower sales. If tariffs on Canada and Mexico continue for several months, then the Fed will focus on the rising unemployment rate and start cutting rates soon.
The biggest downside risk is that policy uncertainty could create a sudden stop in the economy where consumers stop buying cars, stop going to restaurants, and stop going on vacation, and companies stop hiring and stop doing capex. The employment report on Friday will be stale. The key indicator to watch over the coming weeks is jobless claims, which come out every Thursday at 8:30 am ET.
Source: Conference Board, Bloomberg, Apollo Chief Economist 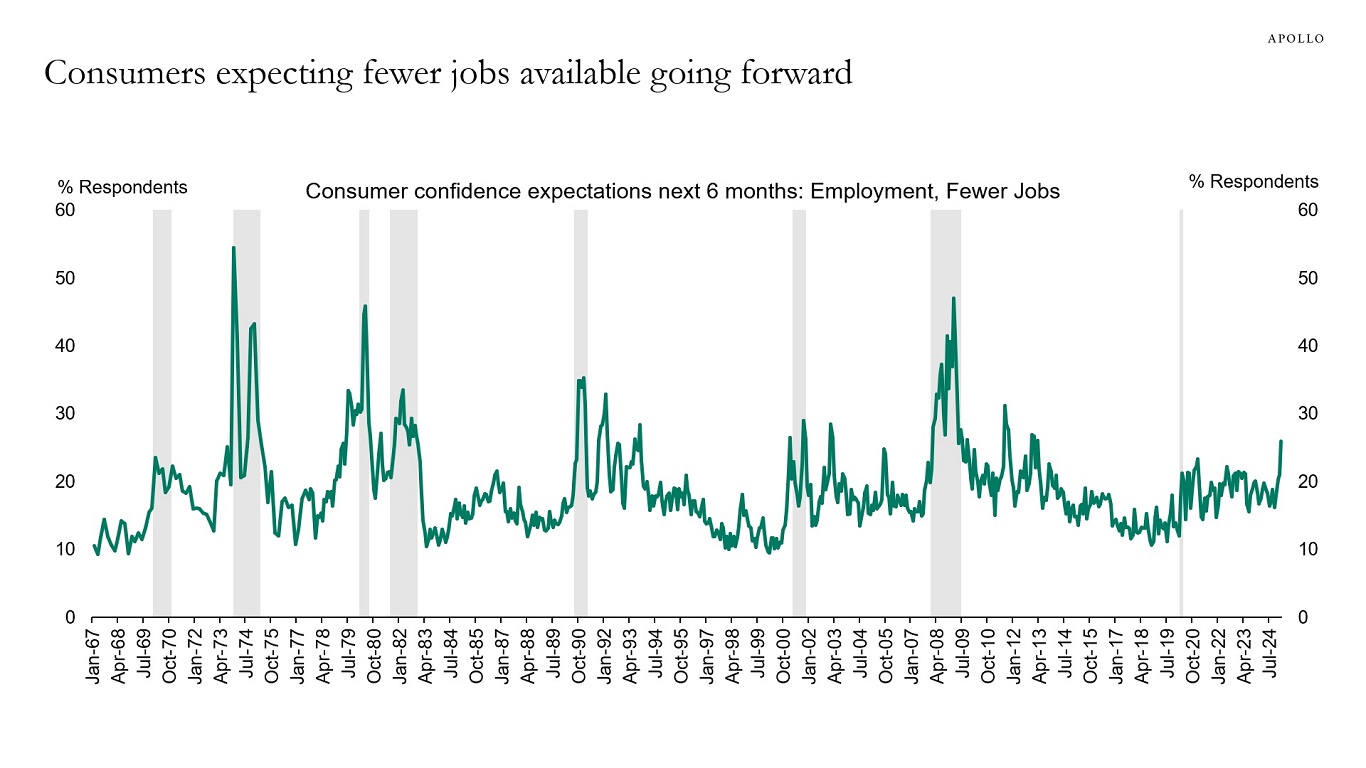
Source: Conference Board, Haver Analytics, Apollo Chief Economist 
Source: Business Roundtable; NFIB; Federal Reserve Bank of Philadelphia, Dallas, New York, Kansas and Richmond; Apollo Chief Economist See important disclaimers at the bottom of the page.
-
About 25% of jobs added in the US economy over the past two years were government jobs, up from 5% in 2021 and 7% in 2022, see chart below.
We are hosting a conference call today at 10 am EST to discuss the potential implications of the latest US administration policy proposals, you can register here, and the chart book we will be using is available here.
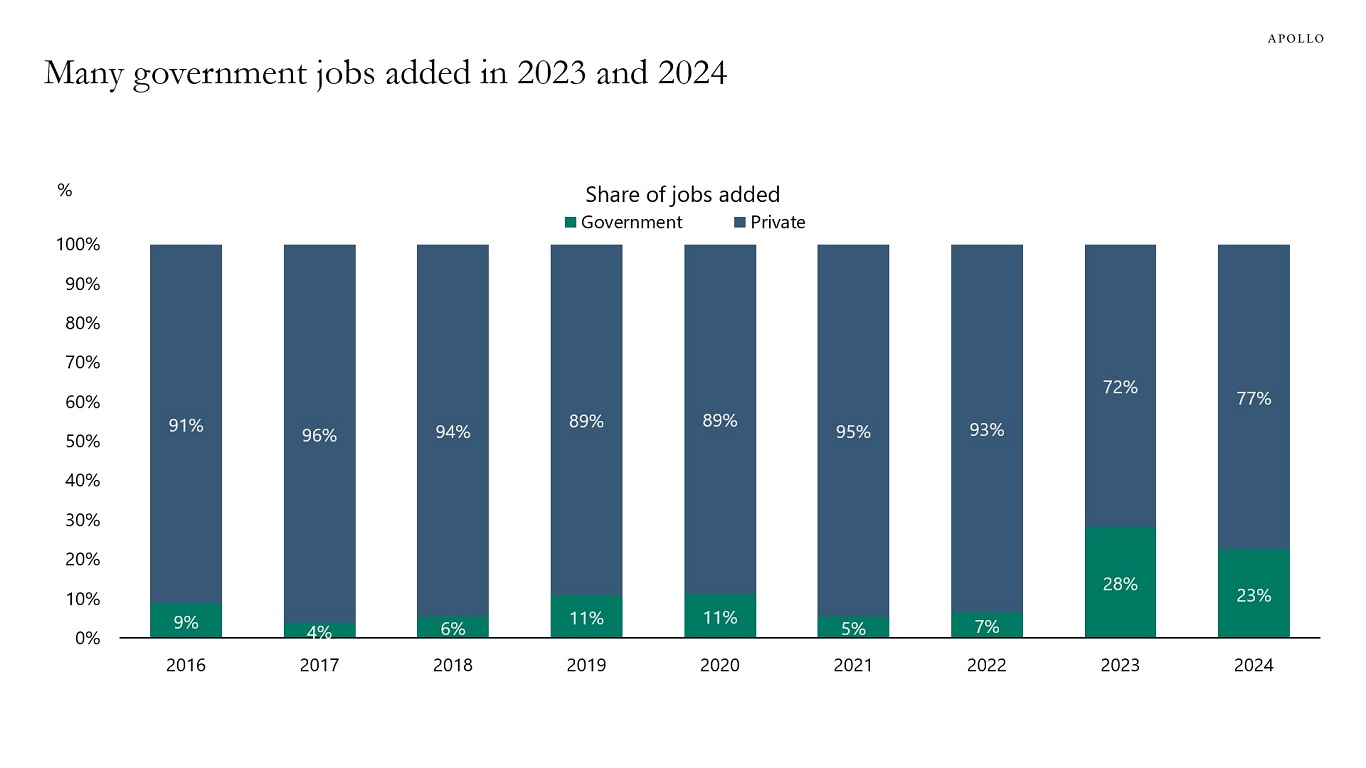
Source: BLS, Haver Analytics, Apollo Chief Economist See important disclaimers at the bottom of the page.
-
About half of the US population does not own any retirement assets, see chart below.
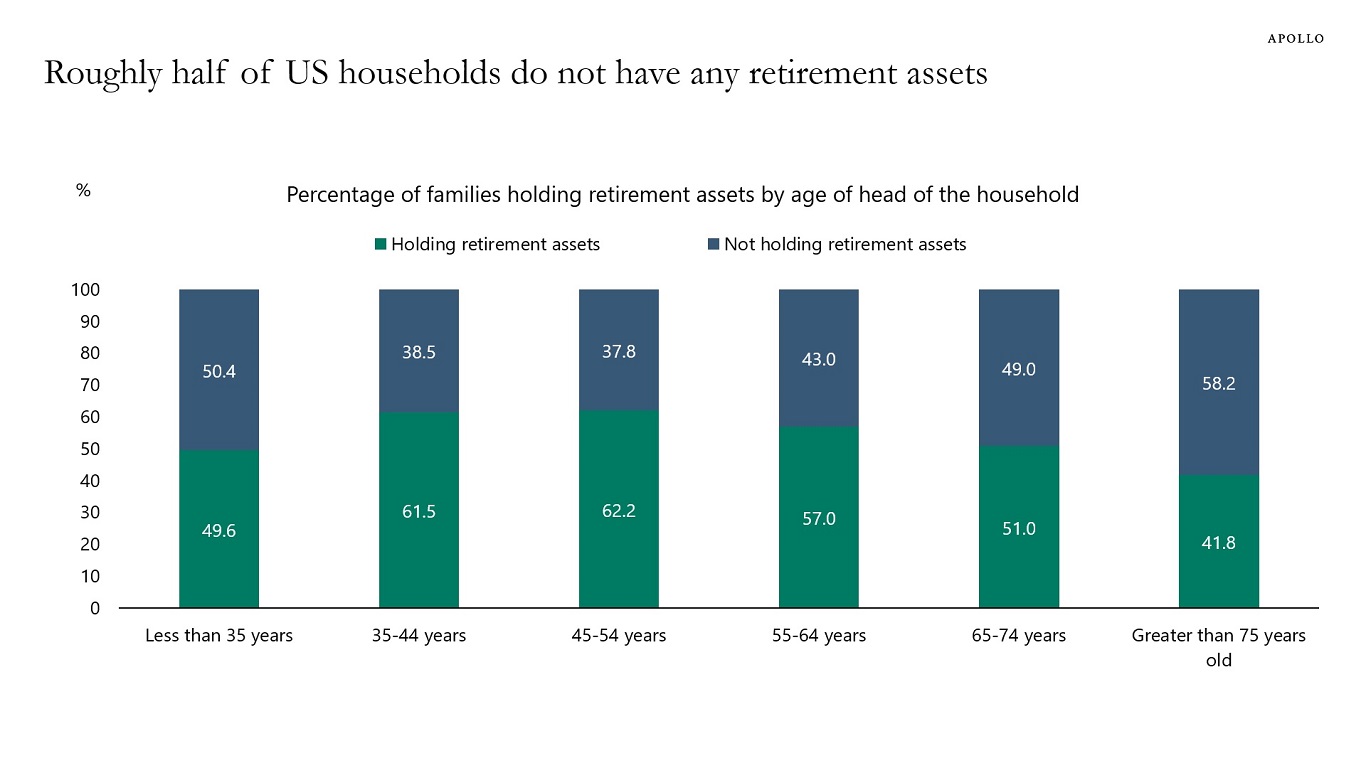
Source: Survey of Consumer Finances 2022, Haver Analytics, Apollo Chief Economist See important disclaimers at the bottom of the page.
-
Since the Fed began to raise interest rates in March 2022, housing starts have declined significantly, in particular, multifamily housing starts for rent have declined almost 50%, see the first chart.
Given it currently takes on average 17 months to build a multifamily property, see the second chart, we can produce a forecast for the number of multifamily homes coming to the market this year and next year. The conclusion is that multifamily completions will decline significantly in 2025 and 2026, see the third chart.
Combined with a historically low rental vacancy rate, solid household formation, and an all-time high share of Americans saying that they would rent if they had to move, the bottom line is that rent inflation will start to rise later this year, see the fourth, fifth, and sixth chart below.
Rising rents put upward pressure on OER in the CPI index and will keep inflation higher for longer. With inflation higher for longer, the Fed will also keep interest rates higher for longer.
The bottom line is that inflation remains well above the Fed’s 2% inflation target, and it will require interest rates higher for longer to get inflation back to 2%.
Our latest US housing outlook is available here.
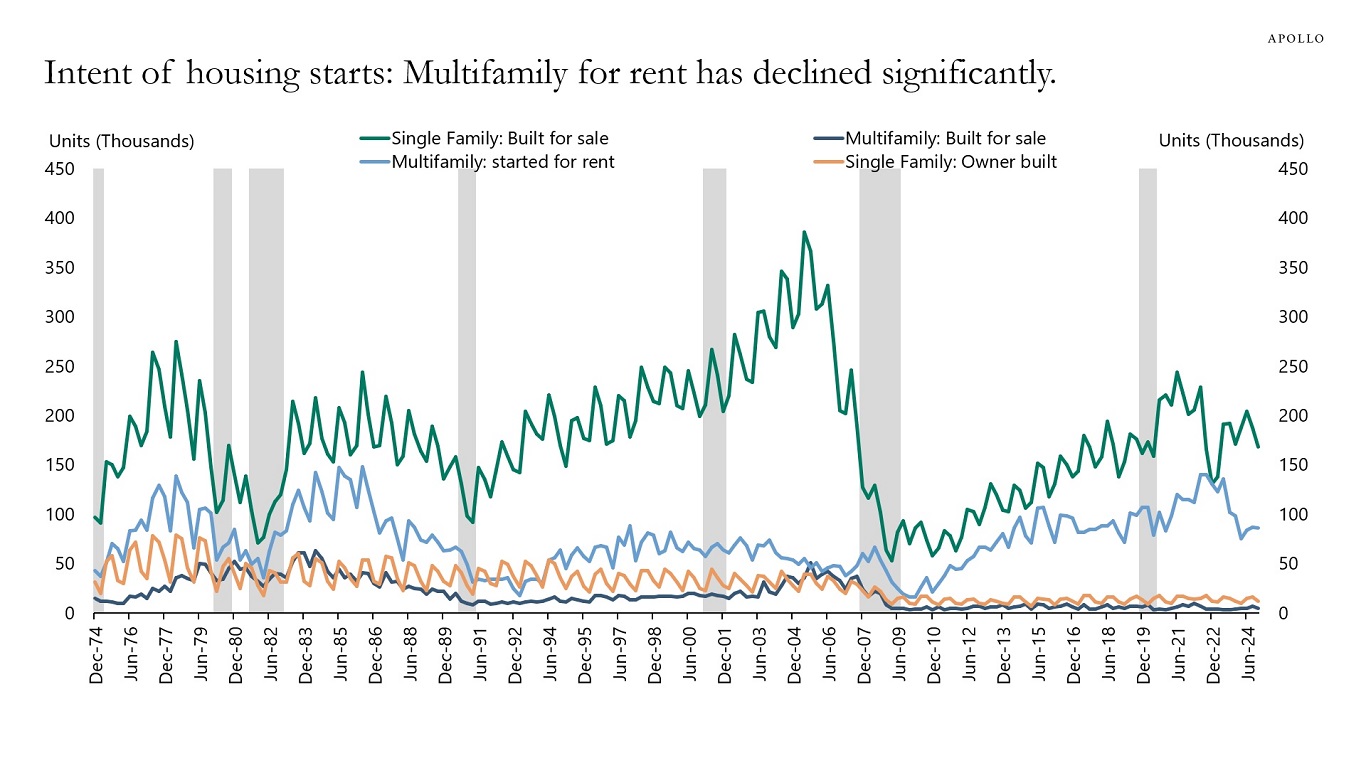
Source: US Census Bureau, Apollo Chief Economist 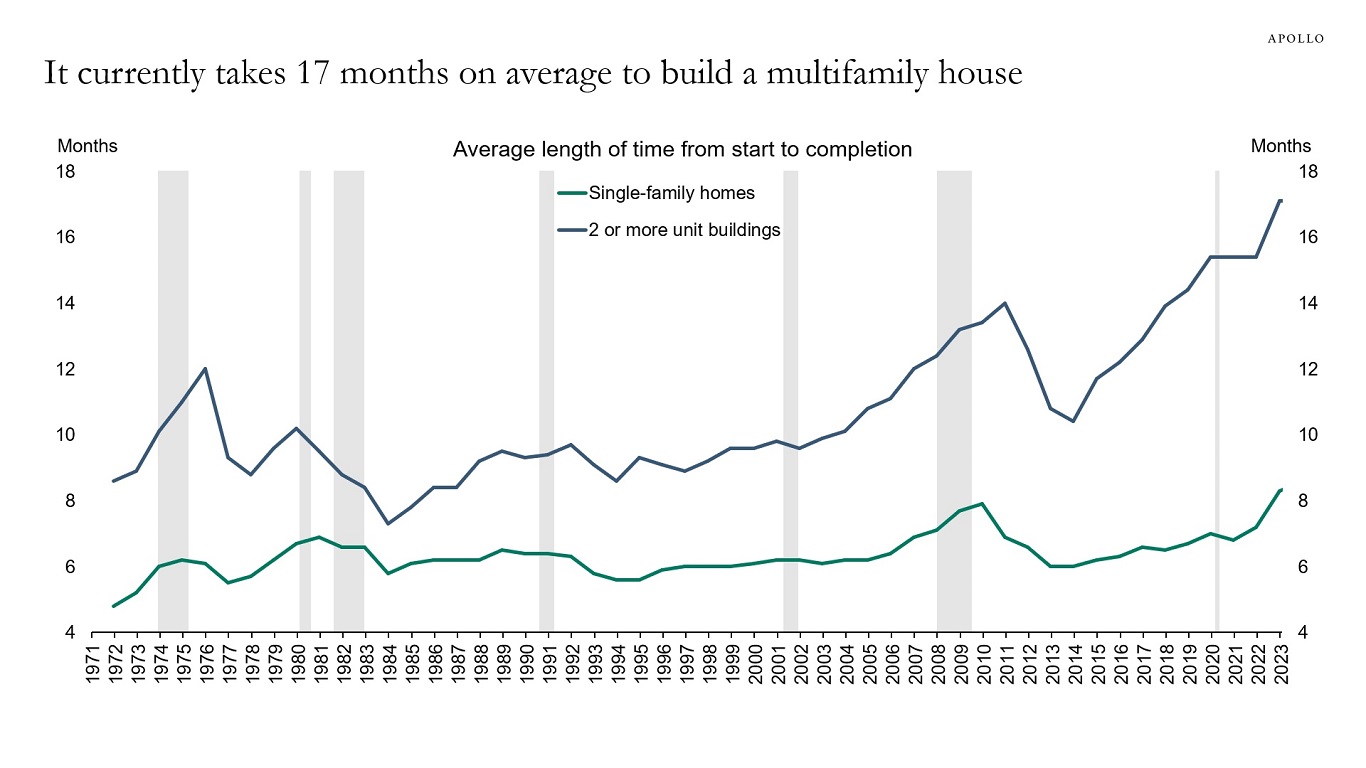
Note: Single-family homes are 1-unit buildings. Source: Census, Haver Analytics, Apollo Chief Economist 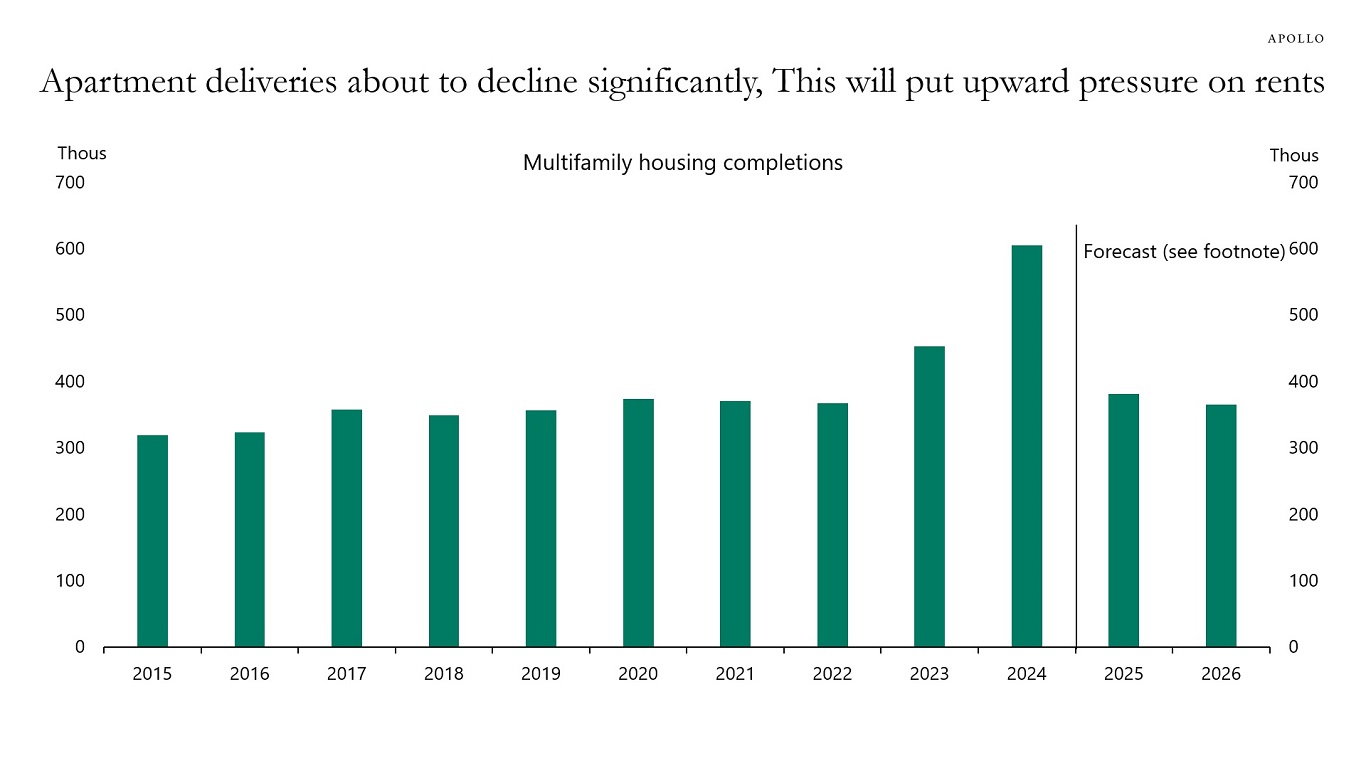
Note: 2025 and 2026 forecasts using data for housing starts and average length of time from start to completion. As housing starts have normalized, completed apartments are also normalizing to pre-pandemic levels. Source: Census Bureau, Haver Analytics, Apollo Chief Economist 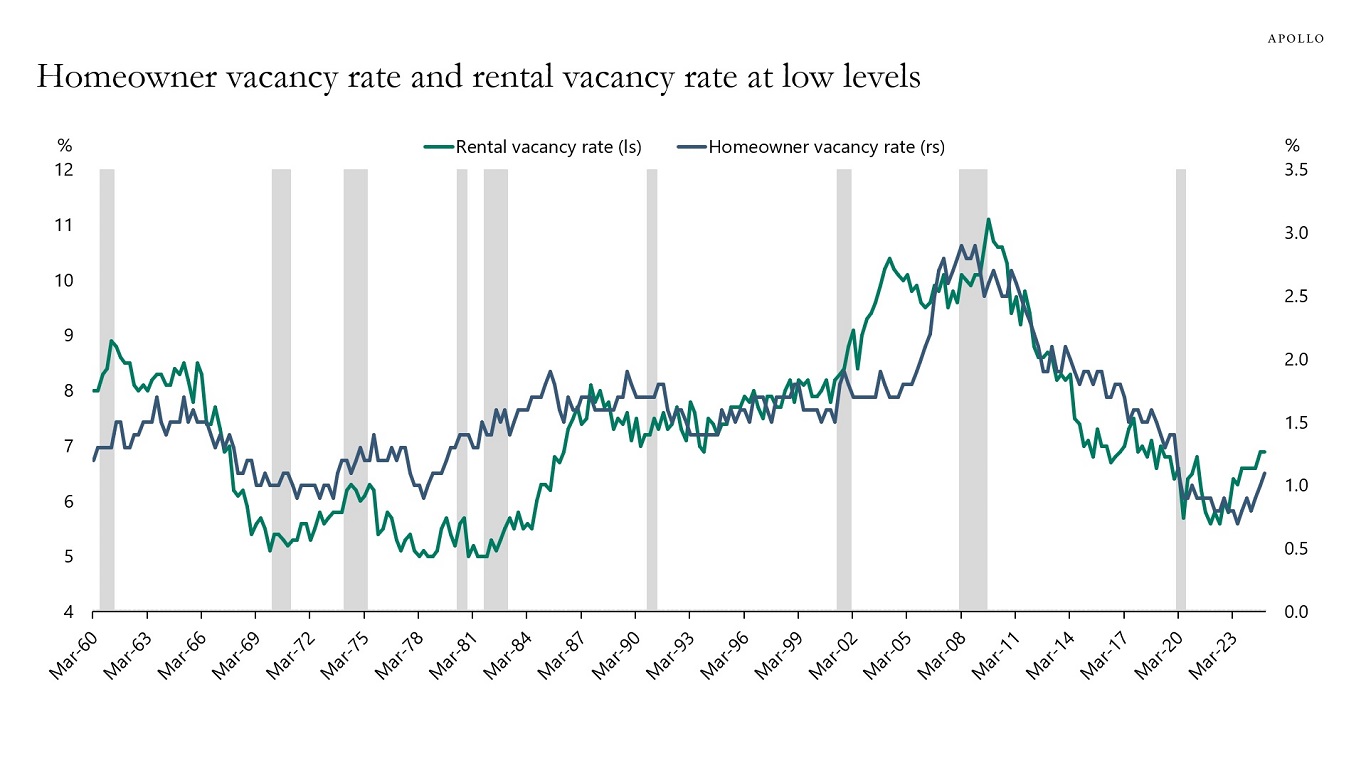
Source: Census Bureau, Haver, Apollo Chief Economist 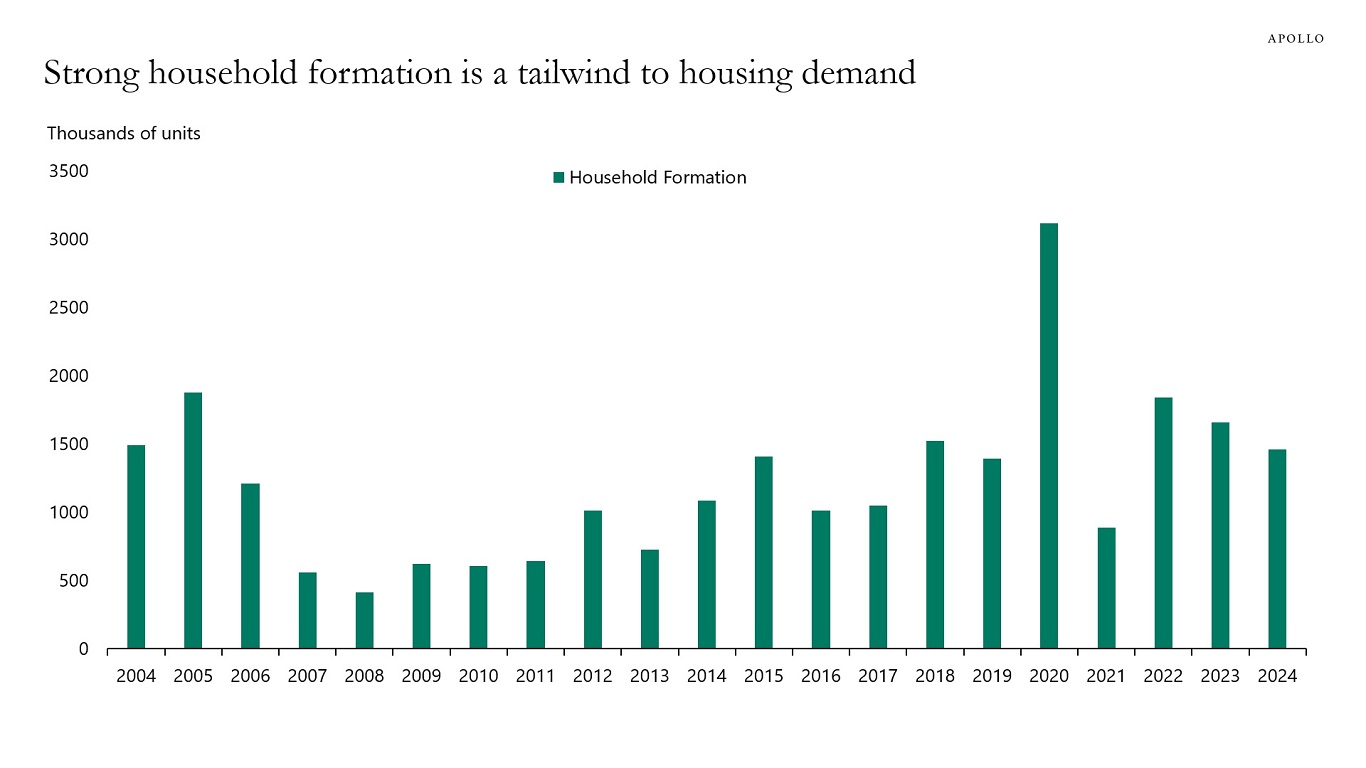
Source: Census Bureau, Haver, Apollo Chief Economist 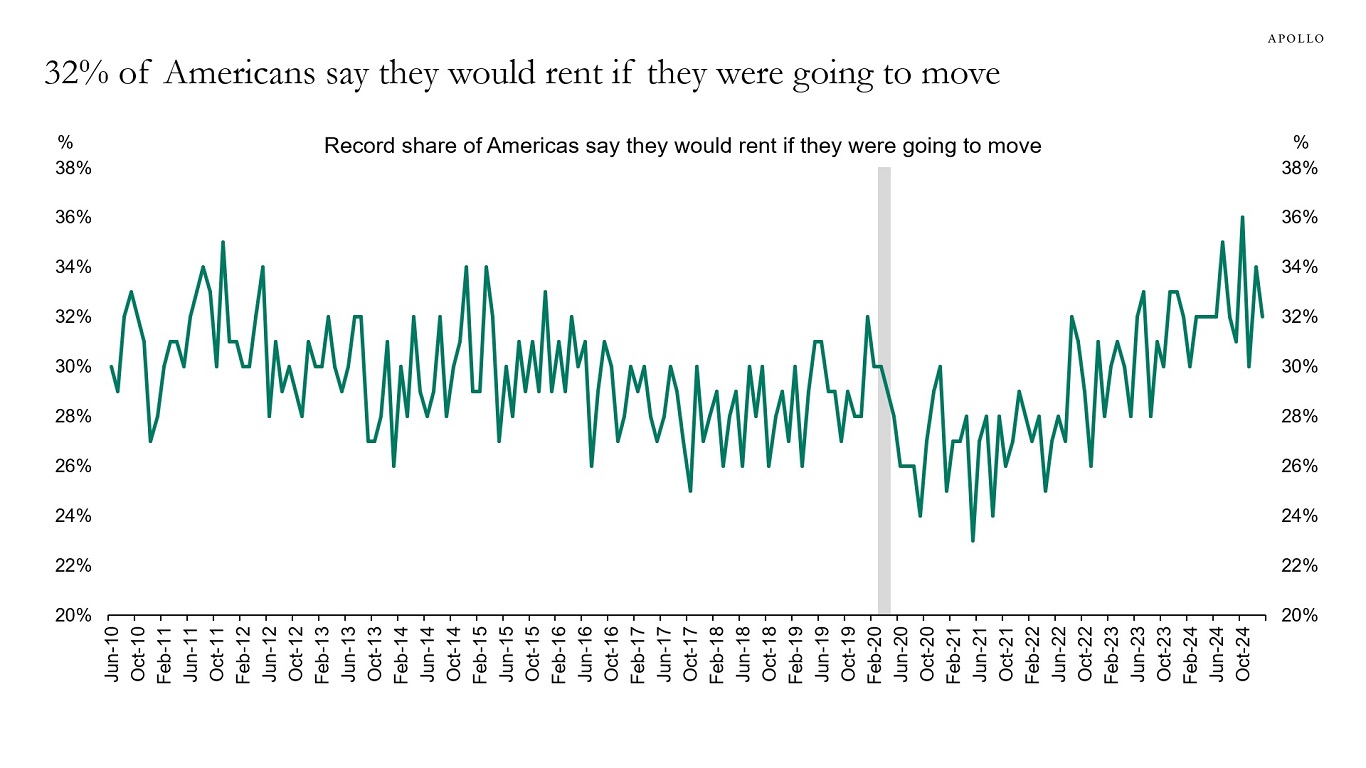
Source: Fannie Mae, Apollo Chief Economist See important disclaimers at the bottom of the page.
This presentation may not be distributed, transmitted or otherwise communicated to others in whole or in part without the express consent of Apollo Global Management, Inc. (together with its subsidiaries, “Apollo”).
Apollo makes no representation or warranty, expressed or implied, with respect to the accuracy, reasonableness, or completeness of any of the statements made during this presentation, including, but not limited to, statements obtained from third parties. Opinions, estimates and projections constitute the current judgment of the speaker as of the date indicated. They do not necessarily reflect the views and opinions of Apollo and are subject to change at any time without notice. Apollo does not have any responsibility to update this presentation to account for such changes. There can be no assurance that any trends discussed during this presentation will continue.
Statements made throughout this presentation are not intended to provide, and should not be relied upon for, accounting, legal or tax advice and do not constitute an investment recommendation or investment advice. Investors should make an independent investigation of the information discussed during this presentation, including consulting their tax, legal, accounting or other advisors about such information. Apollo does not act for you and is not responsible for providing you with the protections afforded to its clients. This presentation does not constitute an offer to sell, or the solicitation of an offer to buy, any security, product or service, including interest in any investment product or fund or account managed or advised by Apollo.
Certain statements made throughout this presentation may be “forward-looking” in nature. Due to various risks and uncertainties, actual events or results may differ materially from those reflected or contemplated in such forward-looking information. As such, undue reliance should not be placed on such statements. Forward-looking statements may be identified by the use of terminology including, but not limited to, “may”, “will”, “should”, “expect”, “anticipate”, “target”, “project”, “estimate”, “intend”, “continue” or “believe” or the negatives thereof or other variations thereon or comparable terminology.


