


Want it delivered daily to your inbox?
-
Total employment in the federal government is 2.7 million, and the total cost of wages and salaries is roughly $400 billion.
The chart below shows that most federal government workers are in the US Postal Service, Veterans Affairs, Homeland Security, and the Army, Navy, Air Force, and Department of Defense.
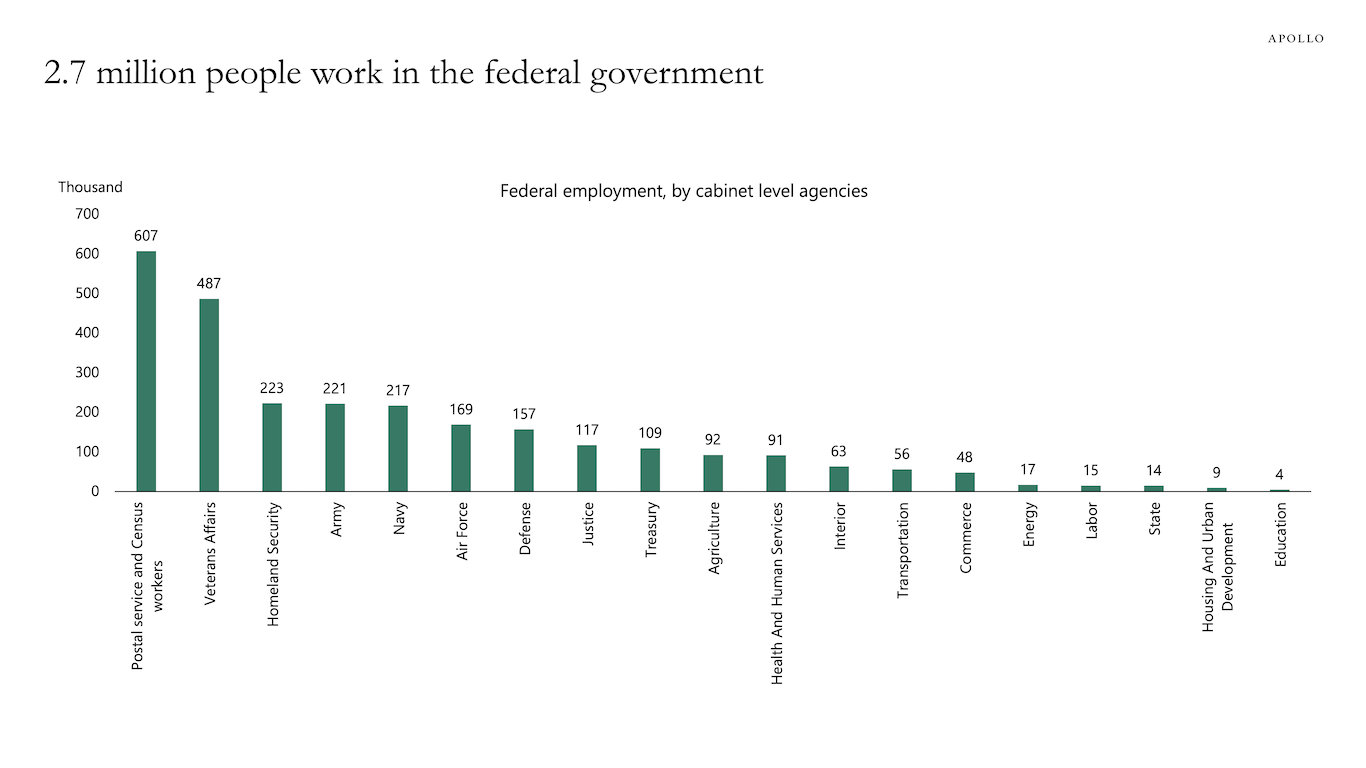
Source: US Office of Personnel Management, BLS, Haver Analytics, Apollo Chief Economist See important disclaimers at the bottom of the page.
-
The first chart below shows that the FOMC continues to revise higher where they think the Fed funds rate will be by the end of 2026.
The second chart shows that the Fed continues to revise higher where they think the Fed funds rate will be in the long run.
The third chart shows that the market continues to revise higher where it thinks the Fed funds rate is going.
The entire purpose of the Fed in keeping interest rates higher for longer is to slow down consumer spending, capex spending, and corporate earnings so that inflation begins to move lower toward the Fed’s 2% inflation target.
The bottom line is that interest rates staying higher for longer is the number one theme in markets as we enter 2025.
This has significant implications for asset allocation and portfolio construction because the most important variable in the finance textbook is the risk-free interest rate. When the risk-free rate goes up, it raises the bar for returns on equities, particularly in a situation where returns in equities have been driven entirely by a handful of tech stocks. In short, higher for longer has important implications for how investors should think about debt versus equity in 2025.
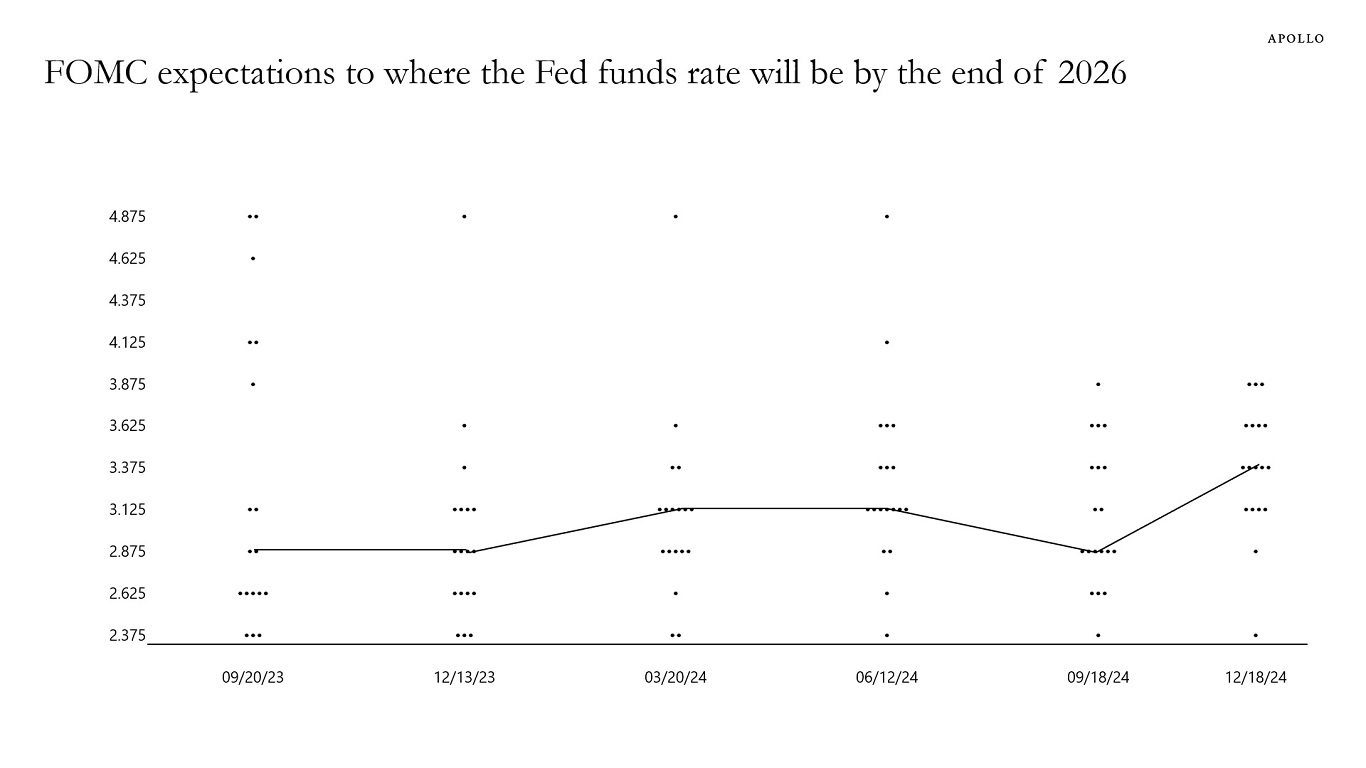
Sources: Bloomberg, Apollo Chief Economist 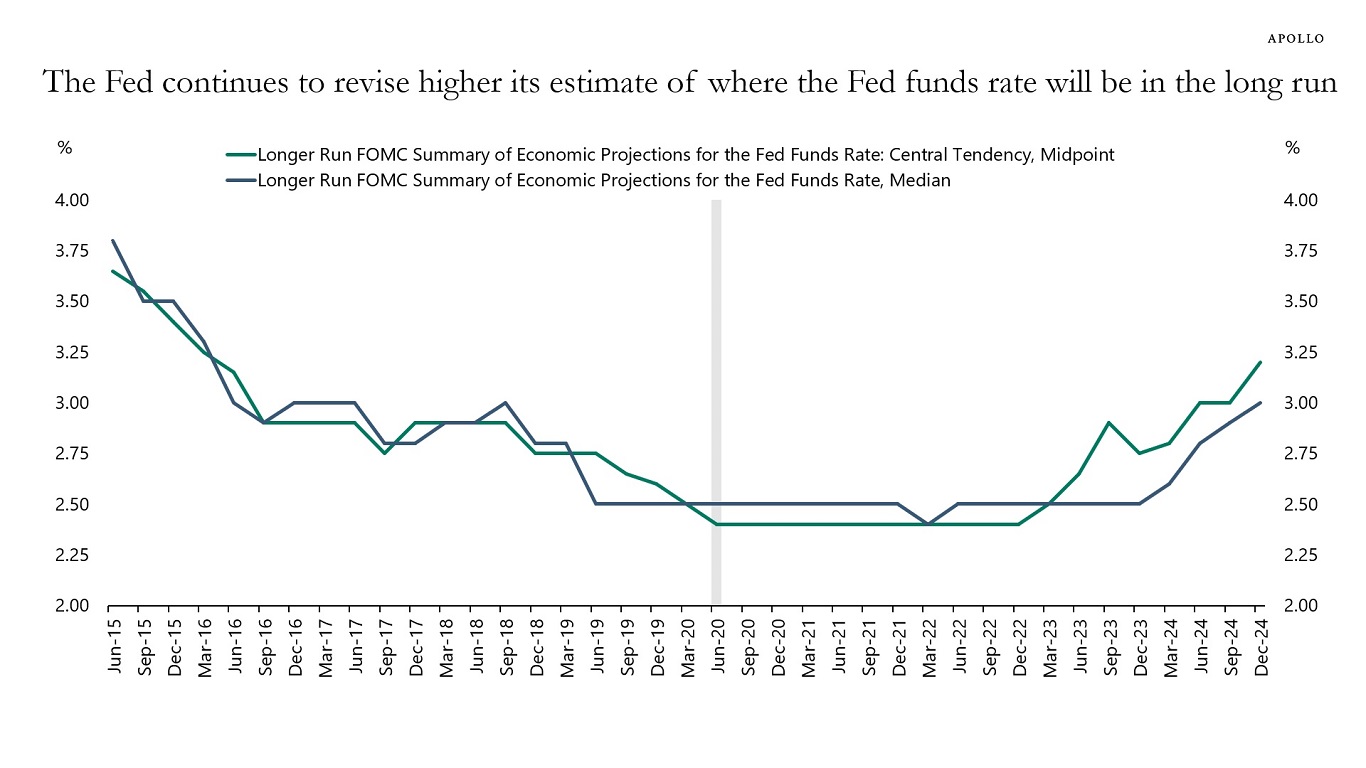
Sources: Federal Reserve Board, Apollo Chief Economist 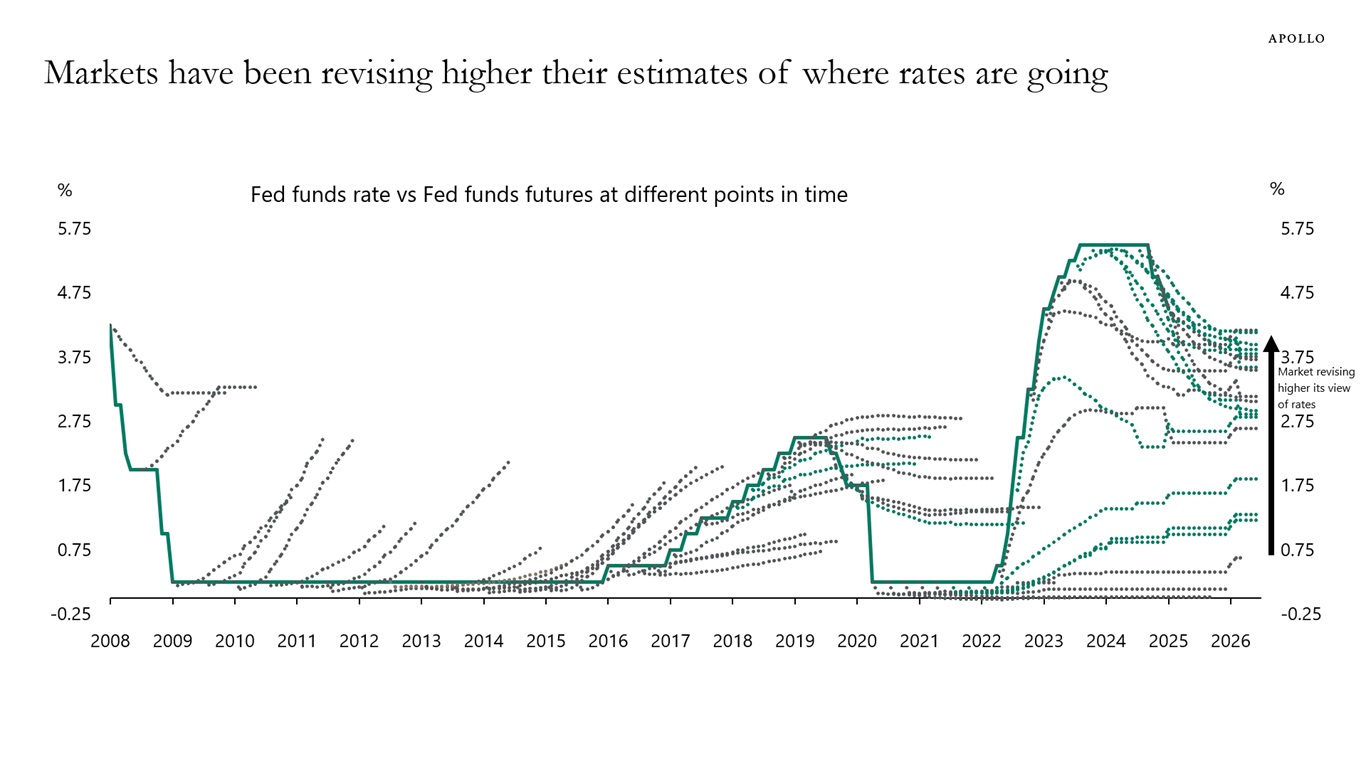
Sources: Federal Reserve Board, Bloomberg, Apollo Chief Economist See important disclaimers at the bottom of the page.
-
Looking at transcripts of earnings calls shows that there is more talk about tariffs among firms in the industrial, health care, consumer discretionary, and IT sectors, see chart below.
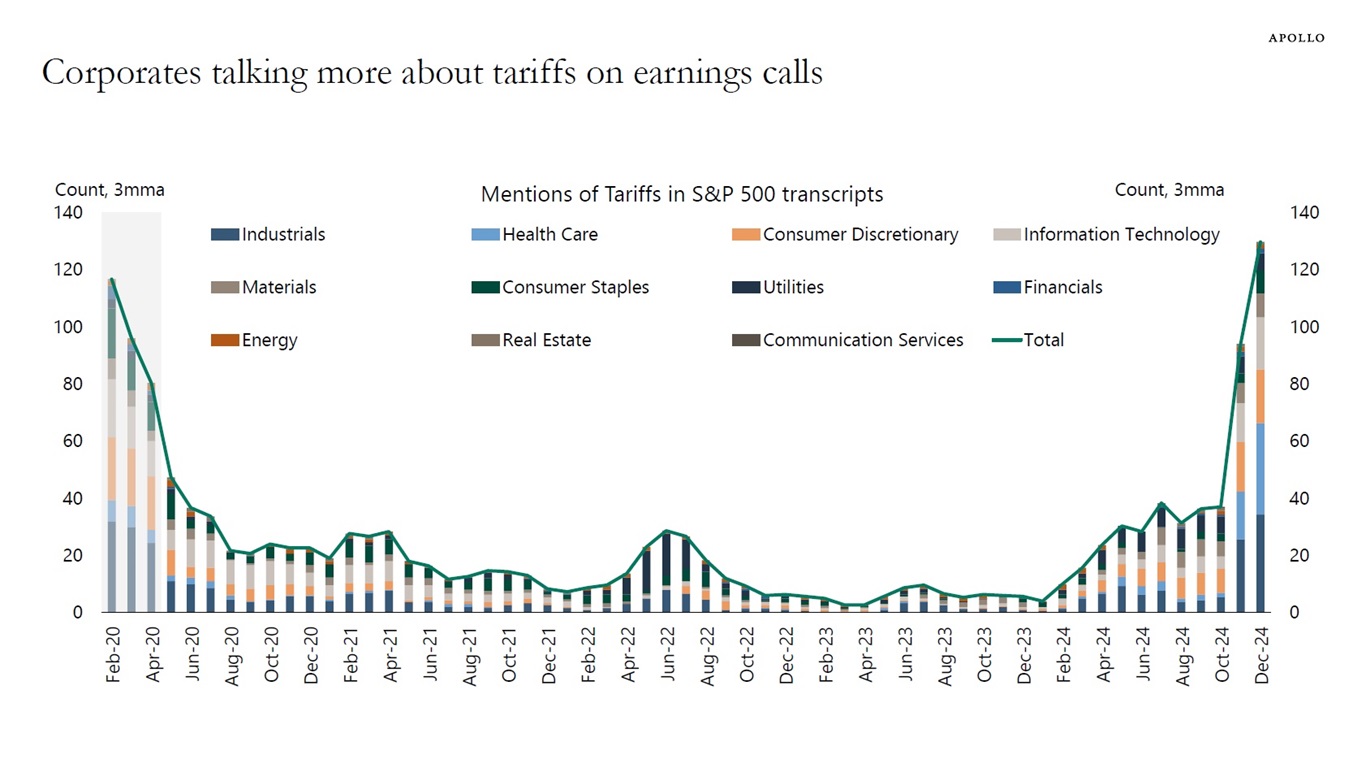
Source: Bloomberg ECAN <GO>, Apollo Chief Economist See important disclaimers at the bottom of the page.
-
The Fed has now cut interest rates 100 bps this year. In a strong economy where growth over the past two quarters has been 3.0% and 2.8%, see chart below, the Atlanta Fed expects GDP growth in the fourth quarter to be 3.2%, well above the CBO’s 2% estimate of long-run US growth.
The strong economy, combined with the potential for lower taxes, higher tariffs, and restrictions on immigration, has increased the risk that the Fed will have to hike rates in 2025. We see a 40% probability that the Fed will raise interest rates in 2025.
For investors, it is starting to look similar to 2022—too high inflation, rising interest rates, and falling stock prices.
The bottom line is that there are significant downside risks to the 60/40 portfolio as we enter 2025.
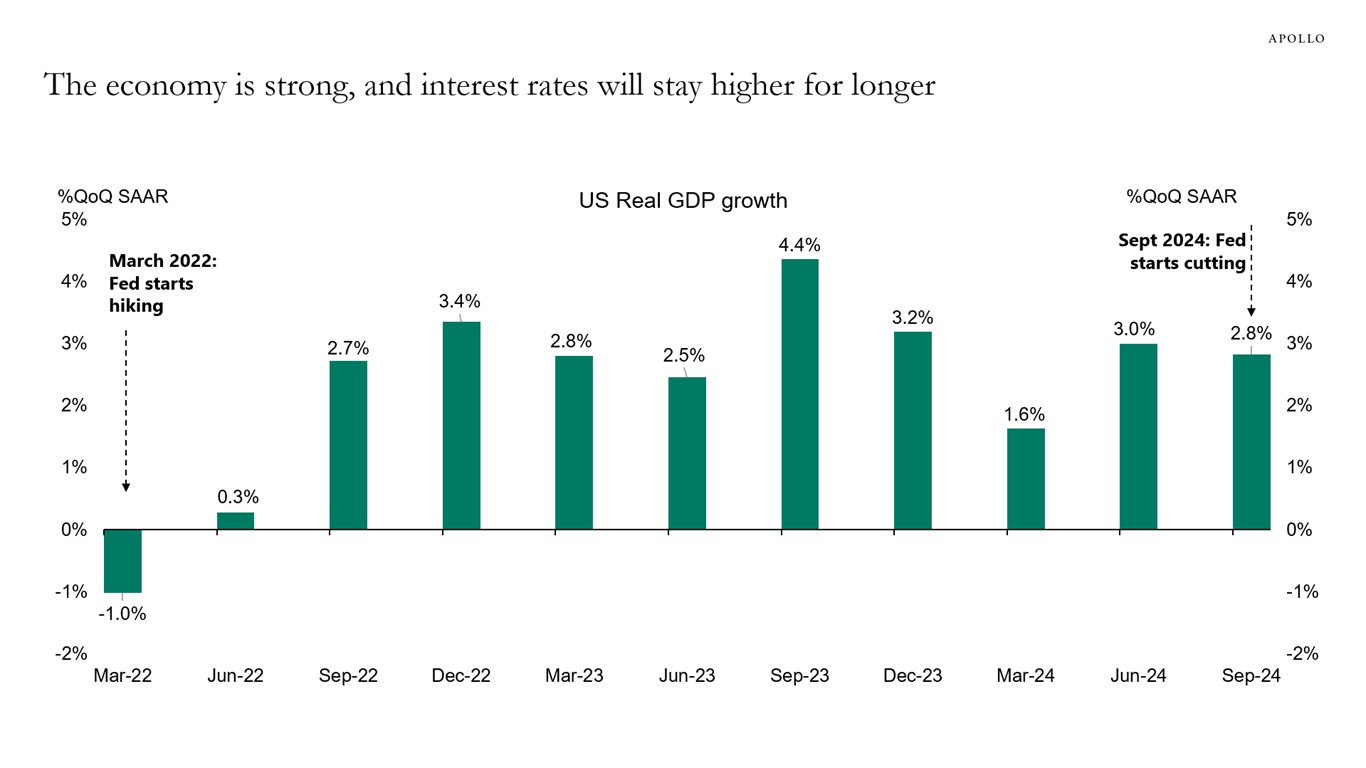
Source: BEA, Haver Analytics, Apollo Chief Economist See important disclaimers at the bottom of the page.
-
Investors are extremely bullish on the stock market, and a record-high share think that there is less than 10% probability of a crash over the coming six months, see chart below.
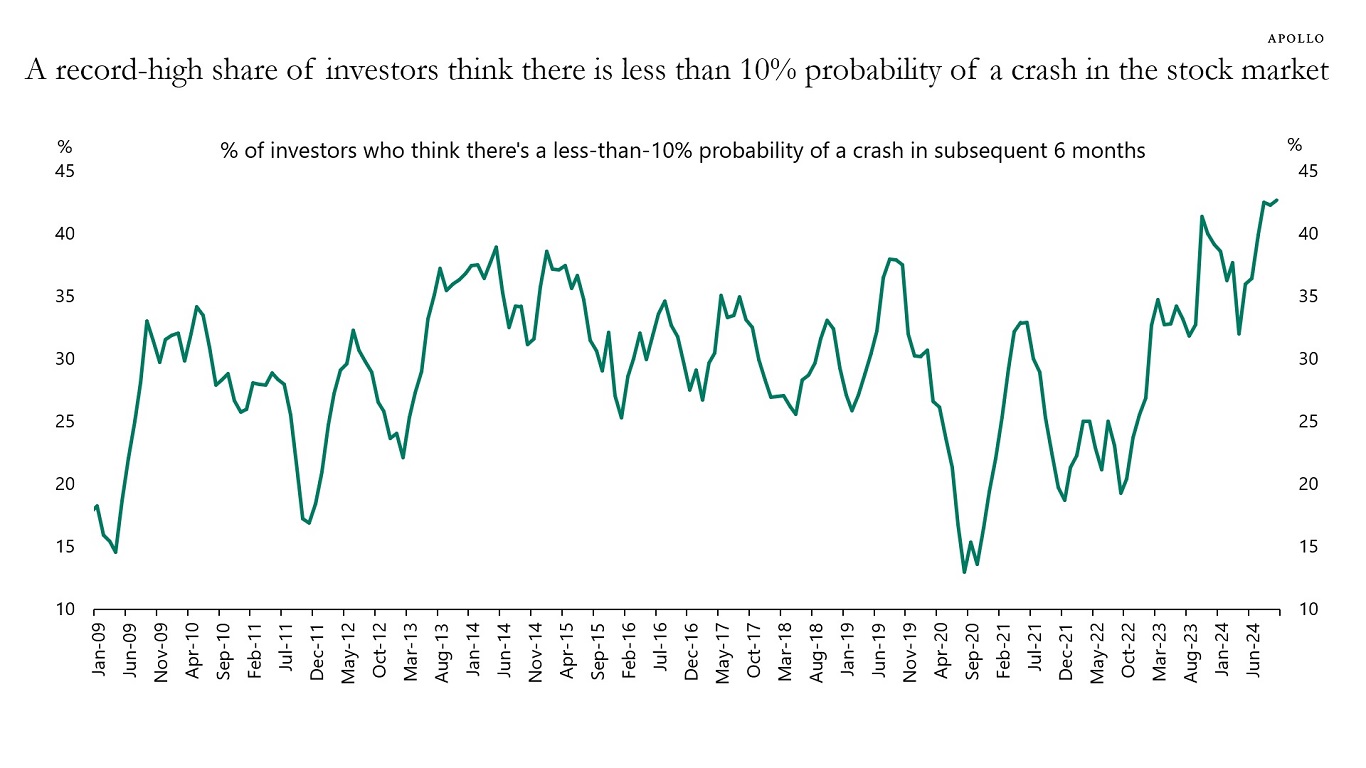
Source: Yale School of Management, Robert Shiller, Apollo Chief Economist See important disclaimers at the bottom of the page.
-
The macro outlook is simple at the moment. The US economy is strong and Europe is weak.
But there are some crucial nuances in the outlook for Europe.
Core countries such as Germany and France are weak, but the periphery countries—Spain, Portugal, and Greece—are strong, see chart below.
This unusual intra-European divergence has important implications for rates, credit, and asset allocation more broadly.
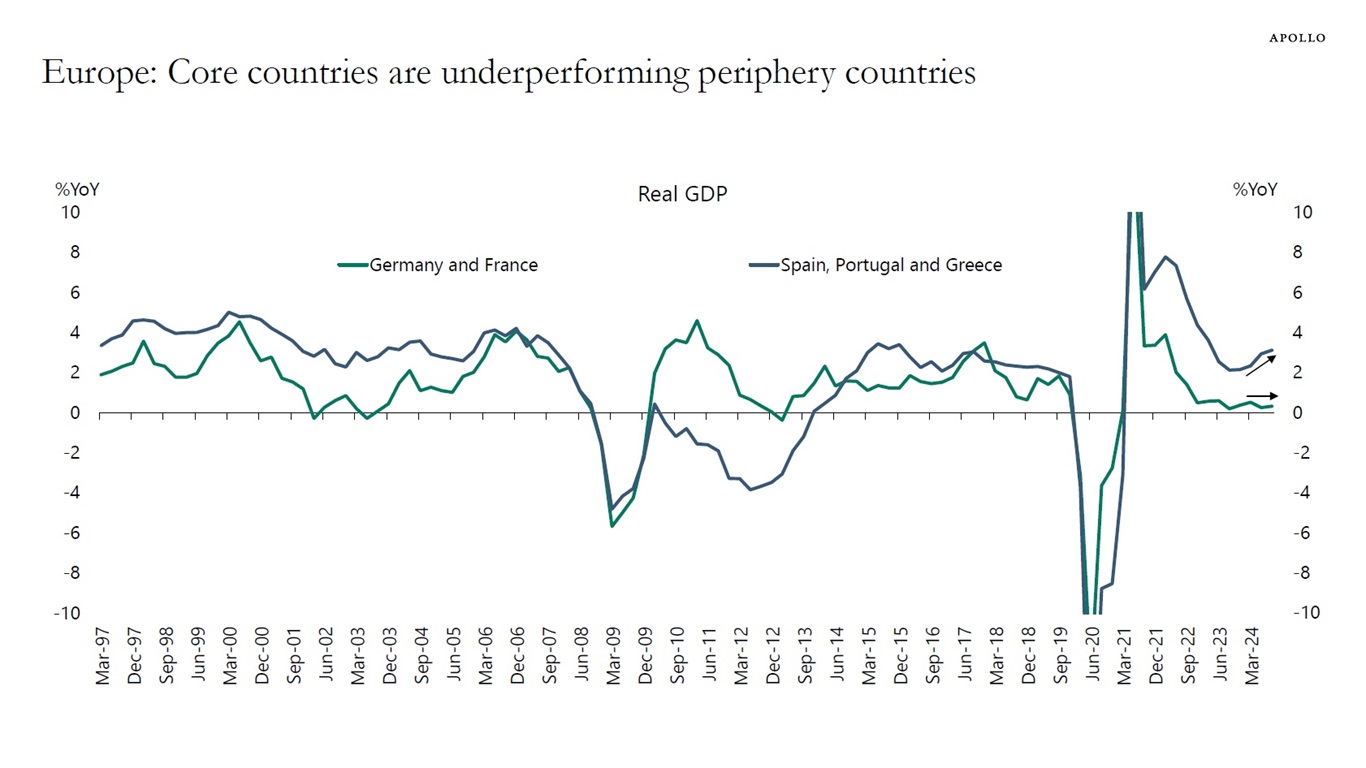
Note: Country groupings are nominal GDP weighted. Source: Bloomberg, Apollo Chief Economist See important disclaimers at the bottom of the page.
-
Japan was in deflation for decades. But that has changed over the past year with wage inflation accelerating to almost 3%, see chart below.
The pressure is intensifying on the BoJ to raise interest rates. This has important implications for the global carry trade, in particular in a situation where the BoJ is hiking and the Fed is cutting.
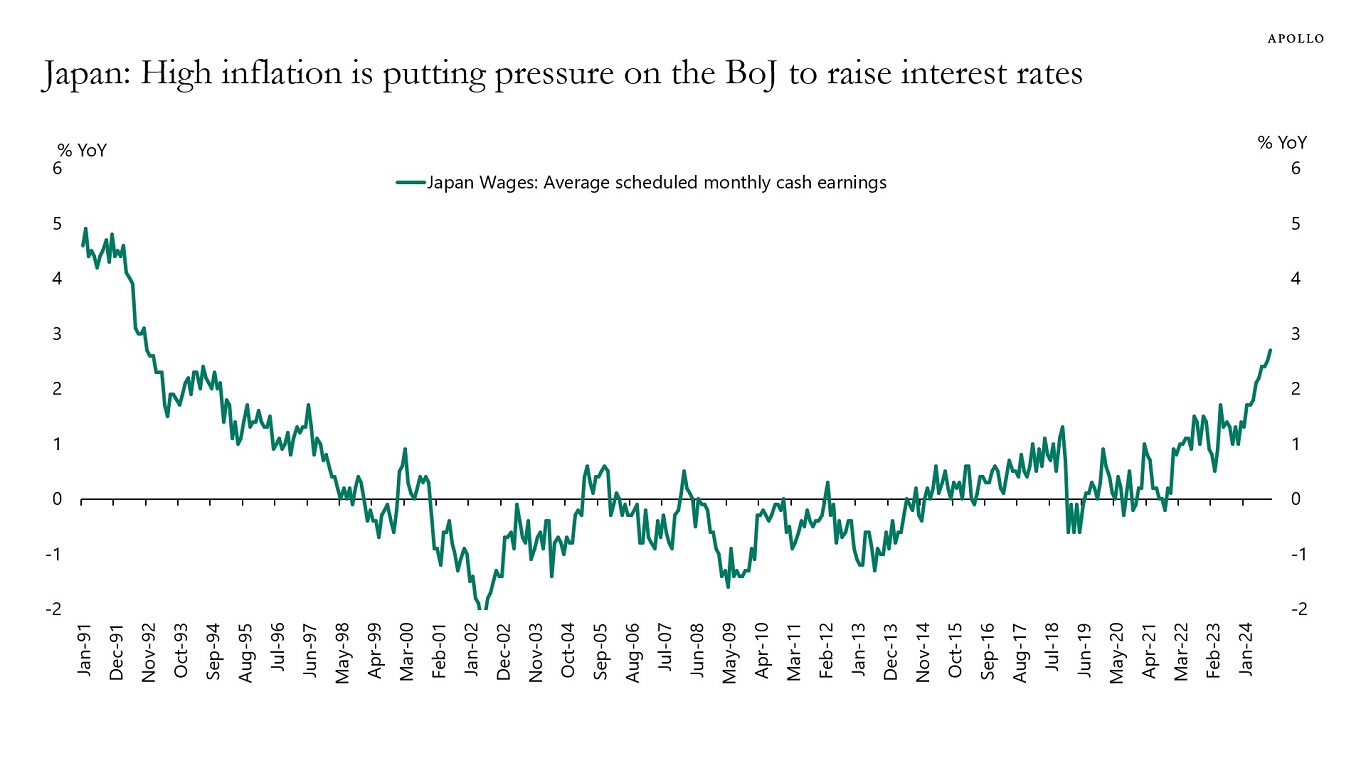
Source: Ministry of Health, Labour and Welfare of Japan, Bloomberg, Apollo Chief Economist See important disclaimers at the bottom of the page.
-
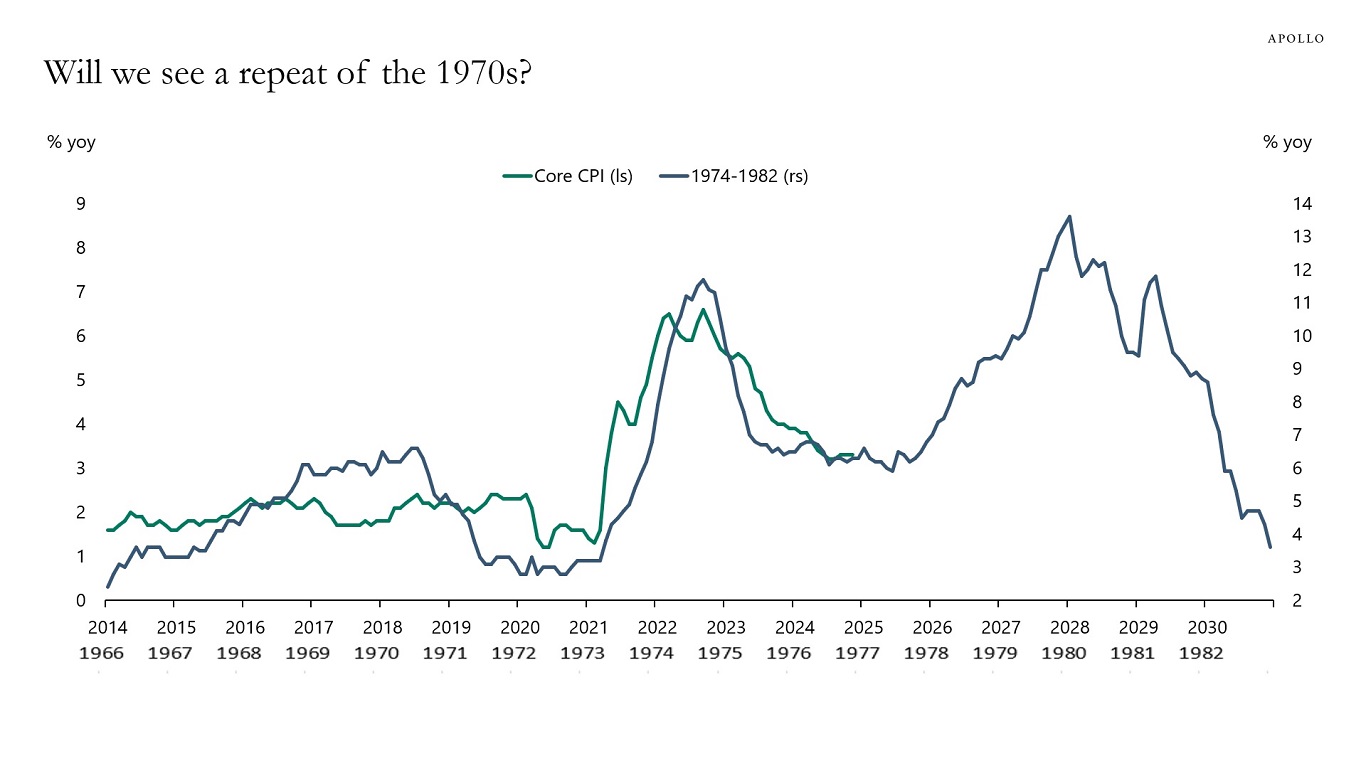
Will we see a repeat of the 1970s with the Fed easing policy too quickly, triggering a rise in inflation in 2025?
Recent inflation readings show signs that the decline in inflation has stalled, and there is a risk of reacceleration, see charts below. Fed and market-implied measures of inflation are all above the Fed’s 2% target and not showing signs of moving down toward the Fed’s 2% inflation target. Short-run and long-run inflation expectations are also moving higher.
The recent uptrend, combined with strong economic momentum, is pointing towards a rebound in inflation in 2025 and not a softening to justify Fed cuts. The probability is rising that the Fed may have to raise interest rates in 2025.
For investors, the risk is a repeat of 2022, where the 60/40 portfolio underperformed significantly.
Our chartbook with recent measures of inflation is available here.
Source: BLS, Bloomberg, Apollo Chief Economist 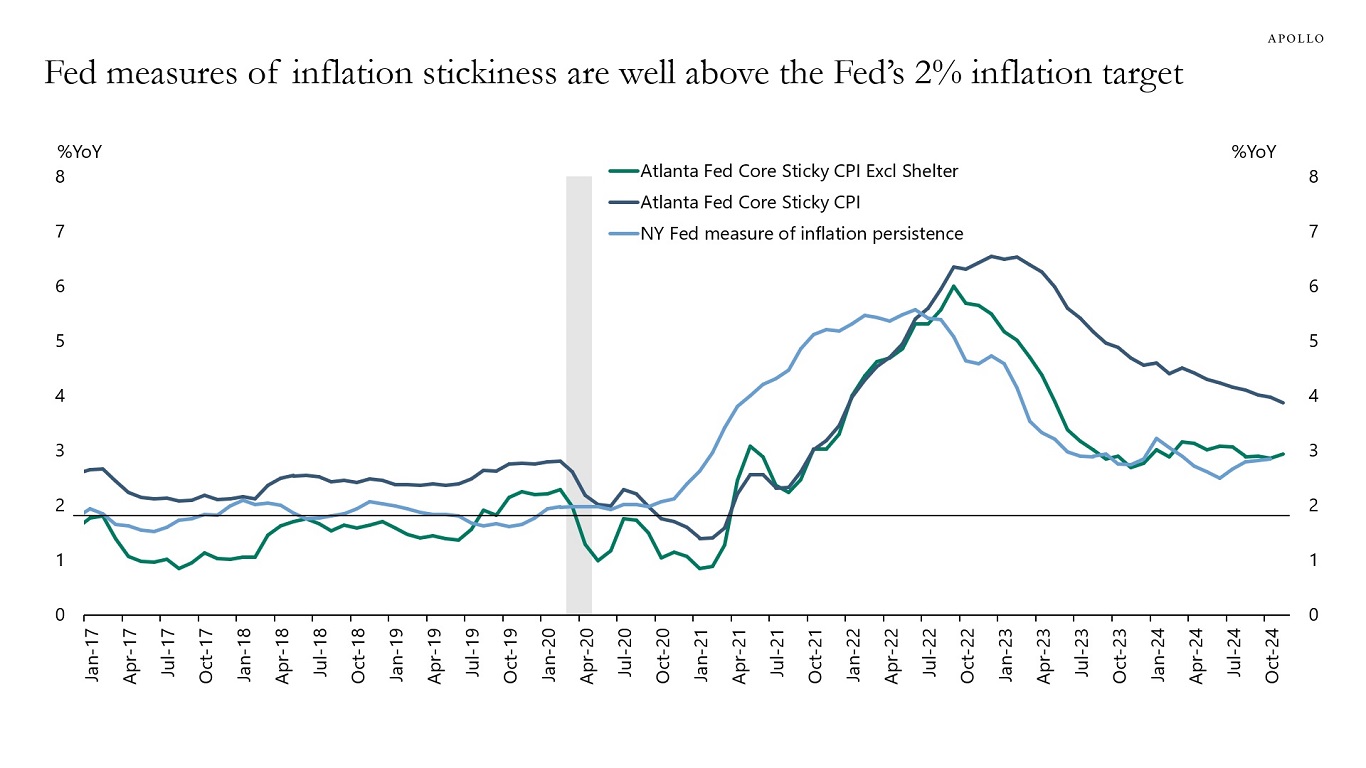
Source: Federal Reserve Bank of Atlanta, Federal Reserve Bank of New York, Haver Analytics, Apollo Chief Economist 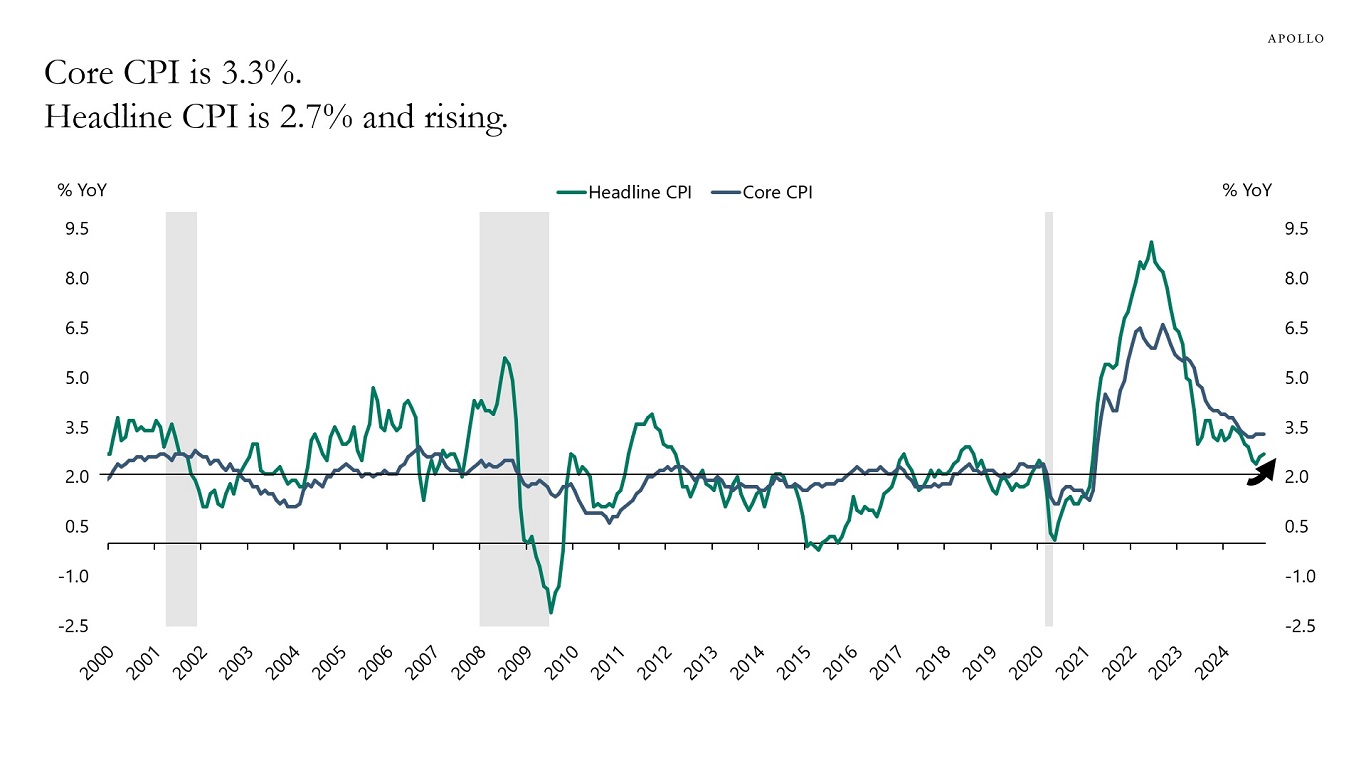
Source: BLS, Haver Analytics, Apollo Chief Economist 
Source: BLS, Haver Analytics, Apollo Chief Economist 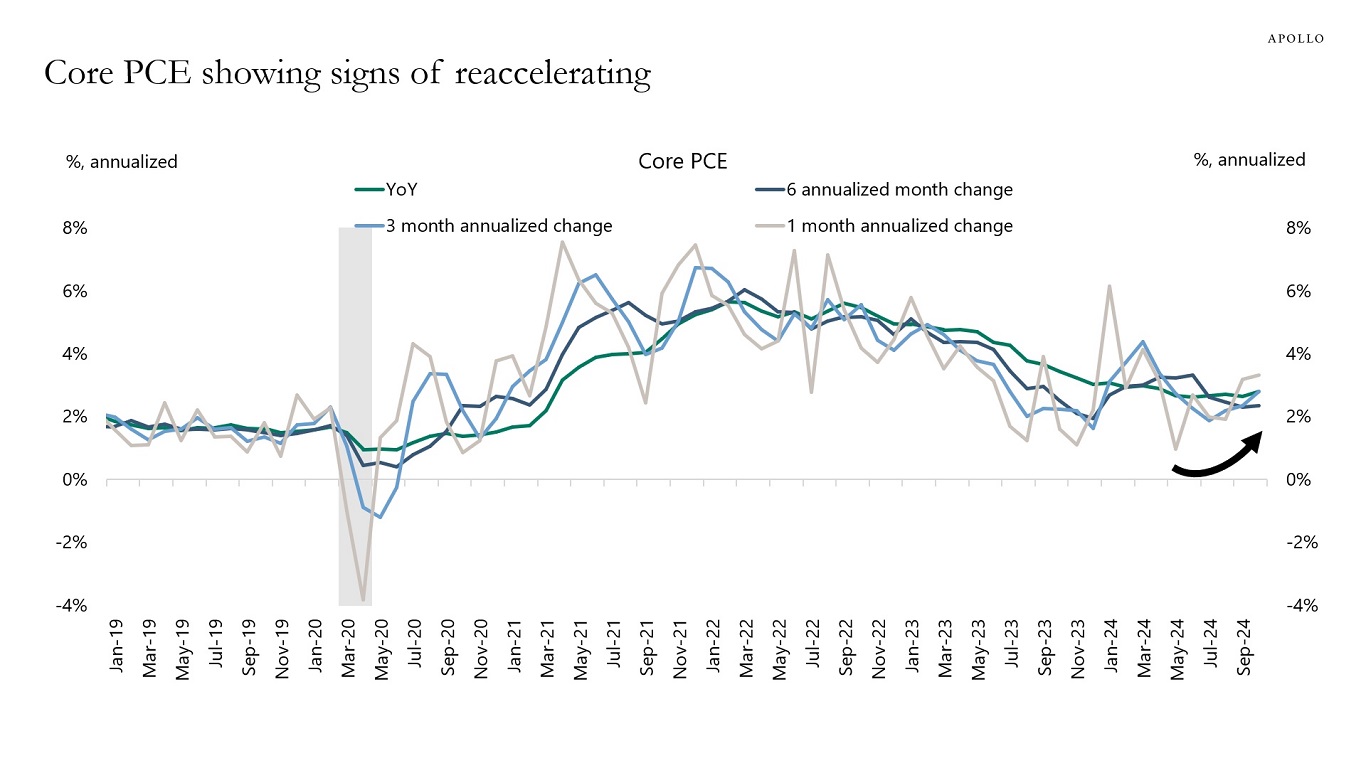
Source: BEA, Haver Analytics, Apollo Chief Economist 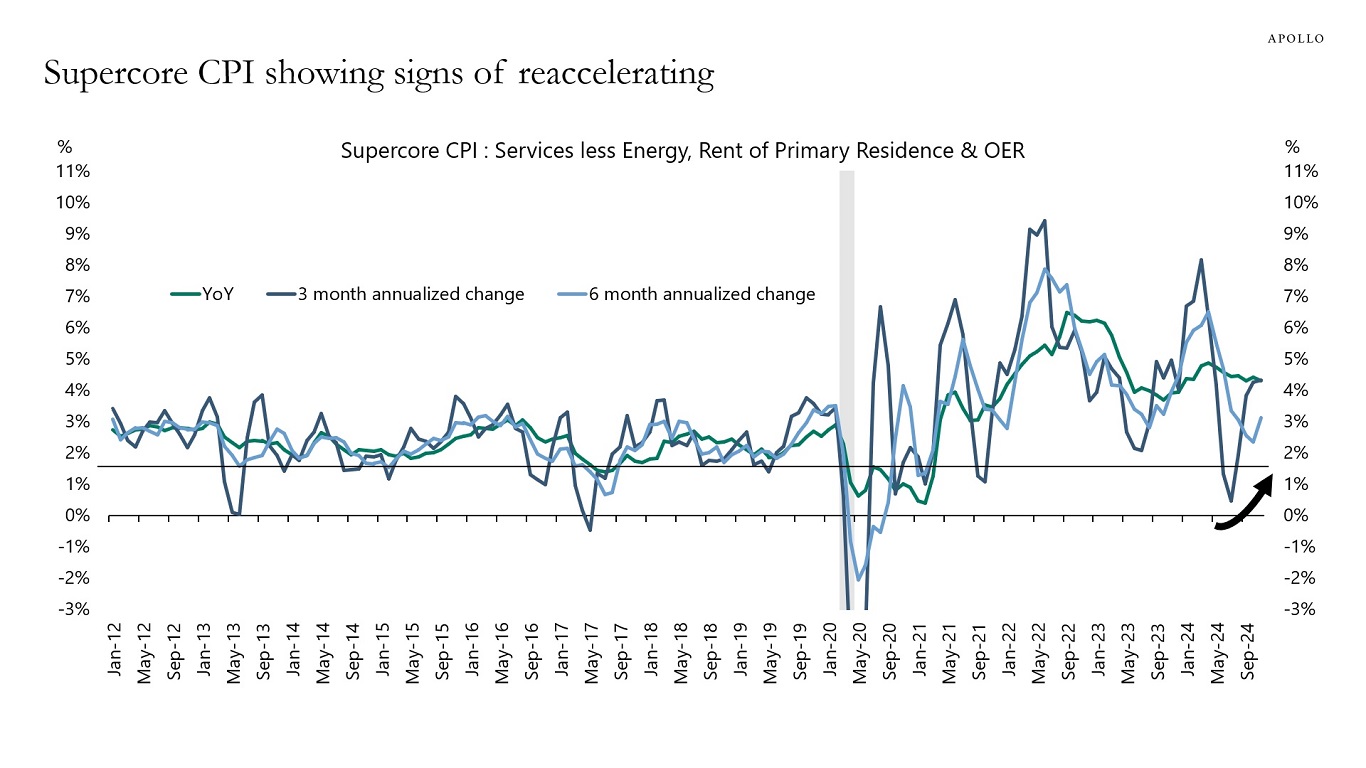
Source: BLS, Haver Analytics, Apollo Chief Economist 
Source: BEA, Haver Analytics, Apollo Chief Economist 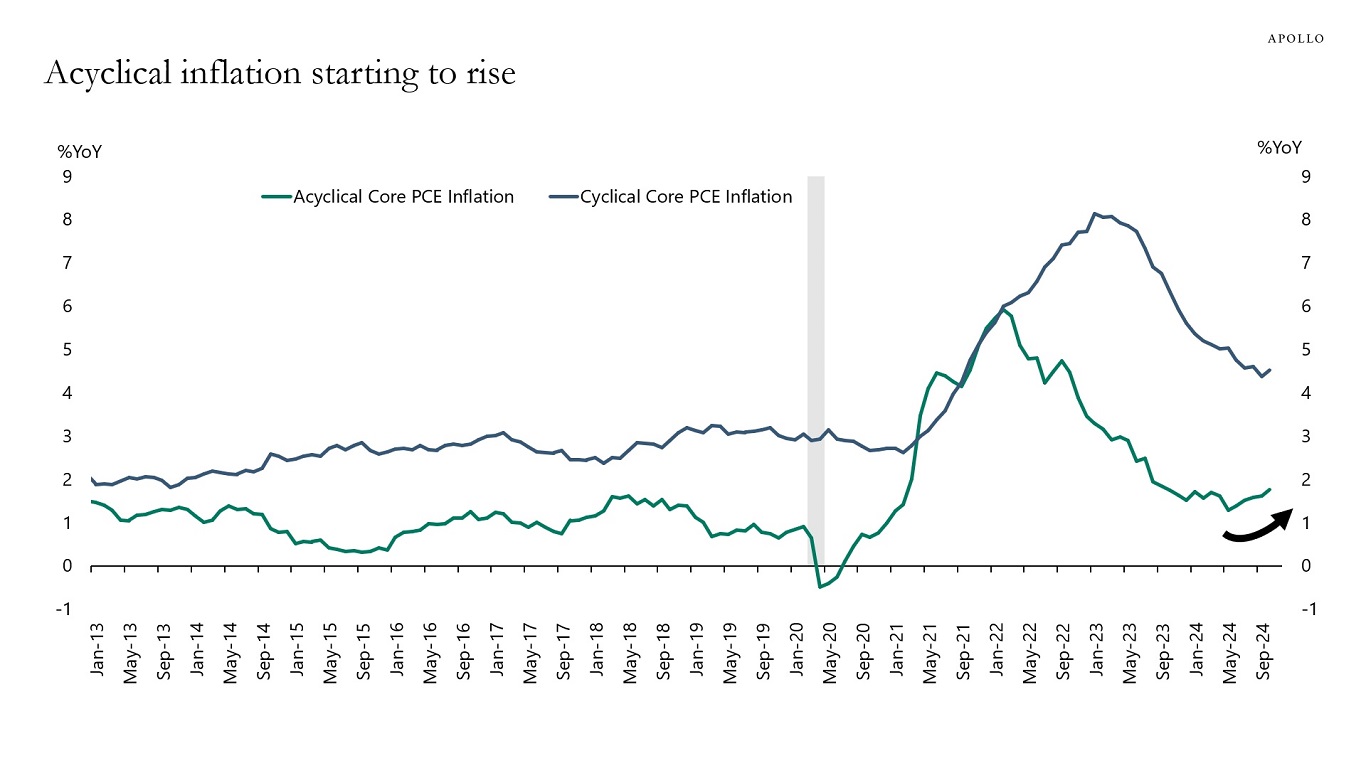
Source: Federal Reserve Bank of San Francisco, Haver Analytics, Apollo Chief Economist 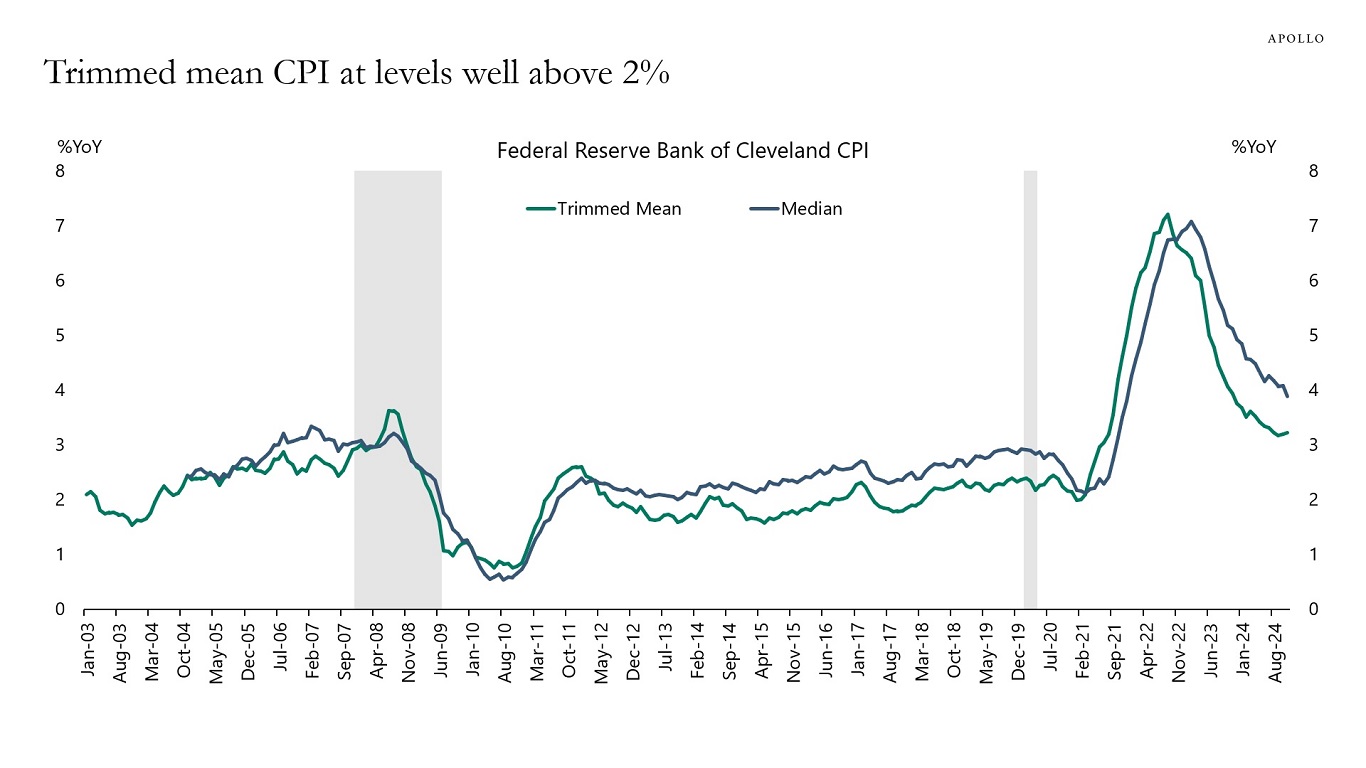
Source: Federal Reserve Bank of Cleveland, Haver Analytics, Apollo Chief Economist 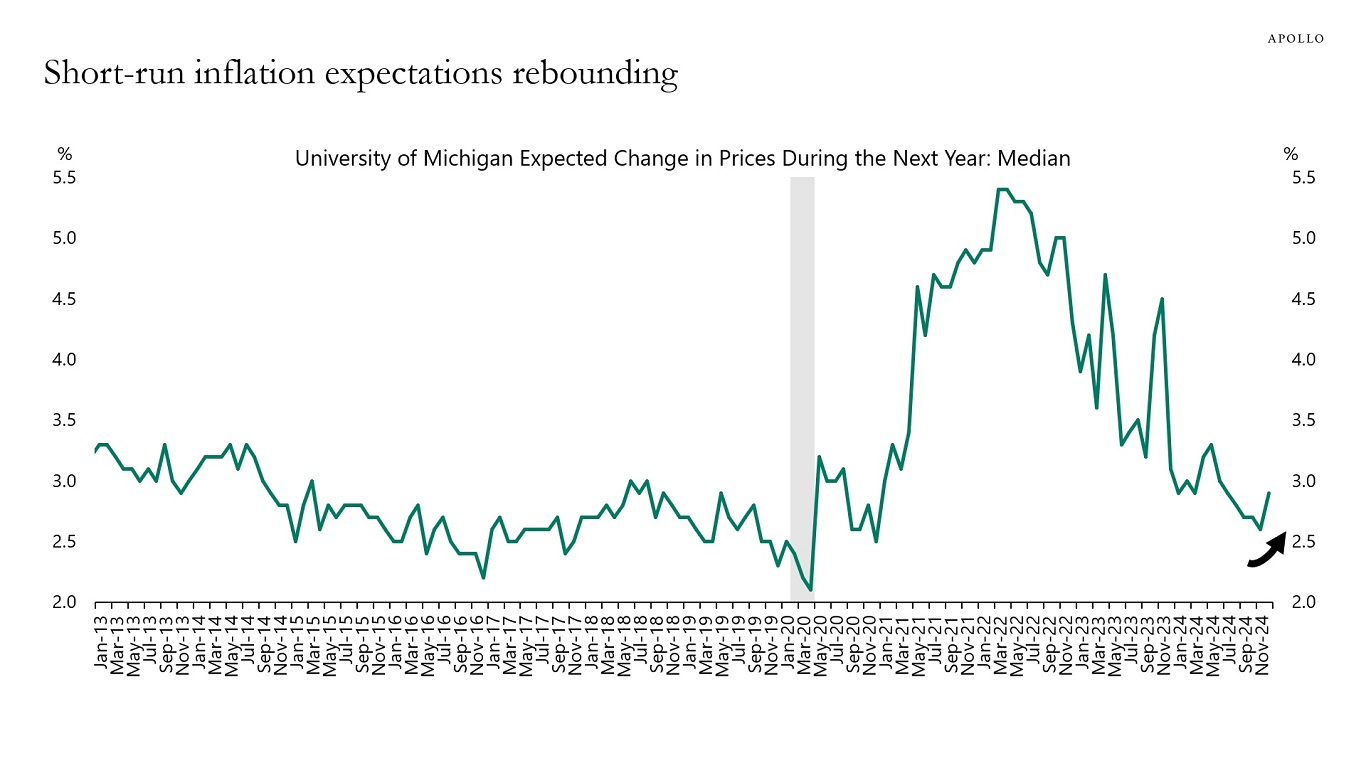
Source: University of Michigan, Haver Analytics, Apollo Chief Economist 
Source: University of Michigan, Haver Analytics, Apollo Chief Economist See important disclaimers at the bottom of the page.
-
In the year ahead for real assets, we reiterate our view of the value of a private infrastructure allocation in a diversified investment portfolio. Private infrastructure has shown resilience in times of market stress and provided downside protection with low correlation to other major asset classes.1 There are powerful macroeconomic tailwinds bolstering infrastructure today, including federal spending initiatives and the global need to update aging infrastructure.
We see three key themes in real assets:
1. The global need to update aging infrastructure shows an $88 trillion funding gap by 2040.2
2. Unprecedented regulatory support has catalyzed spending on infrastructure, including the bipartisan infrastructure law that authorized $1.2 trillion for transportation and infrastructure spending with $550 billion of that figure going toward “new” investments and programs.
3. The opportunity set includes digital infrastructure, where increasing computing power from generative AI and related technologies is driving heightened demand for data centers and electricity.
Our real assets chart book is available here.
We also published our 2025 Economic Outlook this week.

1. Infrastructure Investing: Embracing Complexity in Times of Structural Change, 2023
2. Apollo Chief Economist, Global Infrastructure Outlook, Global Infrastructure Hub, 2020See important disclaimers at the bottom of the page.
-
For private equity, we see three key themes in the year ahead:
1. Lower interest rates could spark a new wave of deals as, on one hand, sponsors seek to deploy capital raised in the past three years and, on the other, managers may be willing to part with existing investments as cheaper borrowing costs may bolster valuations.
2. We believe the secondary market can offer excess return per unit of risk when compared to other private market strategies due to a variety of factors, including a rapidly evolving secondary investment landscape.
3. There is plentiful demand for hybrid solutions, including M&A financing and capital for growth, re-equitization of over-levered balance sheets, owner and sponsor liquidity solutions, and financing to support public company growth initiatives.
Our private equity chart book is available here.
We also published our 2025 Economic Outlook this week.

See important disclaimers at the bottom of the page.

This presentation may not be distributed, transmitted or otherwise communicated to others in whole or in part without the express consent of Apollo Global Management, Inc. (together with its subsidiaries, “Apollo”).
Apollo makes no representation or warranty, expressed or implied, with respect to the accuracy, reasonableness, or completeness of any of the statements made during this presentation, including, but not limited to, statements obtained from third parties. Opinions, estimates and projections constitute the current judgment of the speaker as of the date indicated. They do not necessarily reflect the views and opinions of Apollo and are subject to change at any time without notice. Apollo does not have any responsibility to update this presentation to account for such changes. There can be no assurance that any trends discussed during this presentation will continue.
Statements made throughout this presentation are not intended to provide, and should not be relied upon for, accounting, legal or tax advice and do not constitute an investment recommendation or investment advice. Investors should make an independent investigation of the information discussed during this presentation, including consulting their tax, legal, accounting or other advisors about such information. Apollo does not act for you and is not responsible for providing you with the protections afforded to its clients. This presentation does not constitute an offer to sell, or the solicitation of an offer to buy, any security, product or service, including interest in any investment product or fund or account managed or advised by Apollo.
Certain statements made throughout this presentation may be “forward-looking” in nature. Due to various risks and uncertainties, actual events or results may differ materially from those reflected or contemplated in such forward-looking information. As such, undue reliance should not be placed on such statements. Forward-looking statements may be identified by the use of terminology including, but not limited to, “may”, “will”, “should”, “expect”, “anticipate”, “target”, “project”, “estimate”, “intend”, “continue” or “believe” or the negatives thereof or other variations thereon or comparable terminology.