


Want it delivered daily to your inbox?
-
The Plaza Accord was a meeting held in September 1985 at the Plaza Hotel, where the G7 countries agreed to intervene in FX markets to depreciate the US dollar, see chart below. We will not see a repeat of the Plaza Accord today for two reasons. First, the dollar is far from the levels of appreciation seen in the mid-1980s. Second, the economic outlook for Europe, the UK, Canada, and Australia is weak, and the rest of the G7 wants to continue to depreciate their exchange rates to boost their exports.
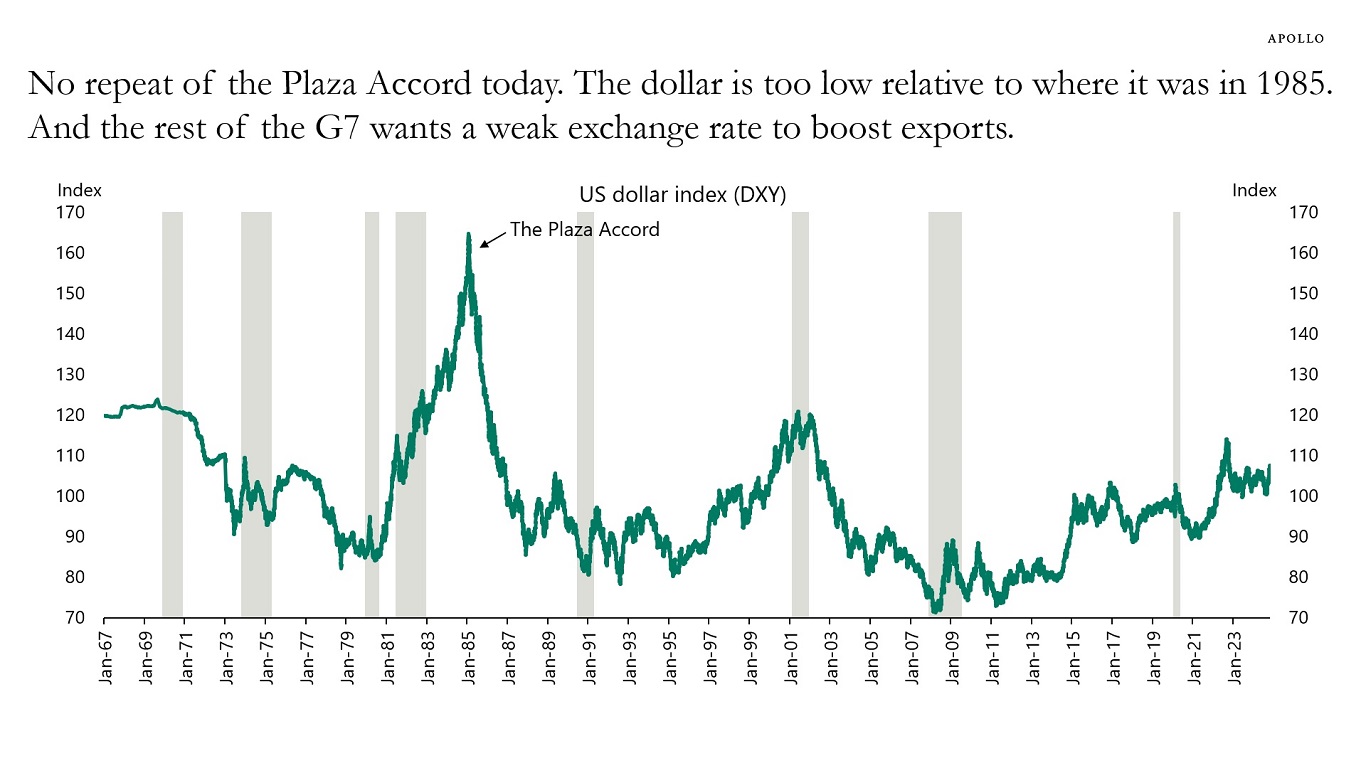
Source: Bloomberg, Apollo Chief Economist See important disclaimers at the bottom of the page.
-
A new industrial renaissance has started, driven by industrial policies, see charts below and our chart book available here.
Source: Apollo Chief Economist, OECD 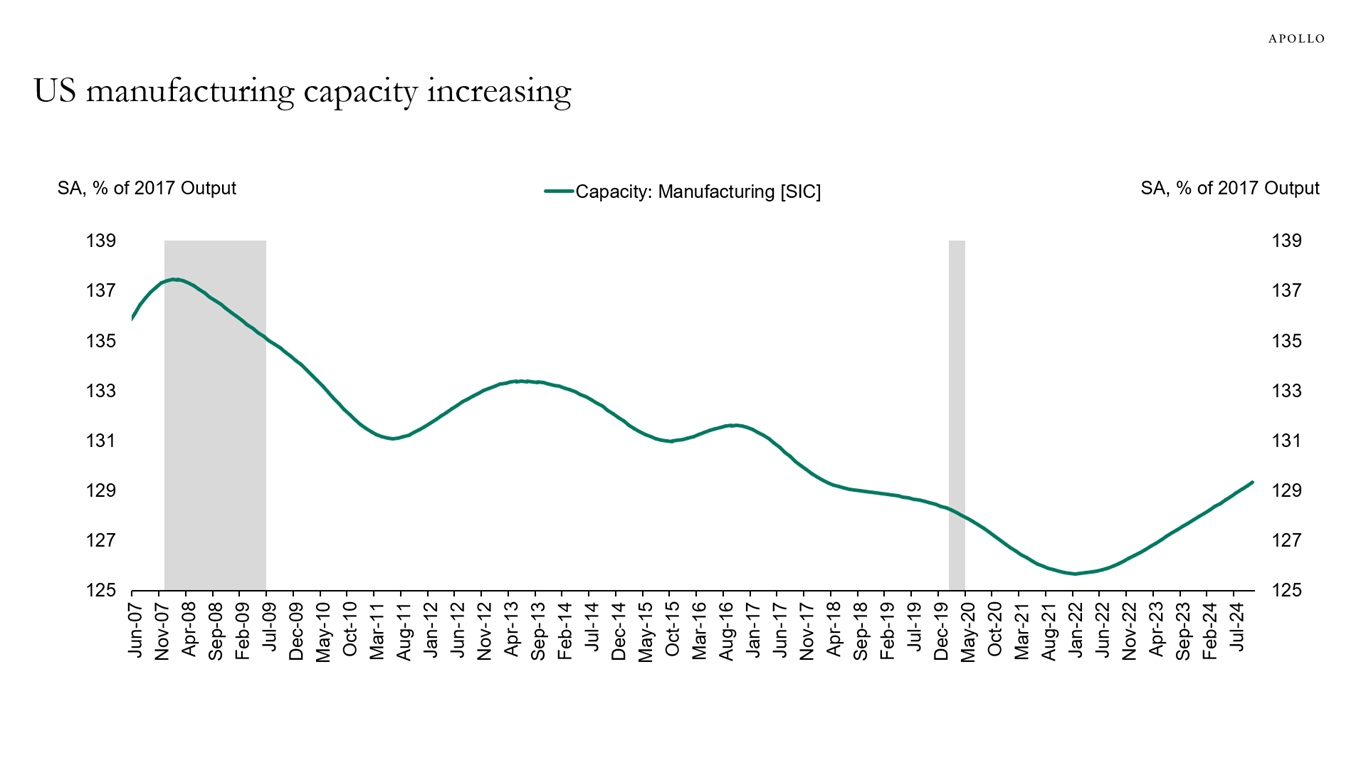
Note: SIC = Standard Industrial Classification. Source: Federal Reserve Board, National Bureau of Economic Research, Haver Analytics, Apollo Chief Economist 
See important disclaimers at the bottom of the page.
-
In the United States, 95% of mortgages are 30-year fixed rate, and mortgage debt makes up a smaller share of household debt for lower-income groups, which means that lower-income groups are more vulnerable to Fed hikes and interest rates staying higher for longer, see chart below.
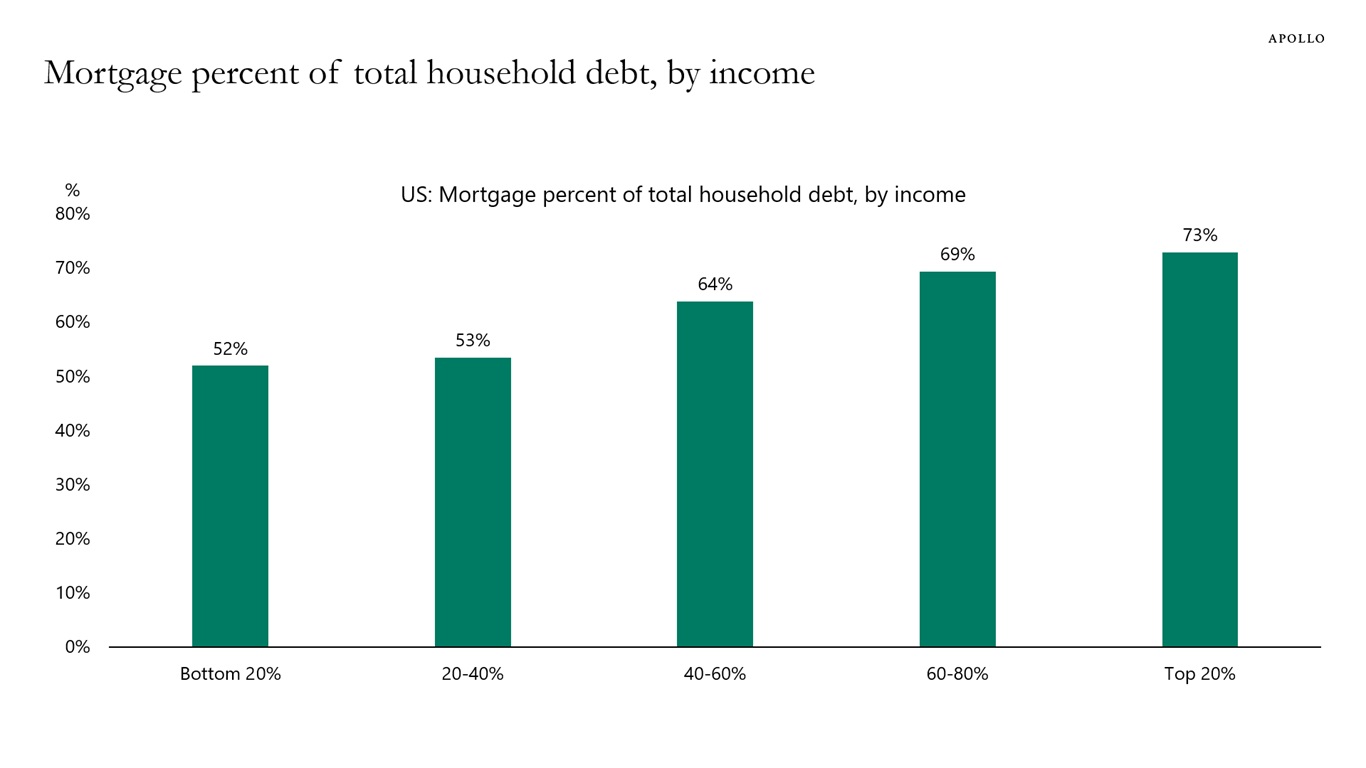
Note: Data for 2024 Q2. Source: Federal Reserve, Apollo Chief Economist See important disclaimers at the bottom of the page.
-
In the United States, 73 million people receive social security benefits, see the first chart below.
Social security spending and Medicare and healthcare spending make up half of the total $6.75 trillion in federal spending, see the second chart below.
In addition, for the fiscal year 2024, the government spent more money on debt servicing costs than on Medicare and on defense, see again the second chart.
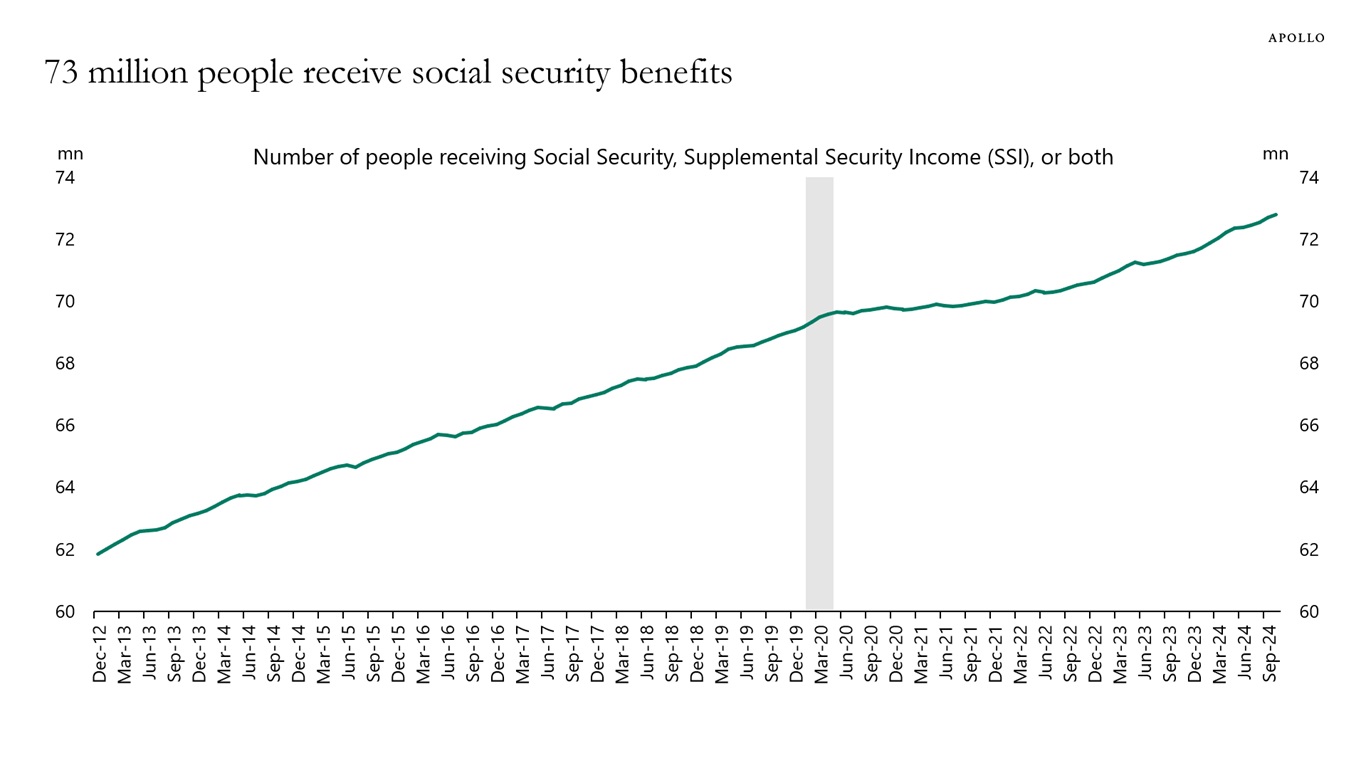
Note: Social Security beneficiaries who are entitled to a primary and a secondary benefit (dual entitlement) are counted only once. SSI counts include recipients of federal SSI, federally administered state supplementation, or both. Source: Social Security Administration, Master Beneficiary Record and Supplemental Security Record, Apollo Chief Economist 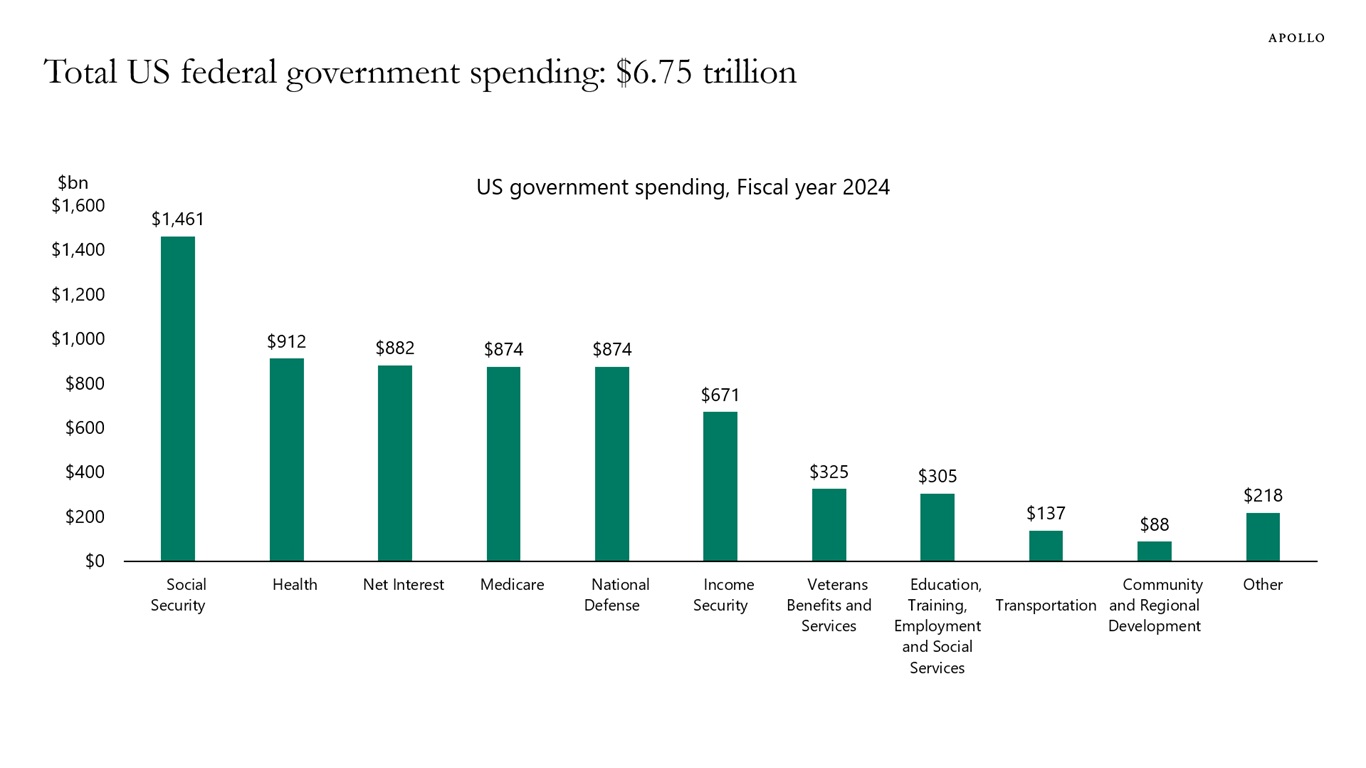
Source: US Treasury, Bloomberg, Apollo Chief Economist See important disclaimers at the bottom of the page.
-
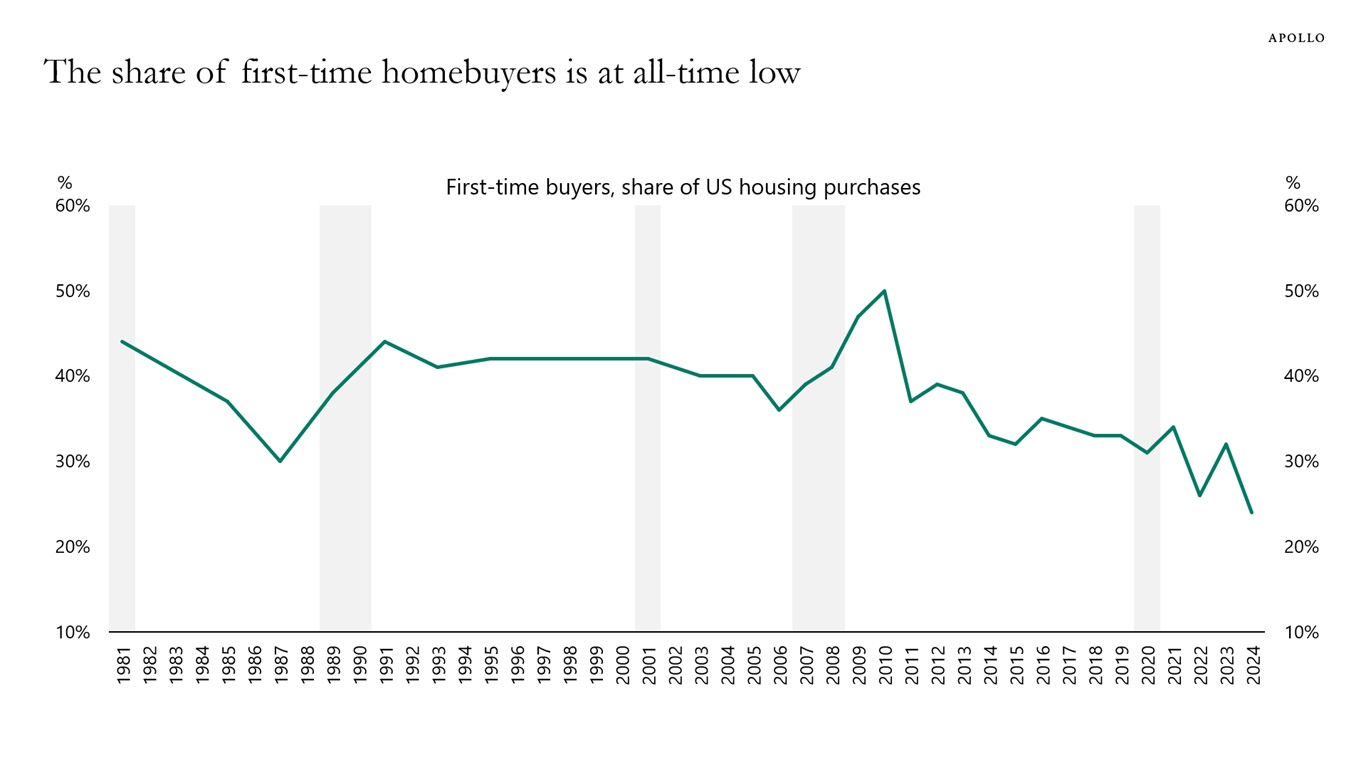
Only 24% of homes purchased at the moment are bought by first-time homebuyers. This is the lowest level on record, see chart below.
Source: National Association of Realtors, Apollo Chief Economist See important disclaimers at the bottom of the page.
-
Sometimes, FOMC members think the risk to their inflation forecast is to the upside, and sometimes, they think the risk to their inflation forecast is to the downside, see the first chart below.
This is in sharp contrast to their views on the risks to the unemployment rate.
The number of FOMC members who think the risk to their forecast for the unemployment rate is weighted to the upside is always much higher than the number of FOMC members who think the risk to their unemployment rate forecast is to the downside, see the second chart.
In other words, the Fed has a very asymmetric view on its dual mandate, putting much more weight on low unemployment than on getting inflation to stay at 2%.
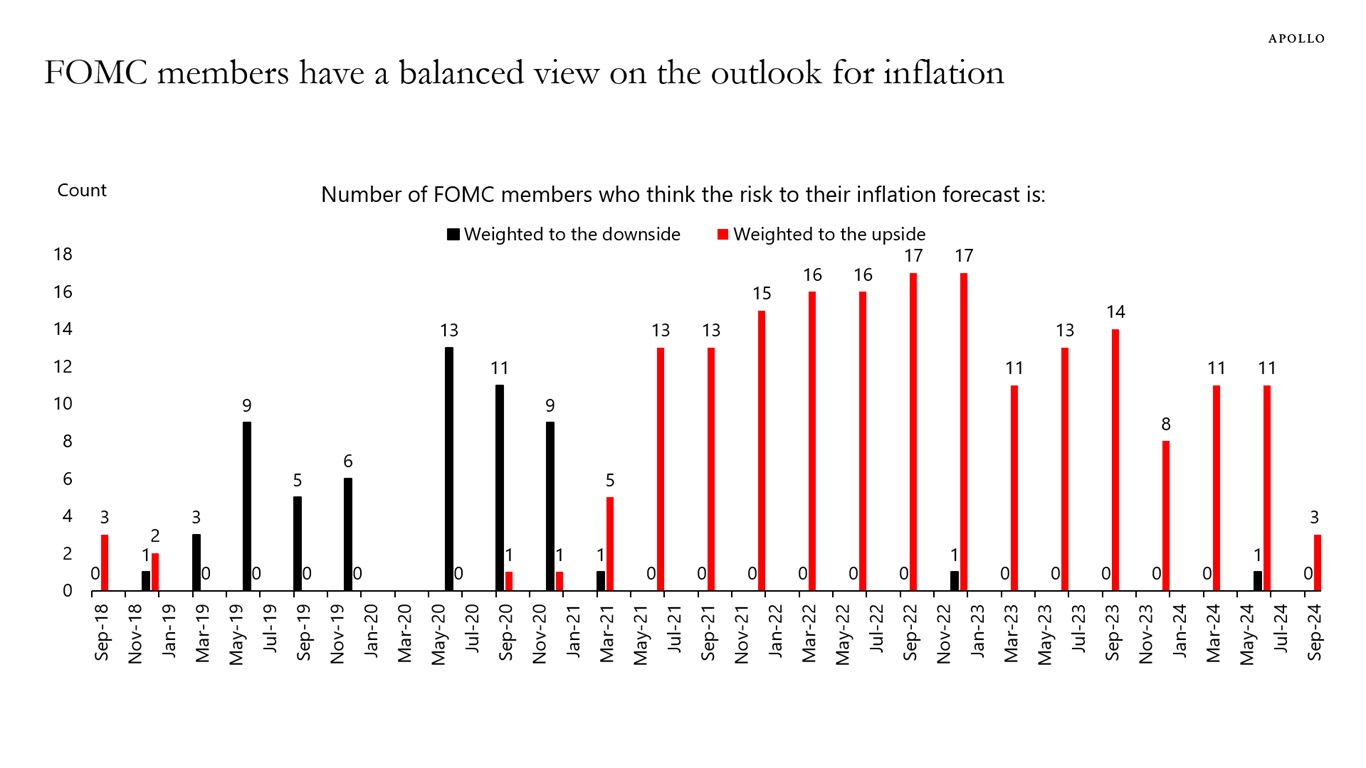
Note: No survey was conducted in March 2020. Source: Federal Reserve, Bloomberg, Apollo Chief Economist 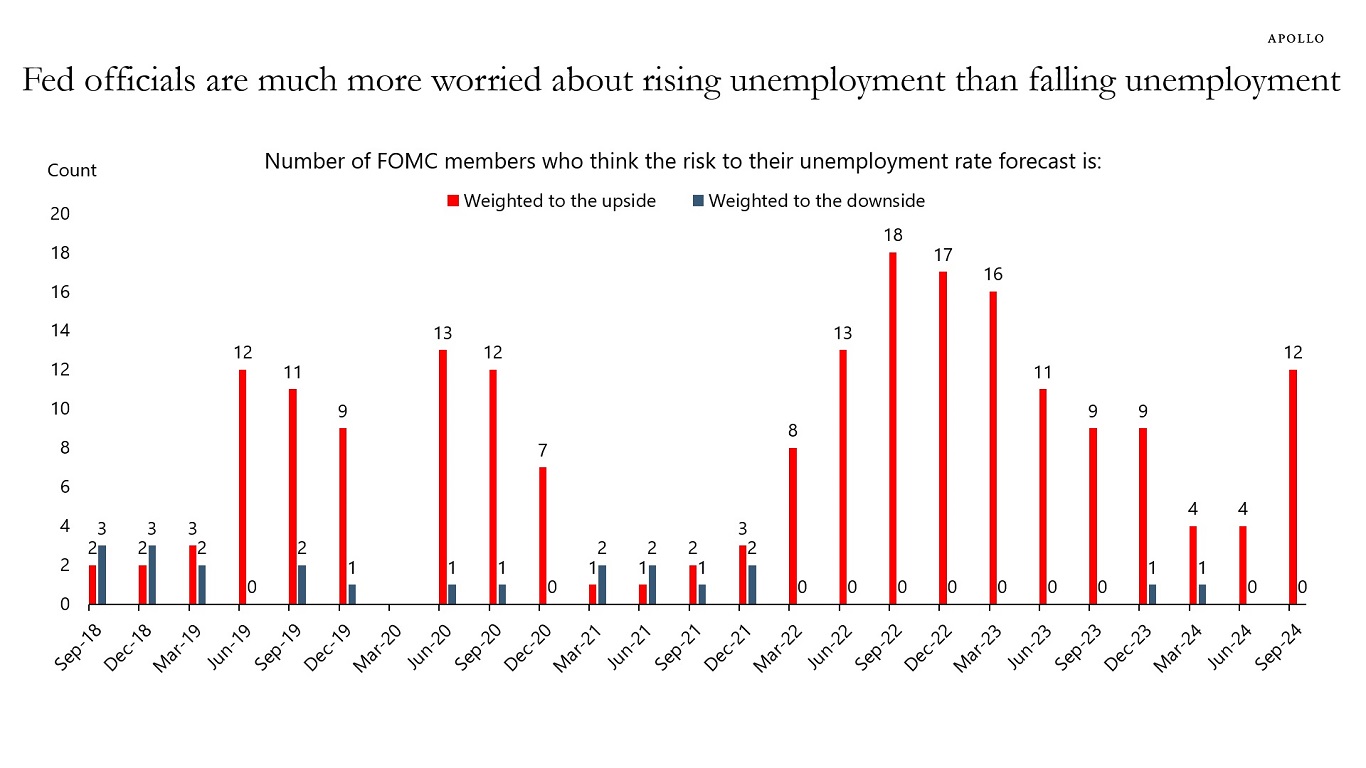
Note: No survey was conducted in March 2020. Source: Federal Reserve, Apollo Chief Economist See important disclaimers at the bottom of the page.
-
The Consumer Price Index is 22% higher than in January 2020, see chart below.
This means that the prices of all goods and services that consumers spend money on are up, on average, 22%.
For example, since January 2020, the price of cereal is 30% higher, household electricity is 32% higher, and car insurance is 52% higher.
The bottom line is that the Fed’s preferred measure of inflation, namely year-over-year inflation, may be back near 2%, but the living costs for households are still dramatically higher than four years ago.
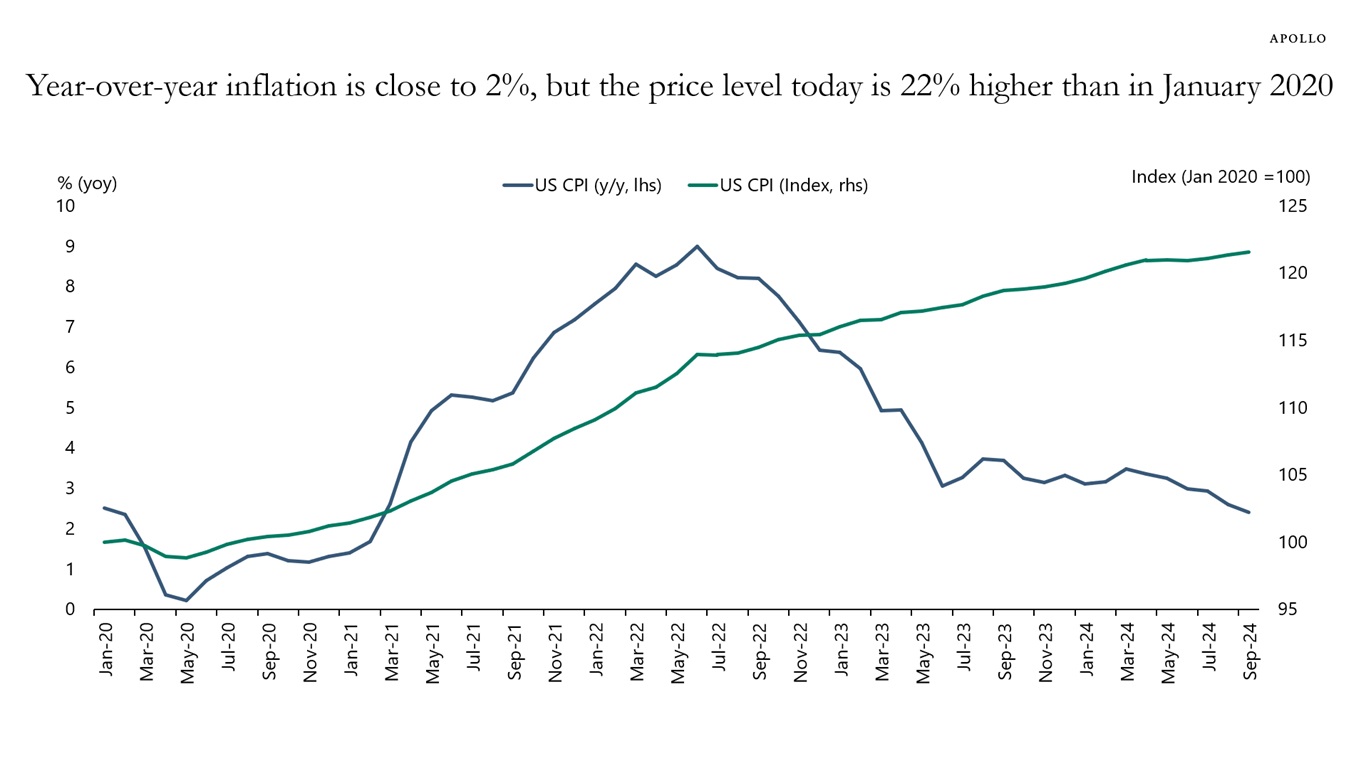
Source: Bureau of Labor Statistics, Bloomberg, Apollo Chief Economist See important disclaimers at the bottom of the page.
-
The amount of dry powder in global private equity has started to decline from the peak in 2023, see chart below.
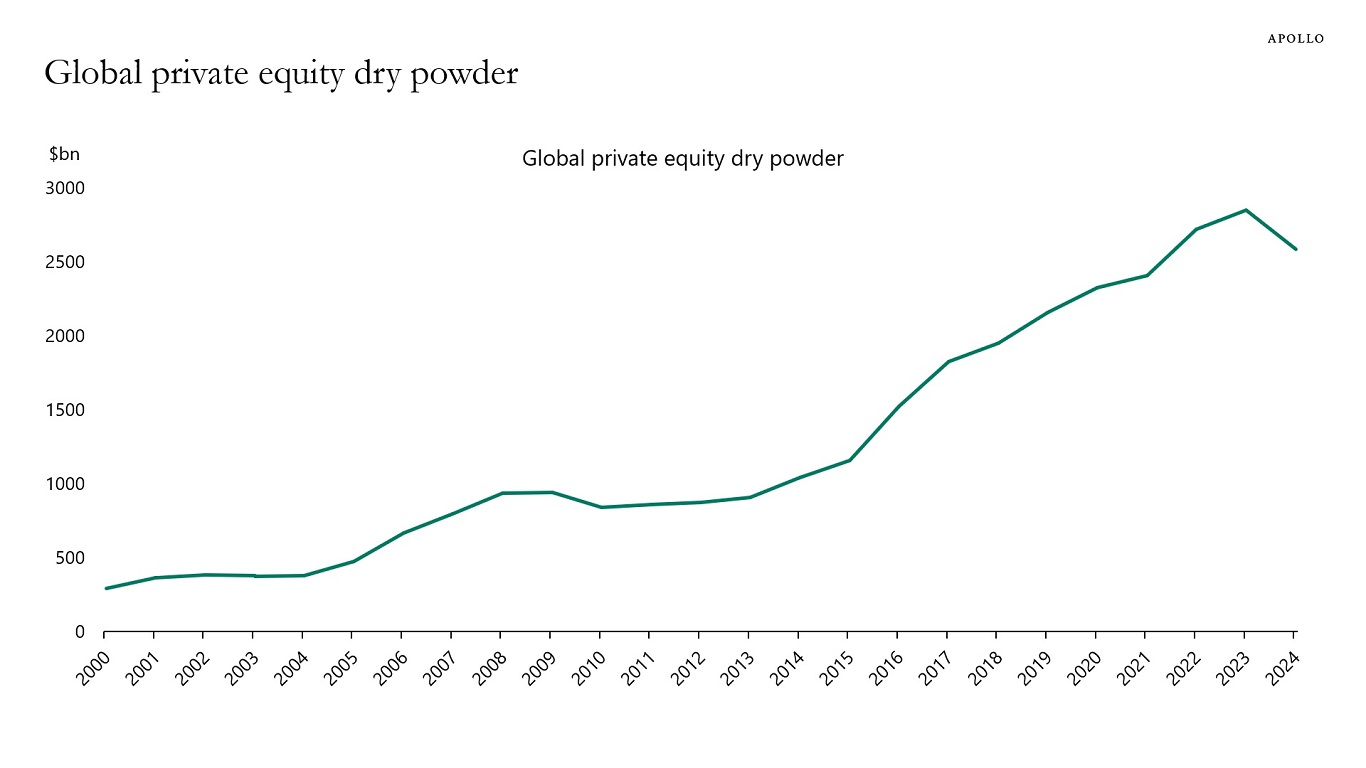
Note: Data as of November 2024. Source: Preqin, Apollo Chief Economist See important disclaimers at the bottom of the page.
-
Gas prices at the pump continue to decline, which is another tailwind to consumer spending, see chart below. The decline in oil prices is driven by significant supply and production in the US and lower growth in China.
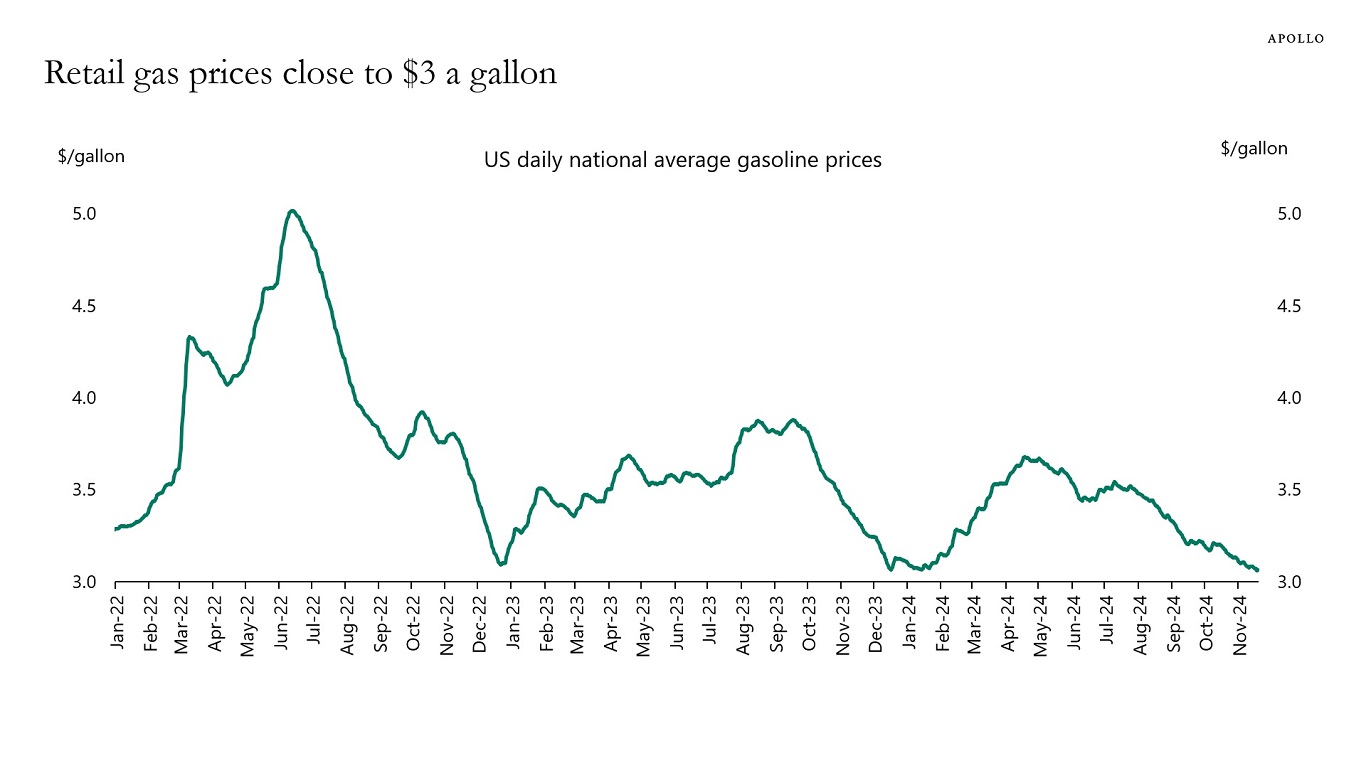
Source: AMA, Bloomberg, Apollo Chief Economist See important disclaimers at the bottom of the page.
-
Total CO2 emissions from fossil fuels and industry in China are more than double the CO2 emissions in the US, see chart below, and six times bigger than CO2 emissions in Europe.
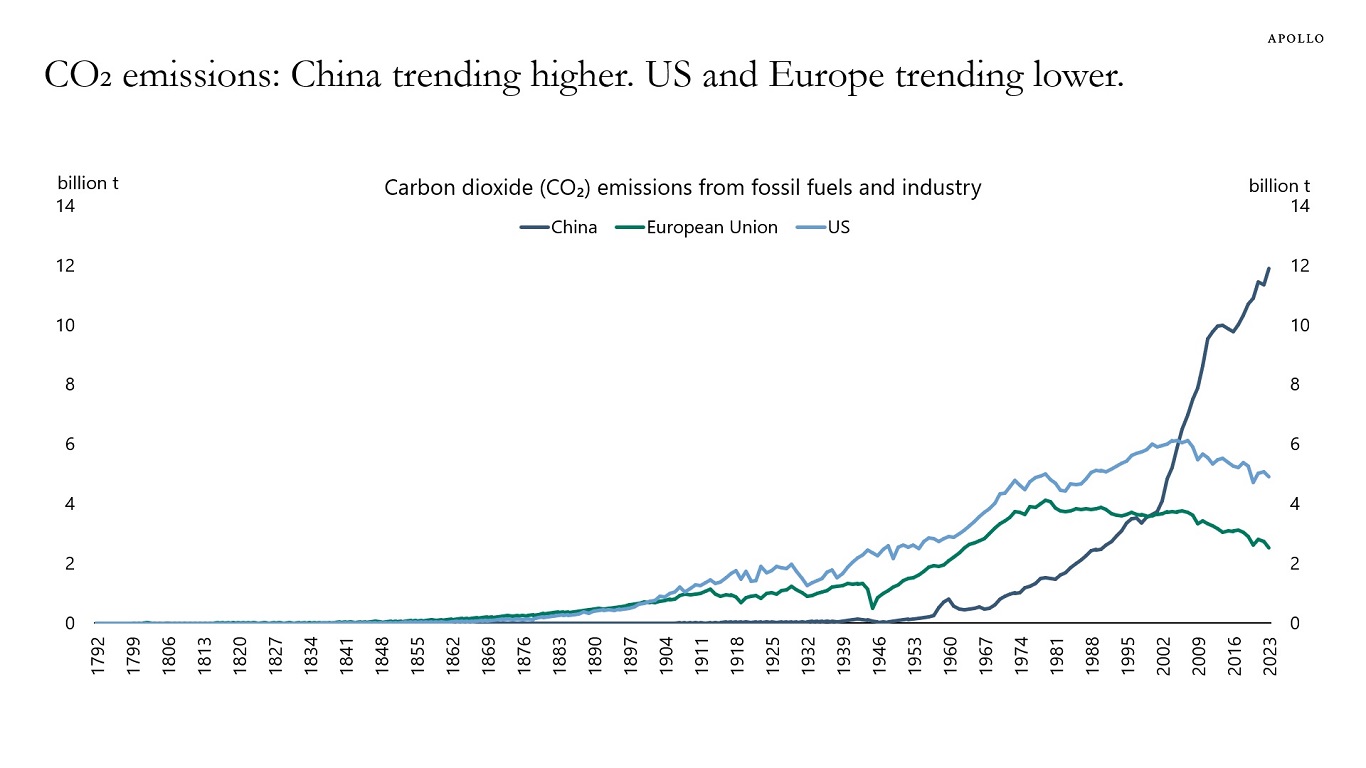
Note: t = metric tons. Source: OurWorldinData.org, Global Carbon Budget (2024), Apollo Chief Economist See important disclaimers at the bottom of the page.

This presentation may not be distributed, transmitted or otherwise communicated to others in whole or in part without the express consent of Apollo Global Management, Inc. (together with its subsidiaries, “Apollo”).
Apollo makes no representation or warranty, expressed or implied, with respect to the accuracy, reasonableness, or completeness of any of the statements made during this presentation, including, but not limited to, statements obtained from third parties. Opinions, estimates and projections constitute the current judgment of the speaker as of the date indicated. They do not necessarily reflect the views and opinions of Apollo and are subject to change at any time without notice. Apollo does not have any responsibility to update this presentation to account for such changes. There can be no assurance that any trends discussed during this presentation will continue.
Statements made throughout this presentation are not intended to provide, and should not be relied upon for, accounting, legal or tax advice and do not constitute an investment recommendation or investment advice. Investors should make an independent investigation of the information discussed during this presentation, including consulting their tax, legal, accounting or other advisors about such information. Apollo does not act for you and is not responsible for providing you with the protections afforded to its clients. This presentation does not constitute an offer to sell, or the solicitation of an offer to buy, any security, product or service, including interest in any investment product or fund or account managed or advised by Apollo.
Certain statements made throughout this presentation may be “forward-looking” in nature. Due to various risks and uncertainties, actual events or results may differ materially from those reflected or contemplated in such forward-looking information. As such, undue reliance should not be placed on such statements. Forward-looking statements may be identified by the use of terminology including, but not limited to, “may”, “will”, “should”, “expect”, “anticipate”, “target”, “project”, “estimate”, “intend”, “continue” or “believe” or the negatives thereof or other variations thereon or comparable terminology.