Want it delivered daily to your inbox?
-
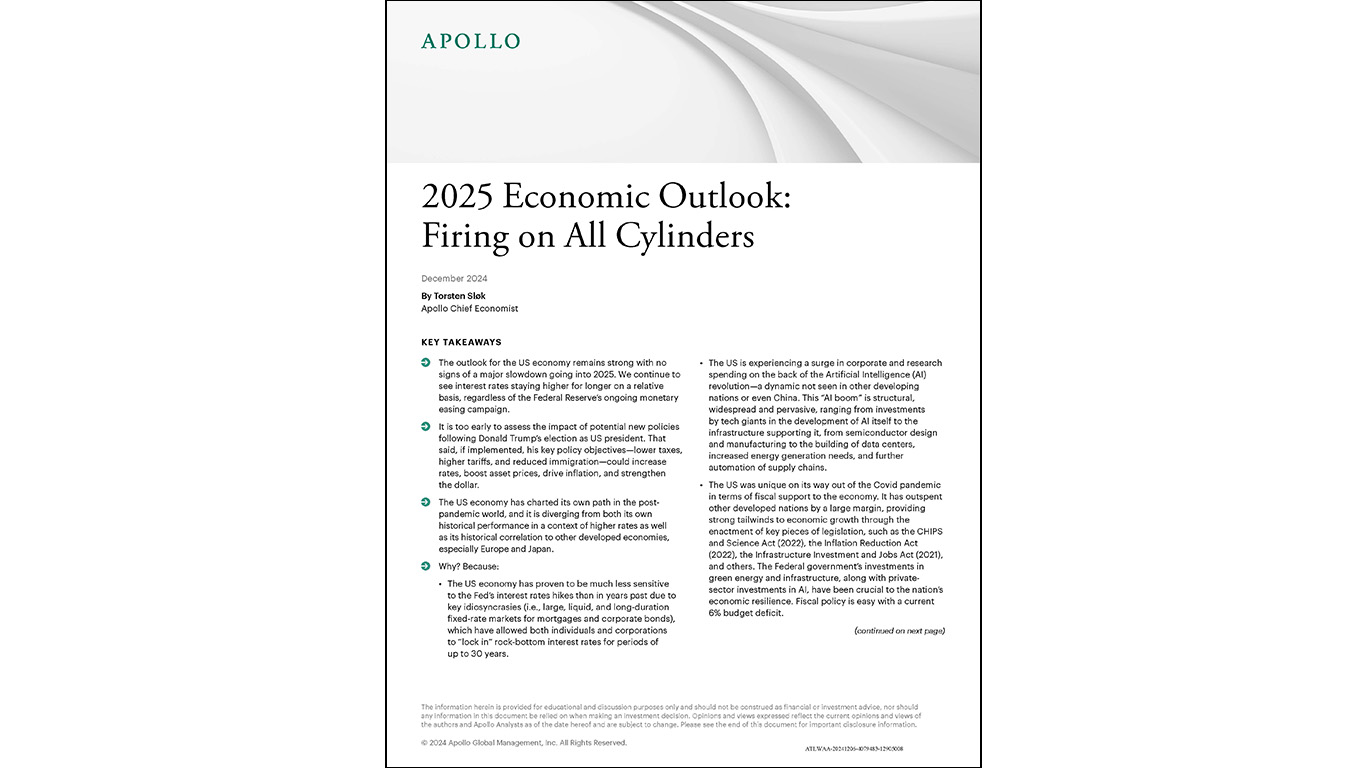
The US economy remains strong with no signs of a major slowdown going into 2025. We see interest rates staying higher for longer on a relative basis (regardless of the Fed’s easing campaign) as inflation remains above target, employment strong, and spending robust.
We have published our consolidated views in my newest white paper, 2025 Economic Outlook: Firing on All Cylinders. You can download it here.
I will also be discussing the contents of the paper and my views in detail in an Apollo Academy class today at 11:00 ET (eligible for a CE credit). Register here. The class will be available on demand afterward.
See important disclaimers at the bottom of the page.
-
Comparing returns across different types of fixed income shows that private credit has been outperforming other strategies, see chart below.
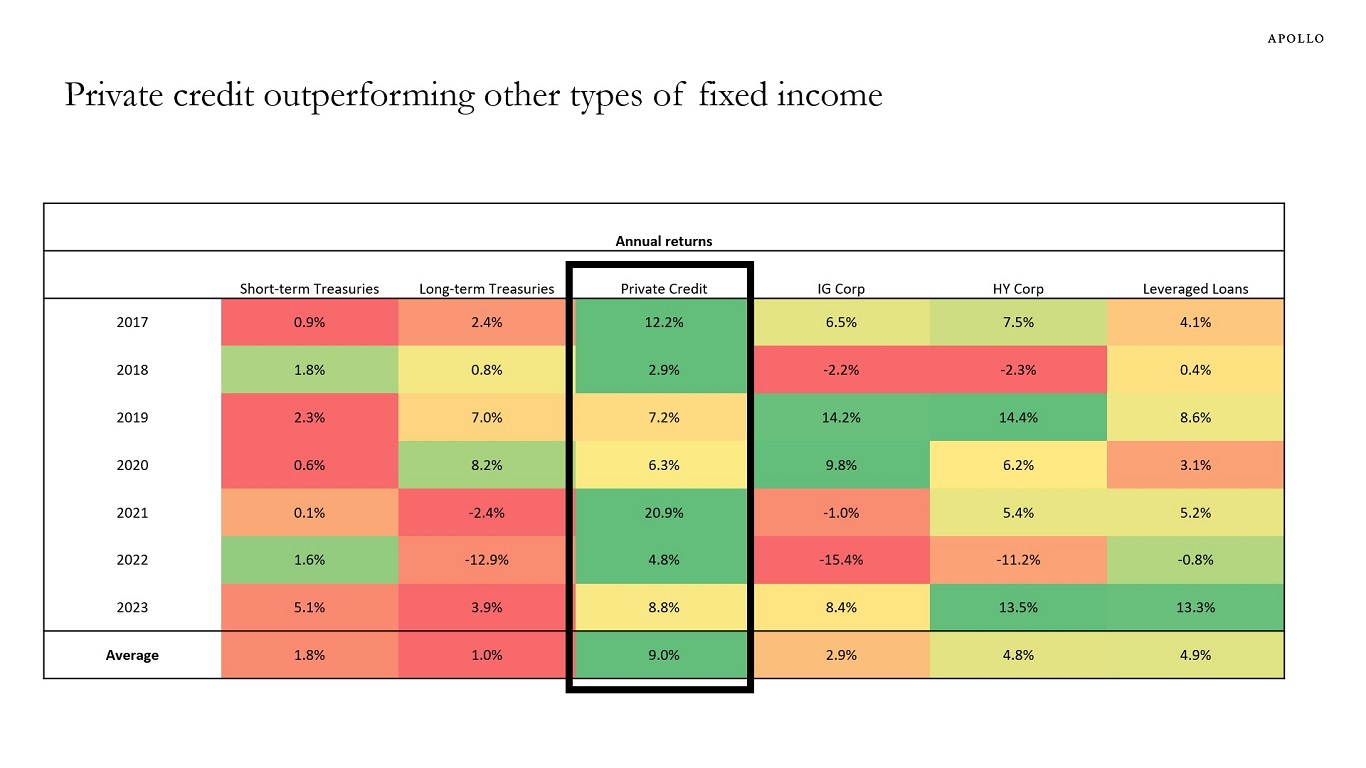
Note: Indices used: ICE BofA indices for US IG Corporate, US HY Corporate, and Treasuries, Morningstar LSTA US Leveraged Loan for leveraged loans, and private credit from Preqin. Source: Bloomberg, Preqin, ICE BofA, Apollo Chief Economist See important disclaimers at the bottom of the page.
-
The stock market in France is significantly underperforming the stock markets in Germany and the US, see chart below.
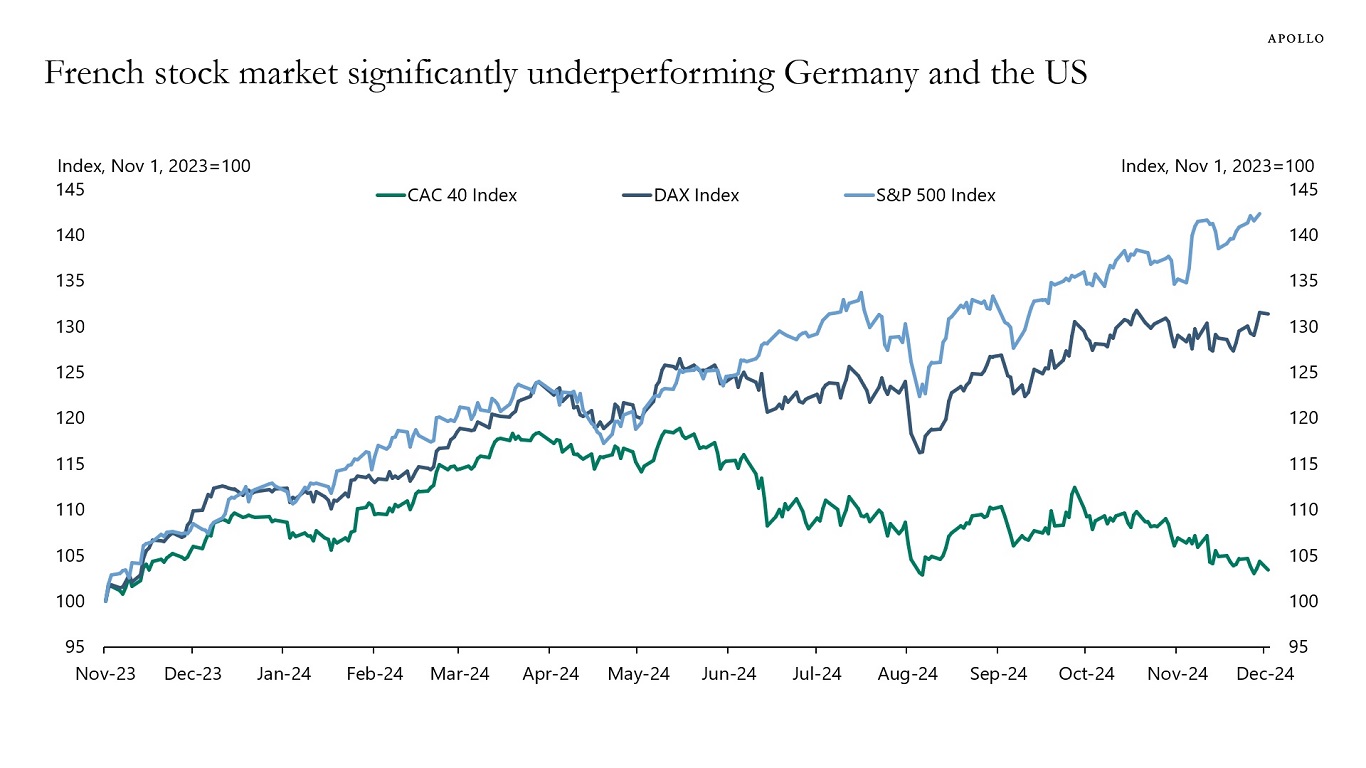
Source: Bloomberg, Apollo Chief Economist See important disclaimers at the bottom of the page.
-
Simulations on the Penn Wharton Budget Model show that, over a 30-year period, it is possible to generate a 38% reduction in federal debt, push GDP higher by 21%, reduce health insurance premiums by 27%, and produce almost universal health insurance enrollment.
What is required to achieve these results is boosting capital, labor, and productivity, while reducing regulation and providing incentives for growth.
Specifically, key policy changes:
– Tax system: Tax capital gains and dividends at ordinary rates and reduce tax rates to 28% versus 37% by eliminating most deductions. At this lower rate, ordinary/capital distinctions no longer matter.
– Entitlements: Protect those 50 and over but raise the full-benefit Social Security retirement age from 67 to 70, raise the Medicare eligibility age from 65 to 67, and convert Medicare to premium support.
– Immigration: Broad-based reform that requires new immigrants to pay taxes and purchase health insurance without government subsidy.
For more details see here.
See important disclaimers at the bottom of the page.
-
Annuity sales are almost double their pre-pandemic levels because of higher interest rates. And strong annuity sales create strong demand for credit, see chart below.
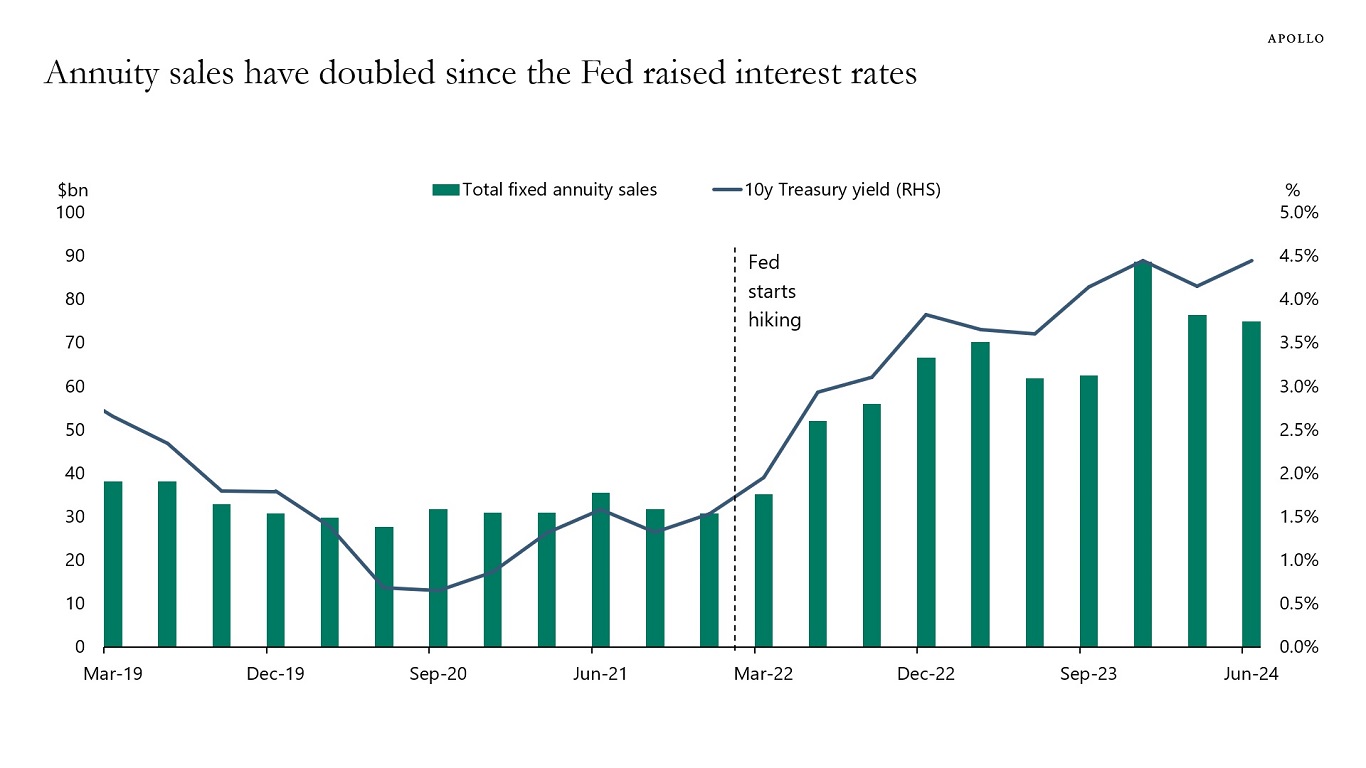
Source: Bloomberg, Apollo Chief Economist See important disclaimers at the bottom of the page.
-
GDP growth in the third quarter came in at 2.8%, and the Atlanta Fed estimates GDP growth in the fourth quarter will be 3.3%, well above the CBO’s 2% estimate of long-run growth in the US, see the first chart below. In other words, momentum in the economy is strong, and the incoming administration may add additional tailwinds to the outlook.
Combined with the recent uptrend in inflation, the probability is rising that the Fed may have to raise interest rates in 2025, see the second chart.
In other words, a repeat of what we saw in the mid-1990s, where the Fed, after a few cuts, started raising interest rates again. Our weekly chart book with high-frequency indicators for the US economy is available here.
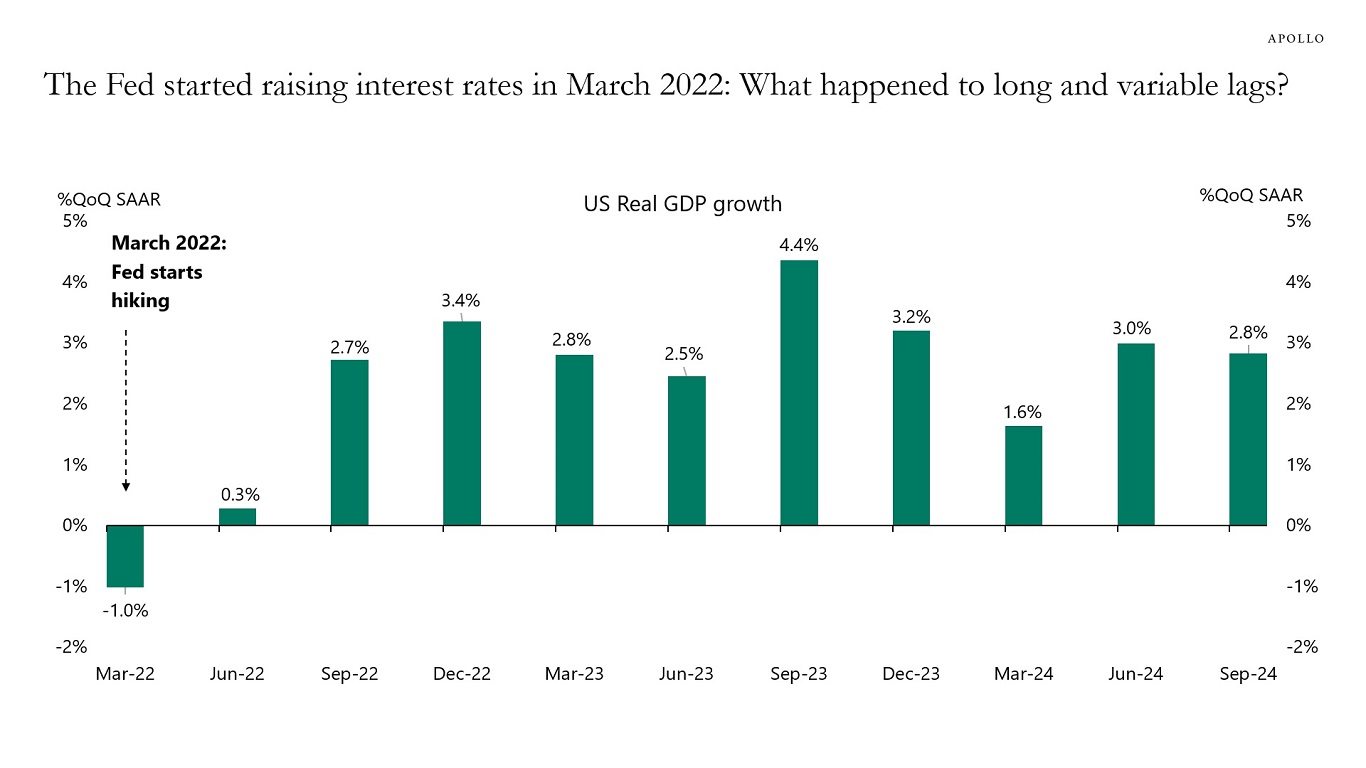
Source: BEA, Haver Analytics, Apollo Chief Economist 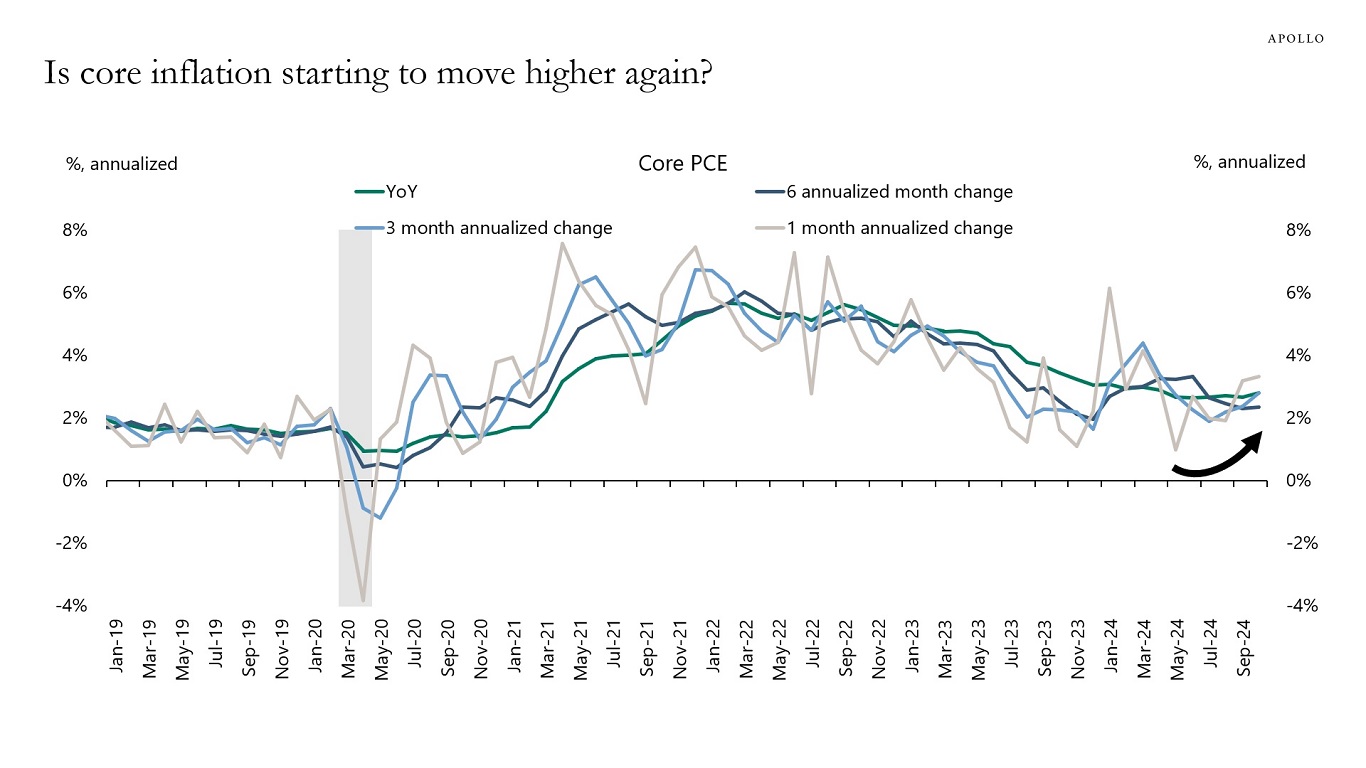
Source: BEA, Haver Analytics, Apollo Chief Economist See important disclaimers at the bottom of the page.
-
The Plaza Accord was a meeting held in September 1985 at the Plaza Hotel, where the G7 countries agreed to intervene in FX markets to depreciate the US dollar, see chart below. We will not see a repeat of the Plaza Accord today for two reasons. First, the dollar is far from the levels of appreciation seen in the mid-1980s. Second, the economic outlook for Europe, the UK, Canada, and Australia is weak, and the rest of the G7 wants to continue to depreciate their exchange rates to boost their exports.
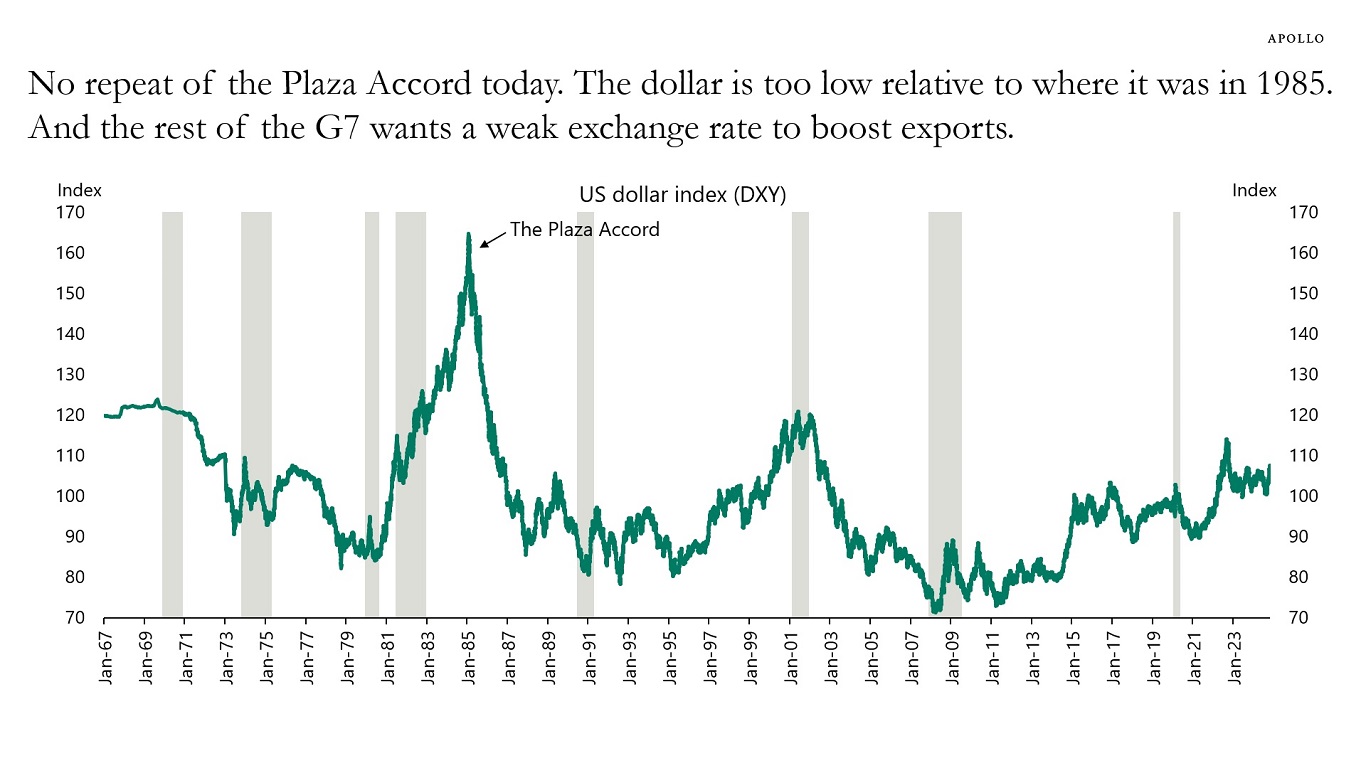
Source: Bloomberg, Apollo Chief Economist See important disclaimers at the bottom of the page.
-
A new industrial renaissance has started, driven by industrial policies, see charts below and our chart book available here.
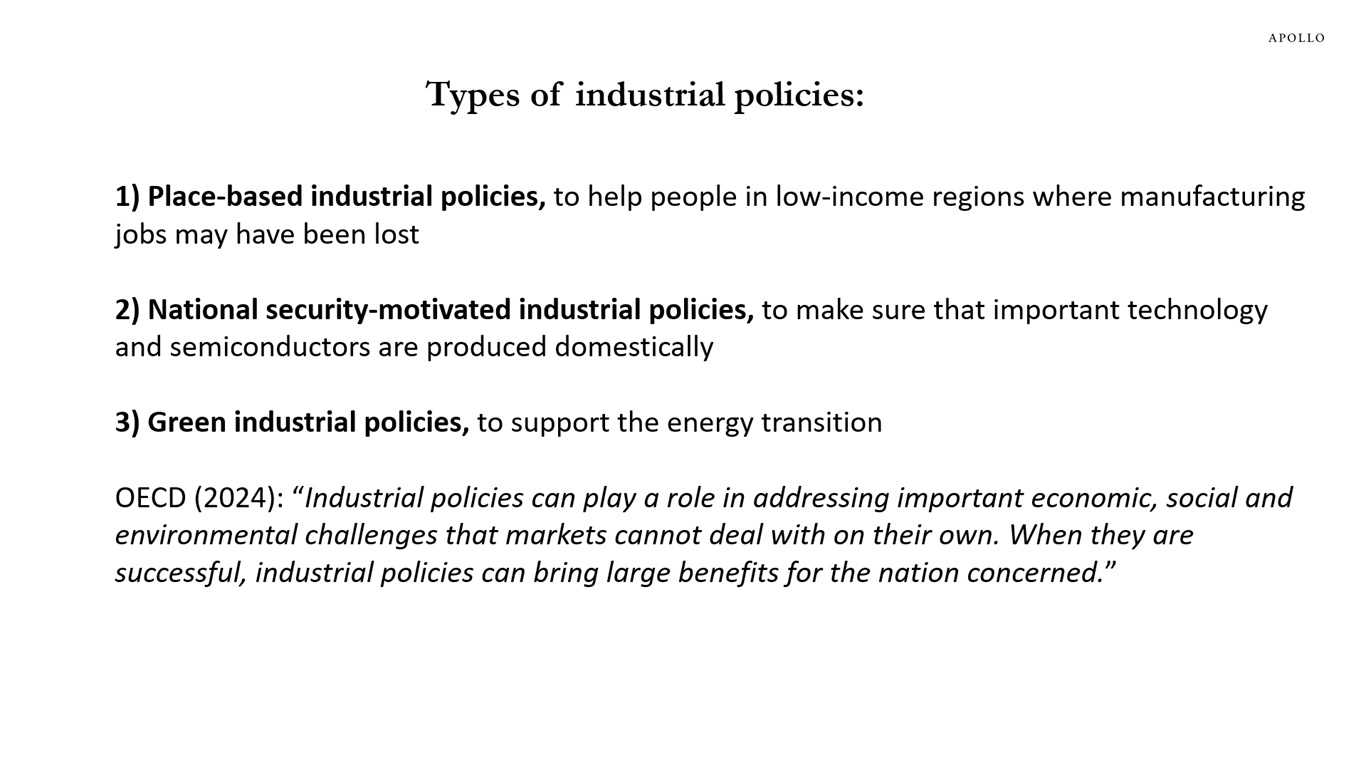
Source: Apollo Chief Economist, OECD 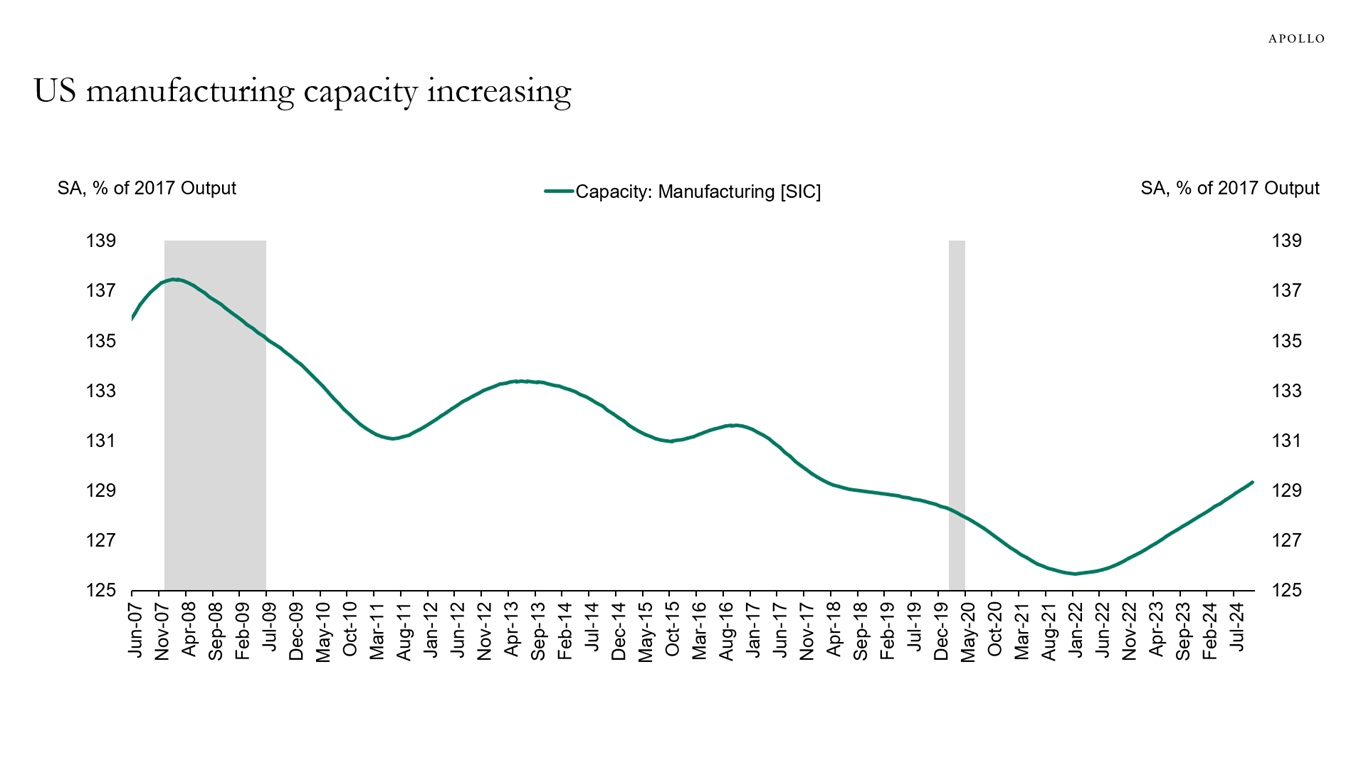
Note: SIC = Standard Industrial Classification. Source: Federal Reserve Board, National Bureau of Economic Research, Haver Analytics, Apollo Chief Economist 
See important disclaimers at the bottom of the page.
-
In the United States, 95% of mortgages are 30-year fixed rate, and mortgage debt makes up a smaller share of household debt for lower-income groups, which means that lower-income groups are more vulnerable to Fed hikes and interest rates staying higher for longer, see chart below.
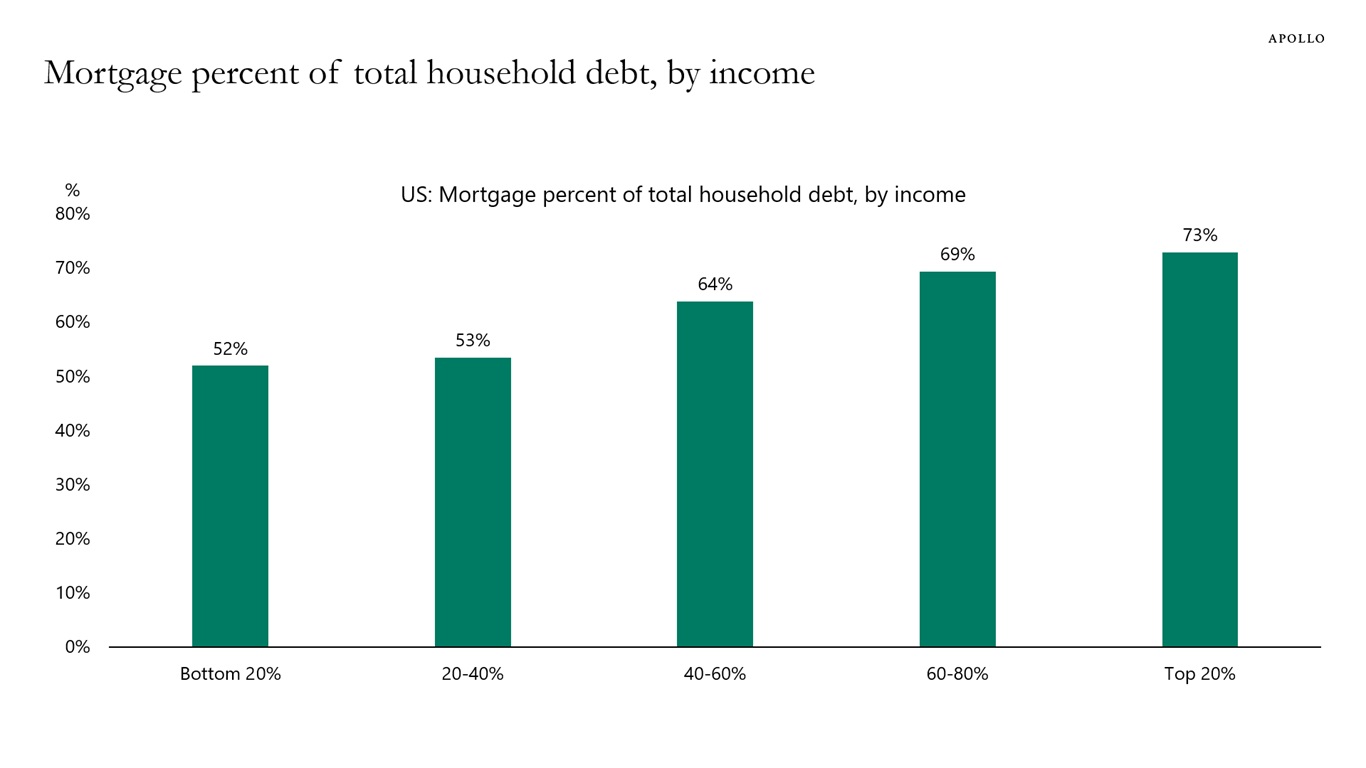
Note: Data for 2024 Q2. Source: Federal Reserve, Apollo Chief Economist See important disclaimers at the bottom of the page.
-
In the United States, 73 million people receive social security benefits, see the first chart below.
Social security spending and Medicare and healthcare spending make up half of the total $6.75 trillion in federal spending, see the second chart below.
In addition, for the fiscal year 2024, the government spent more money on debt servicing costs than on Medicare and on defense, see again the second chart.
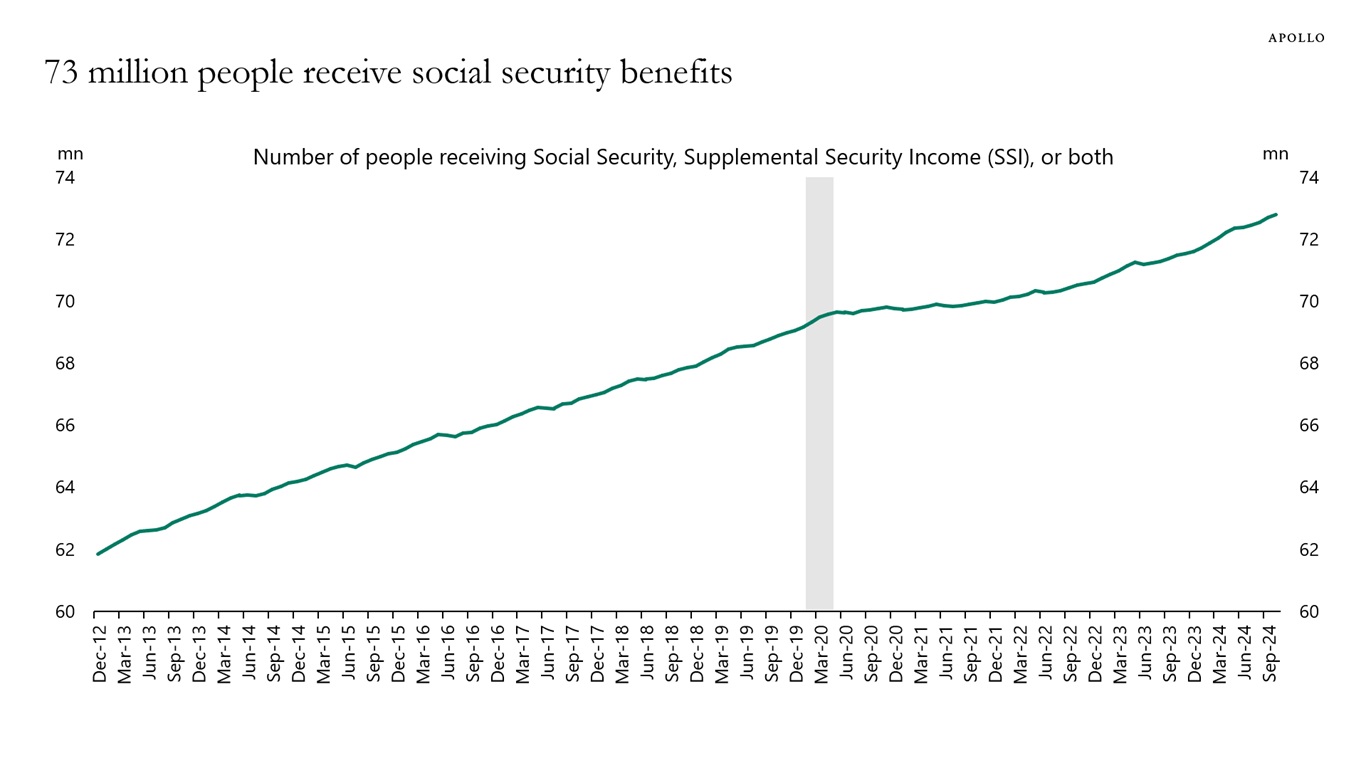
Note: Social Security beneficiaries who are entitled to a primary and a secondary benefit (dual entitlement) are counted only once. SSI counts include recipients of federal SSI, federally administered state supplementation, or both. Source: Social Security Administration, Master Beneficiary Record and Supplemental Security Record, Apollo Chief Economist 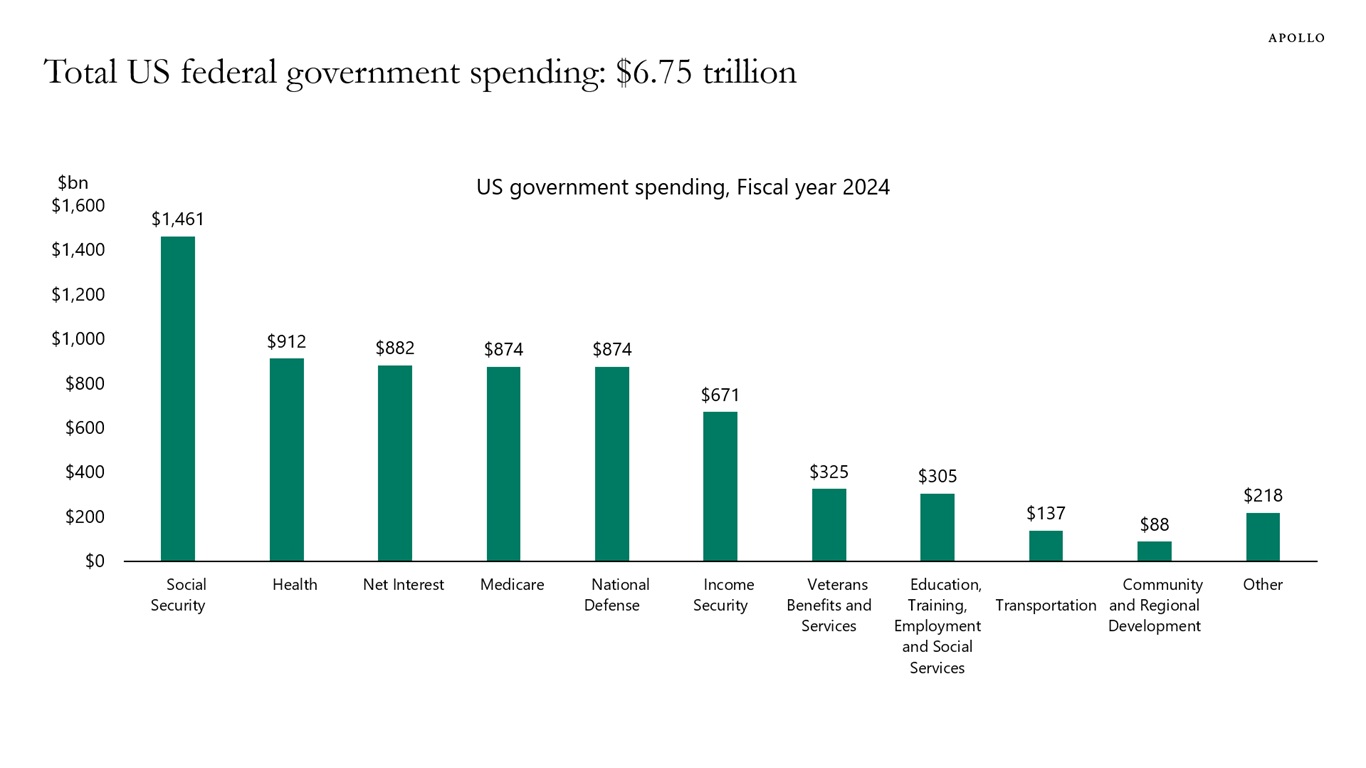
Source: US Treasury, Bloomberg, Apollo Chief Economist See important disclaimers at the bottom of the page.
This presentation may not be distributed, transmitted or otherwise communicated to others in whole or in part without the express consent of Apollo Global Management, Inc. (together with its subsidiaries, “Apollo”).
Apollo makes no representation or warranty, expressed or implied, with respect to the accuracy, reasonableness, or completeness of any of the statements made during this presentation, including, but not limited to, statements obtained from third parties. Opinions, estimates and projections constitute the current judgment of the speaker as of the date indicated. They do not necessarily reflect the views and opinions of Apollo and are subject to change at any time without notice. Apollo does not have any responsibility to update this presentation to account for such changes. There can be no assurance that any trends discussed during this presentation will continue.
Statements made throughout this presentation are not intended to provide, and should not be relied upon for, accounting, legal or tax advice and do not constitute an investment recommendation or investment advice. Investors should make an independent investigation of the information discussed during this presentation, including consulting their tax, legal, accounting or other advisors about such information. Apollo does not act for you and is not responsible for providing you with the protections afforded to its clients. This presentation does not constitute an offer to sell, or the solicitation of an offer to buy, any security, product or service, including interest in any investment product or fund or account managed or advised by Apollo.
Certain statements made throughout this presentation may be “forward-looking” in nature. Due to various risks and uncertainties, actual events or results may differ materially from those reflected or contemplated in such forward-looking information. As such, undue reliance should not be placed on such statements. Forward-looking statements may be identified by the use of terminology including, but not limited to, “may”, “will”, “should”, “expect”, “anticipate”, “target”, “project”, “estimate”, “intend”, “continue” or “believe” or the negatives thereof or other variations thereon or comparable terminology.


