


Want it delivered daily to your inbox?
-
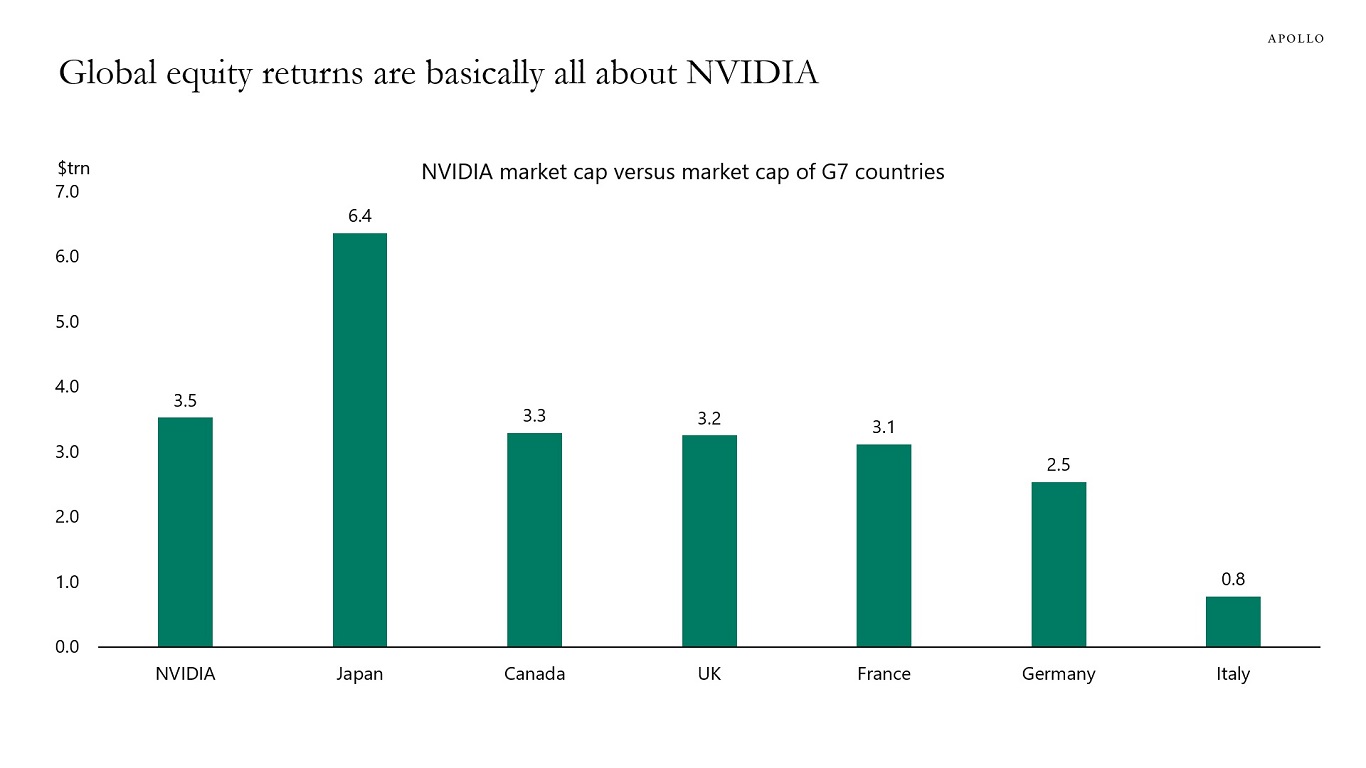
NVIDIA is now bigger than the total market cap of five of the G7 countries, see chart below. And foreigners own 18% of the US stock market.
The bottom line is that global equity markets, including retirement allocations to equities, are basically leveraged to NVIDIA.
Let’s hope the value of NVIDIA doesn’t decline significantly.
The idea that public markets are safe and retirement savings in public markets are safe is misguided.
Some investments in public markets are safe, and some are risky.
Same for private assets. Some private investments are safe, and some private investments are risky.
Source: Bloomberg, Apollo Chief Economist See important disclaimers at the bottom of the page.
-
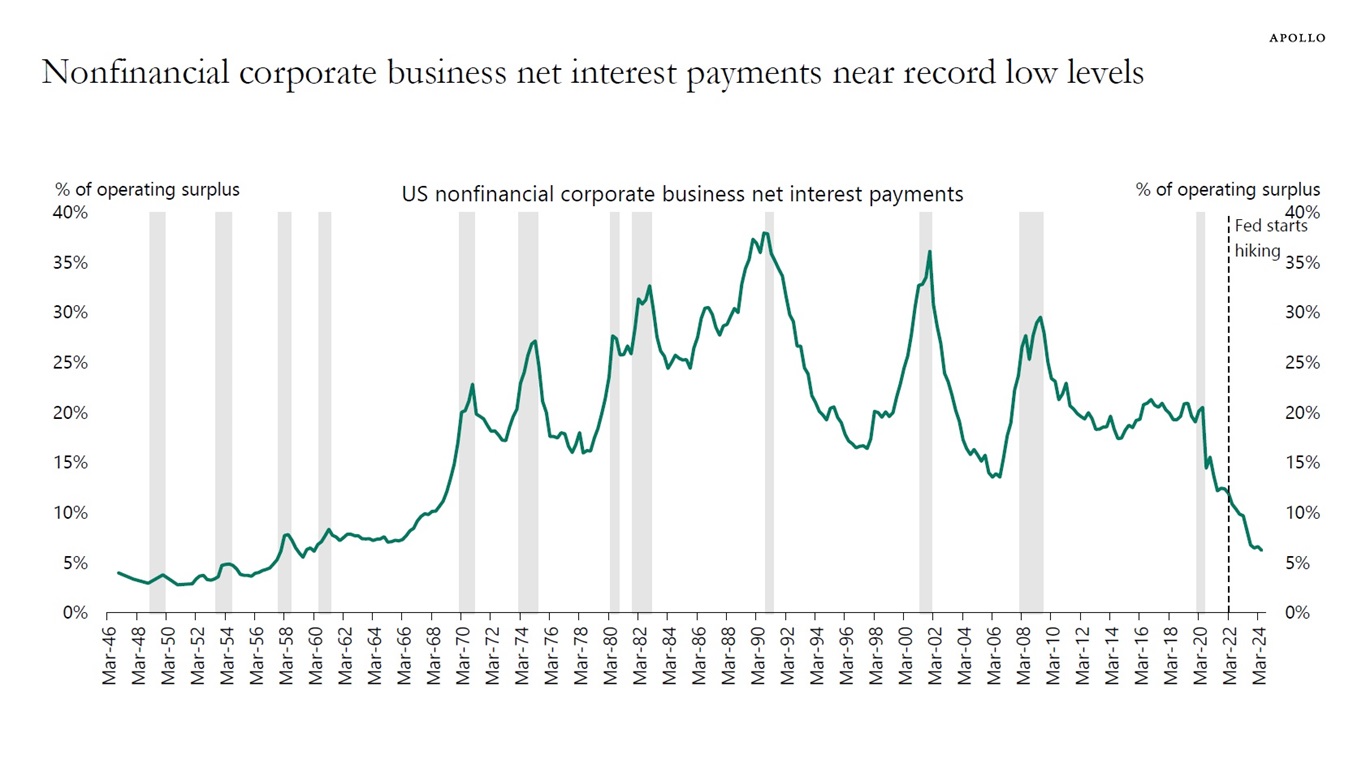
The chart below shows that Fed hikes have not had the desired effects on firms. You would normally expect that when interest rates go up, corporates see an increase in debt-servicing costs.
But because of locked-in low interest rates combined with strong corporate earnings, net interest payments as a share of operating surplus have been going down, see chart below.
The bottom line is that not only have Fed hikes had a limited negative impact on consumers because of locked-in low mortgage rates. Fed hikes have also had a very small impact on corporates because of locked-in low interest rates and rising earnings.
In short, the transmission mechanism of monetary policy has been much weaker than the economics textbook would have predicted. This is because consumers and firms locked in low interest rates during the pandemic.
As a result, the economy never slowed down when the Fed raised rates. And now the Fed is cutting, boosting asset prices and growth in consumer spending and capex spending further.
To be sure, firms with weak earnings, weak revenue, and weak cash flows have been hit by Fed hikes. But the aggregate outcome seen in the chart below shows that from a macro perspective the negative effects of Fed hikes on corporates have been small.
Source: Federal Reserve Board, Haver Analytics, Apollo Chief Economist See important disclaimers at the bottom of the page.
-
When a company needs financing, it can go to a bank, public credit markets, or private credit. Having many different sources of financing available for firms is good for GDP growth, job creation, and financial stability.
Looking at the sum of bank lending to corporates plus the total value of corporate credit markets plus the total value of private credit shows that private credit only makes up 6% of total lending to corporates, see chart below.
The bottom line is that private credit will continue to grow as companies get access to a broader spectrum of financing, which will be positive for GDP growth and financial stability.
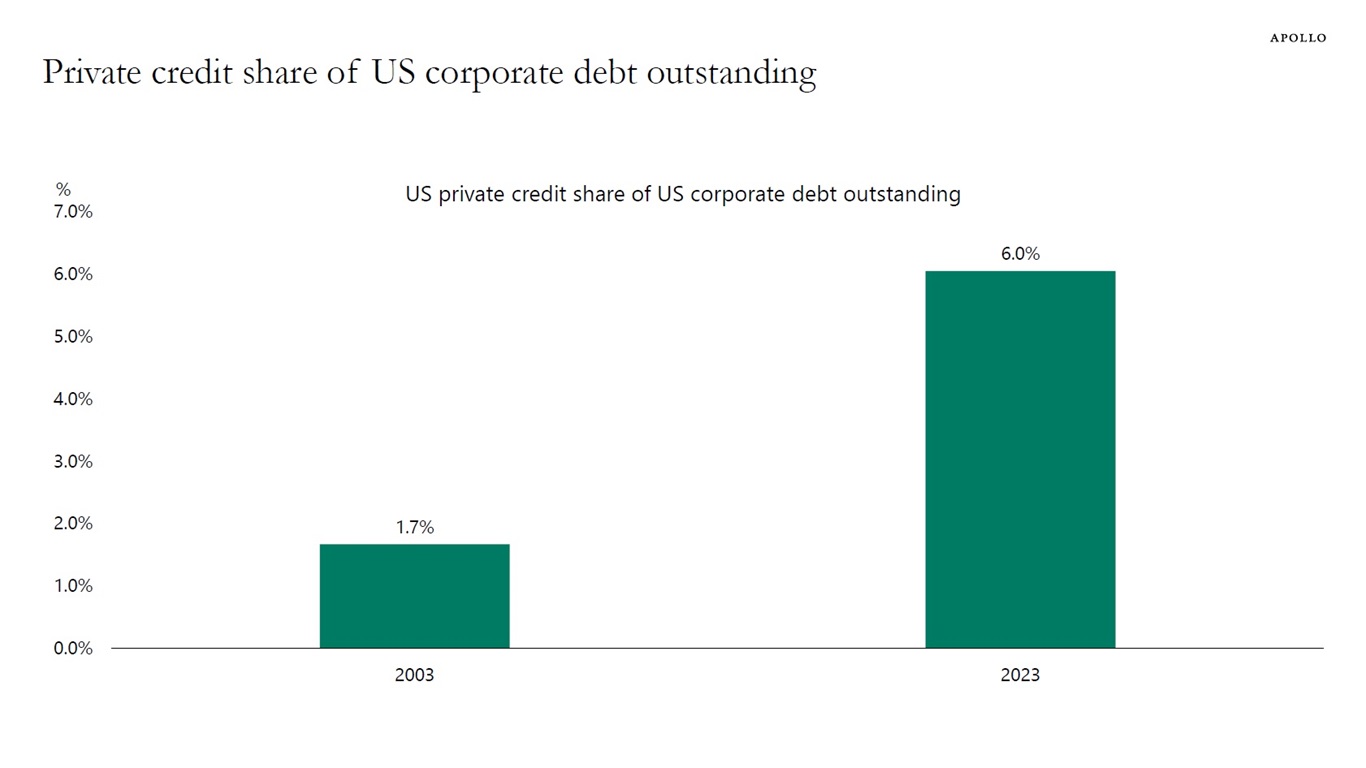
Note: US debt outstanding includes US IG and HY corporate bond market value outstanding, leveraged loans market value outstanding, US private credit AUM and US bank lending to corporates. Source: Preqin, ICE BofA, PitchBook LCD, FRB, Bloomberg, Apollo Chief Economist See important disclaimers at the bottom of the page.
-
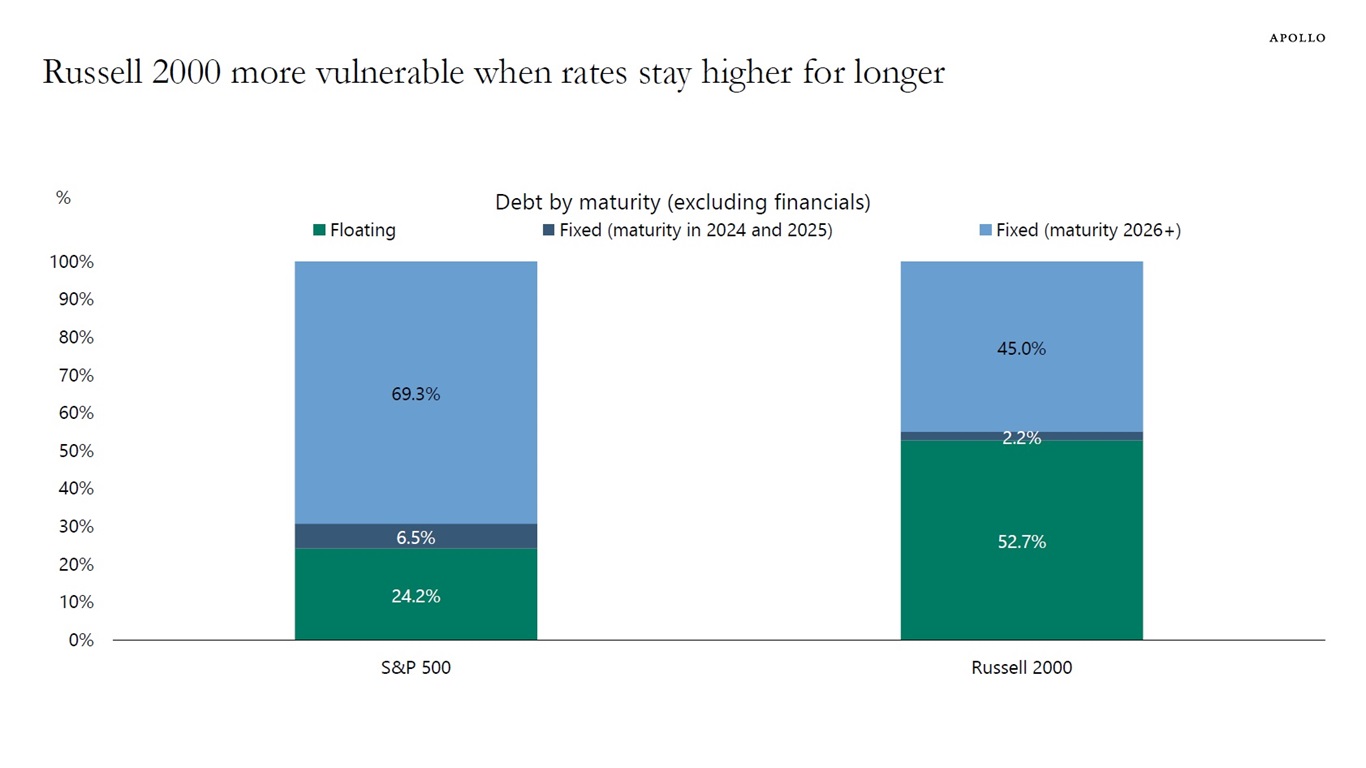
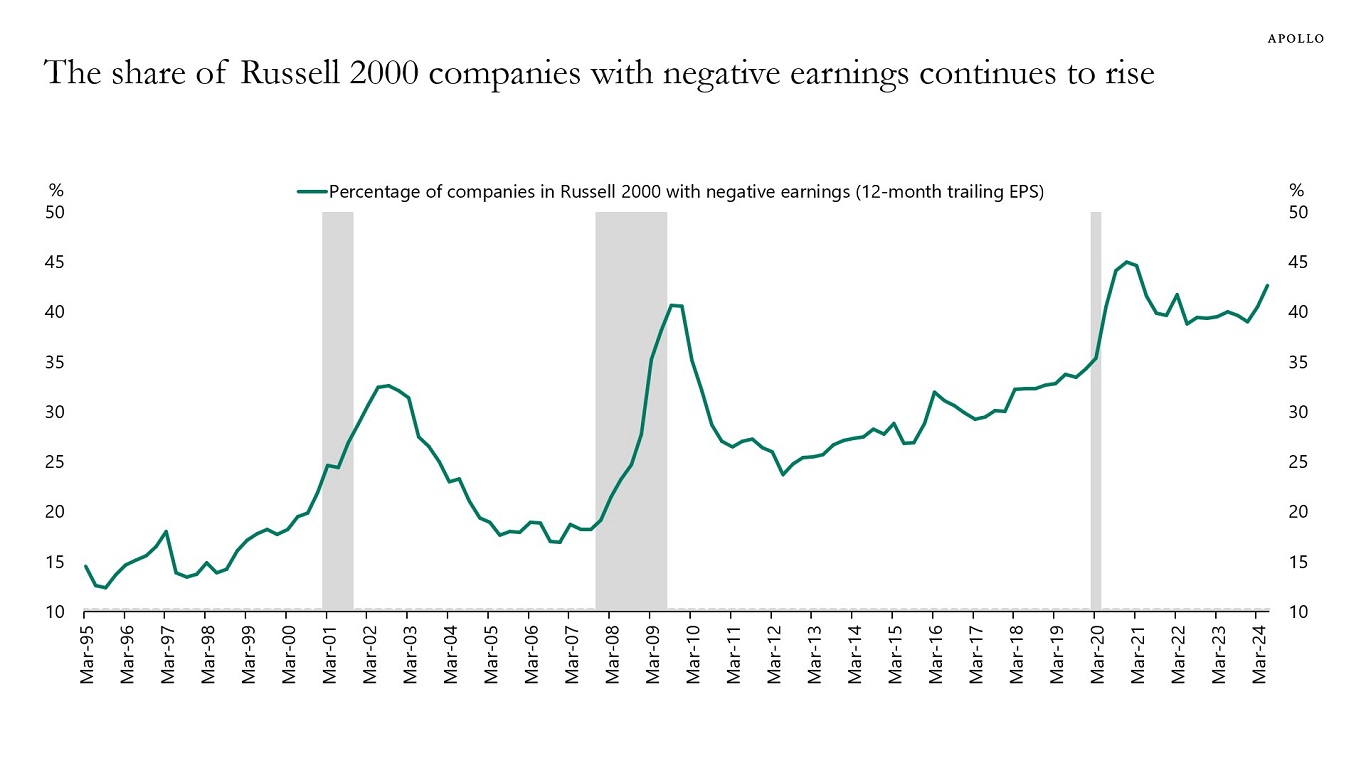
More than 50% of debt for Russell 2000 companies is floating rate. For the S&P 500, it is 24%, see chart below. With interest rates higher for longer, small-cap companies remain more vulnerable than large-cap companies.
More generally, companies and capital structures with no earnings, no revenues, and no cash flows will continue to struggle with high debt servicing costs.
The bottom line for both equity and debt investors is to invest in companies that have earnings.
Note: Includes bonds and loans (tranches) and excludes financials. Totals may not sum to exactly 100% due to rounding. Source: Bloomberg SRCH, Apollo Chief Economist See important disclaimers at the bottom of the page.
-
Our chart book discusses the outlook for India. There are many reasons to be bullish. GDP growth is strong, inflation is low, and sentiment surveys show that consumers and firms are upbeat. Household, corporate, and bank balance sheets are healthy. The financial sector has seen significant transformation with digitalization and bankruptcy law enactment. Bank lending has been solid, and the Indian stock, bond, and private markets continue to grow at a rapid pace.

Source: IMF WEO, Apollo Chief Economist 
Source: MOSPI, Haver Analytics, Apollo Chief Economist 
Source: Reserve Bank of India, Haver Analytics, Apollo Chief Economist 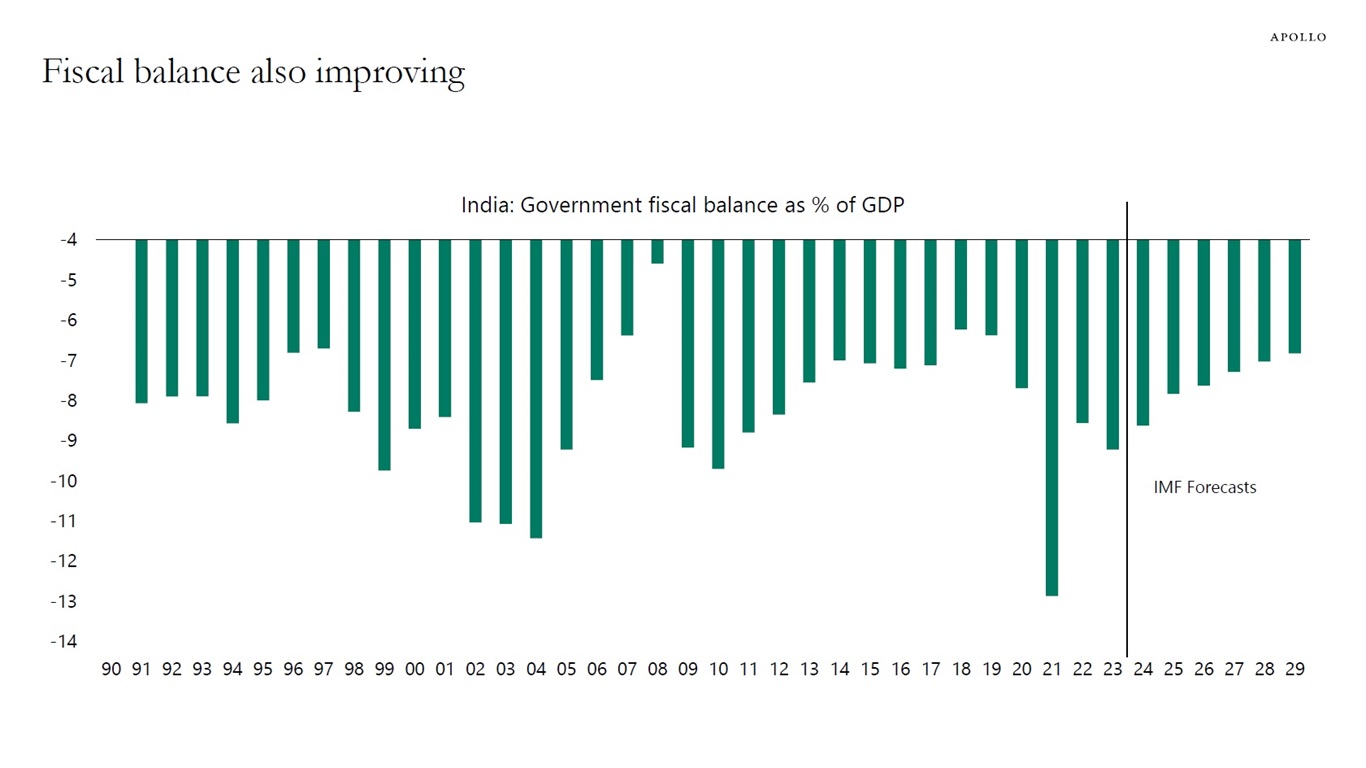
Source: IMF WEO, Haver Analytics, Apollo Chief Economist 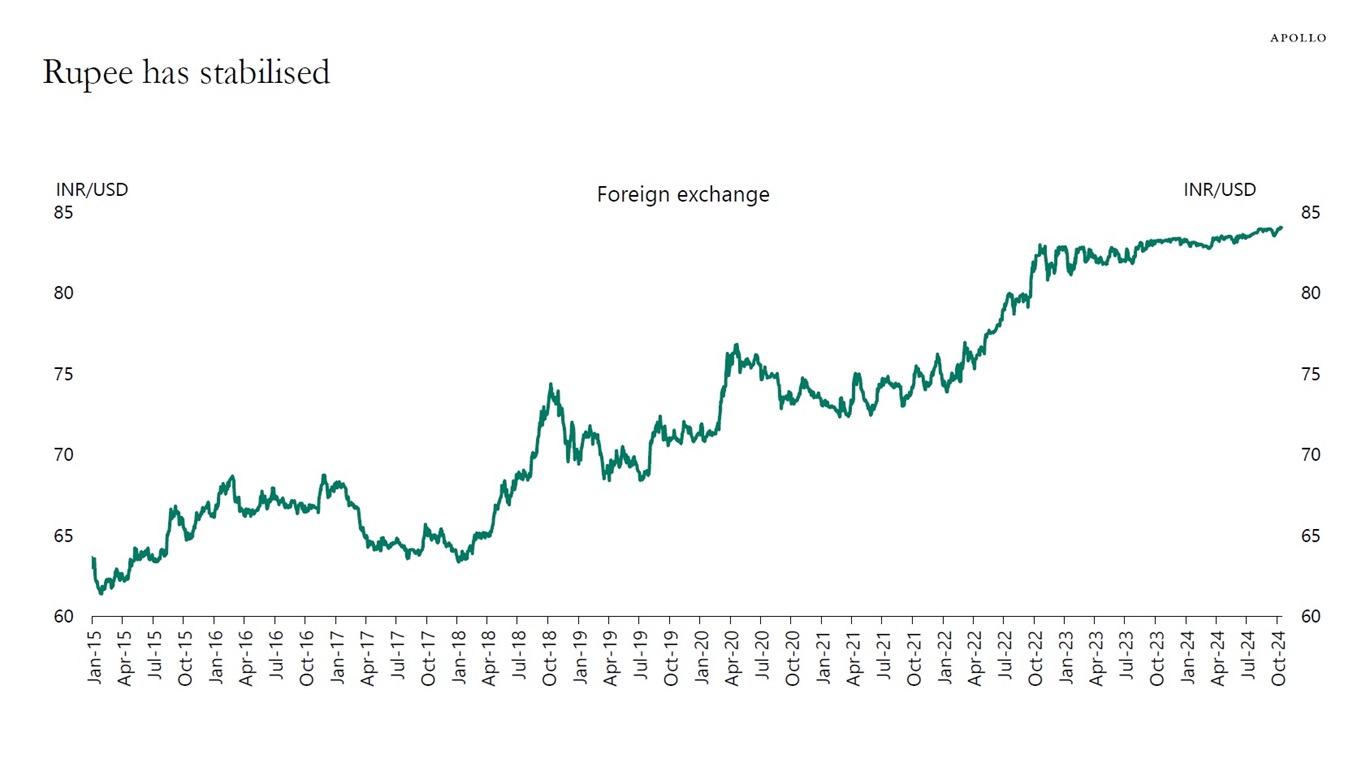
Source: Bloomberg, Apollo Chief Economist 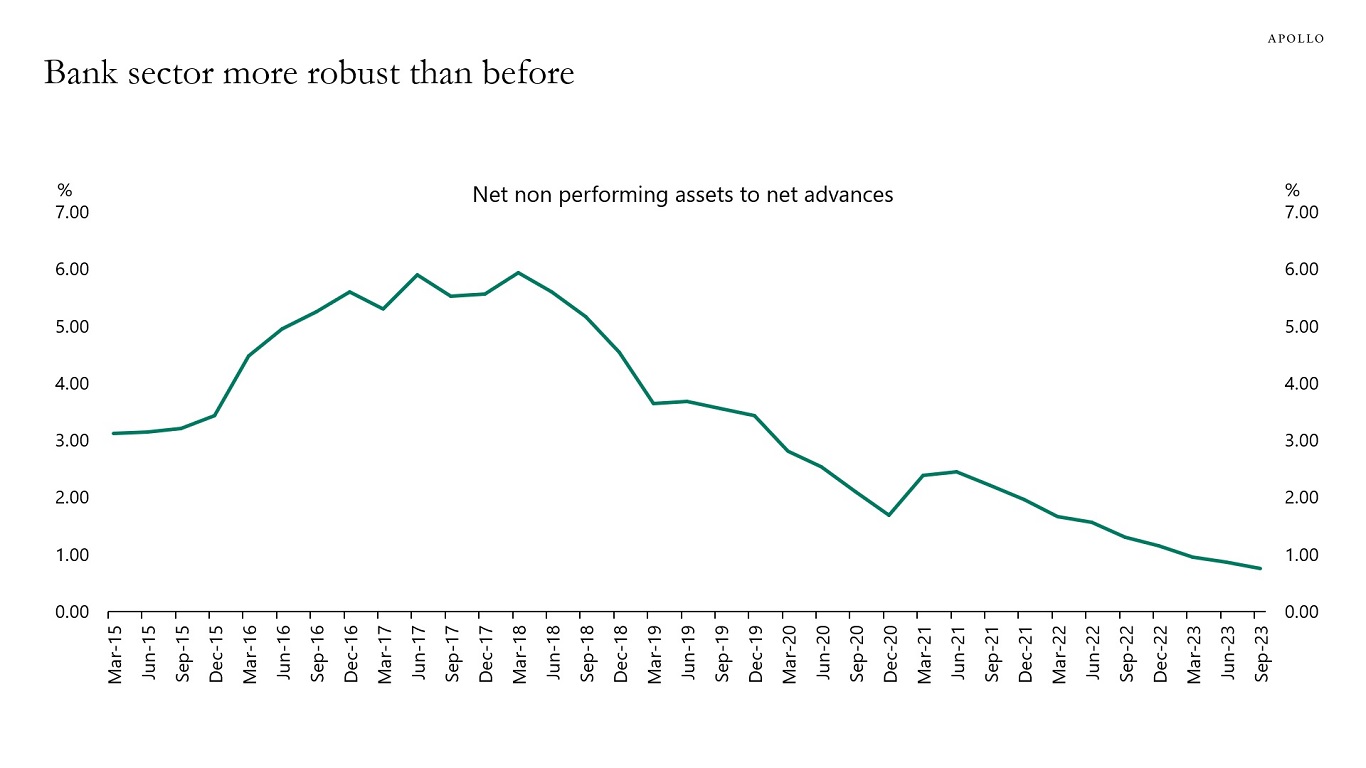
Source: RBI, Haver Analytics, Apollo Chief Economist 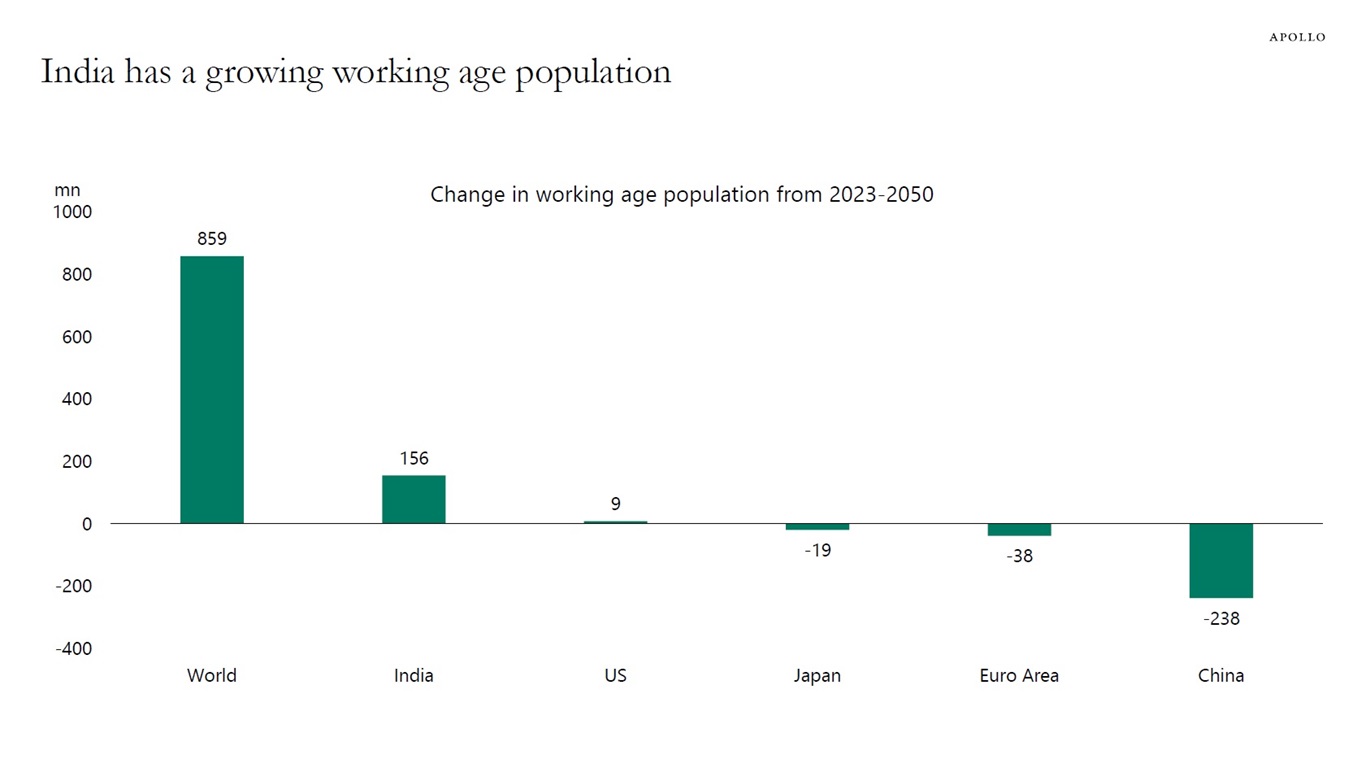
Source: UN Population Statistics, Haver Analytics, Apollo Chief Economist 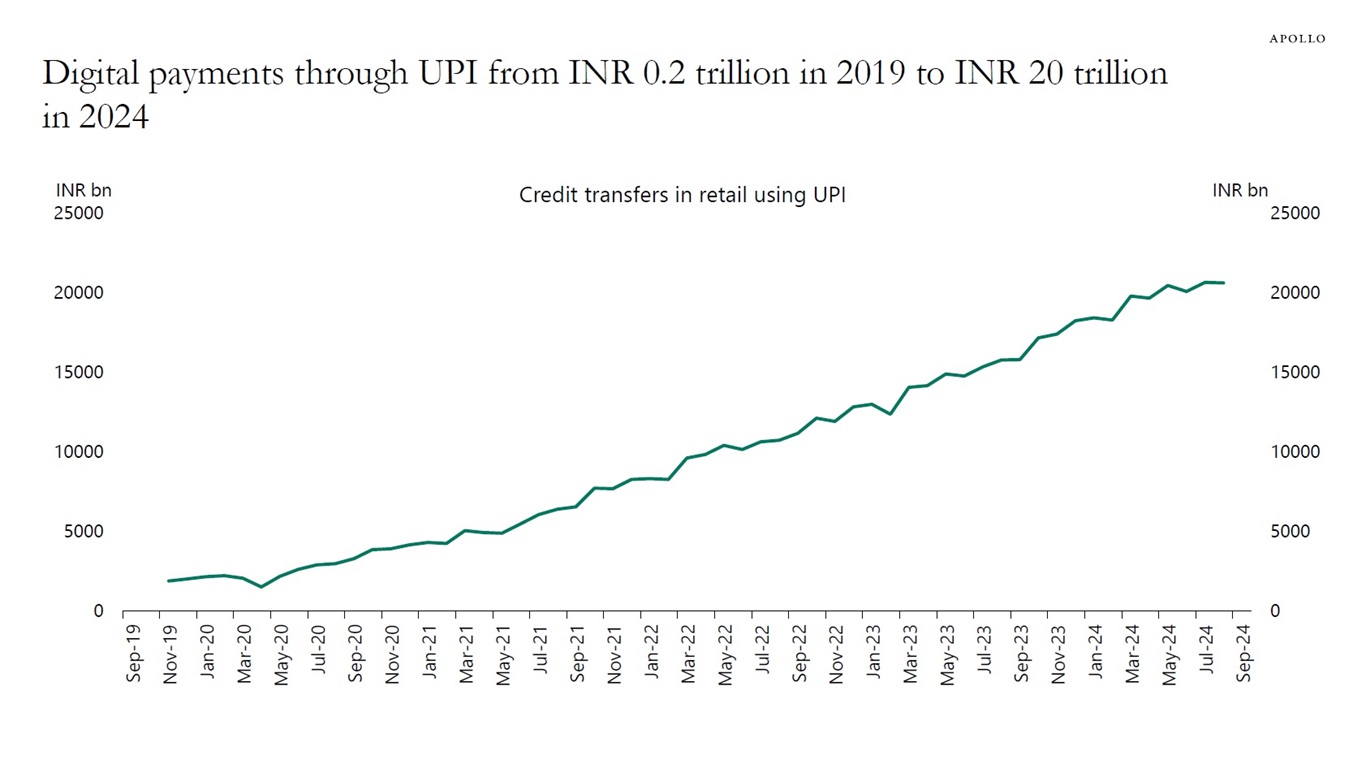
Source: RBI, Haver Analytics, Apollo Chief Economist 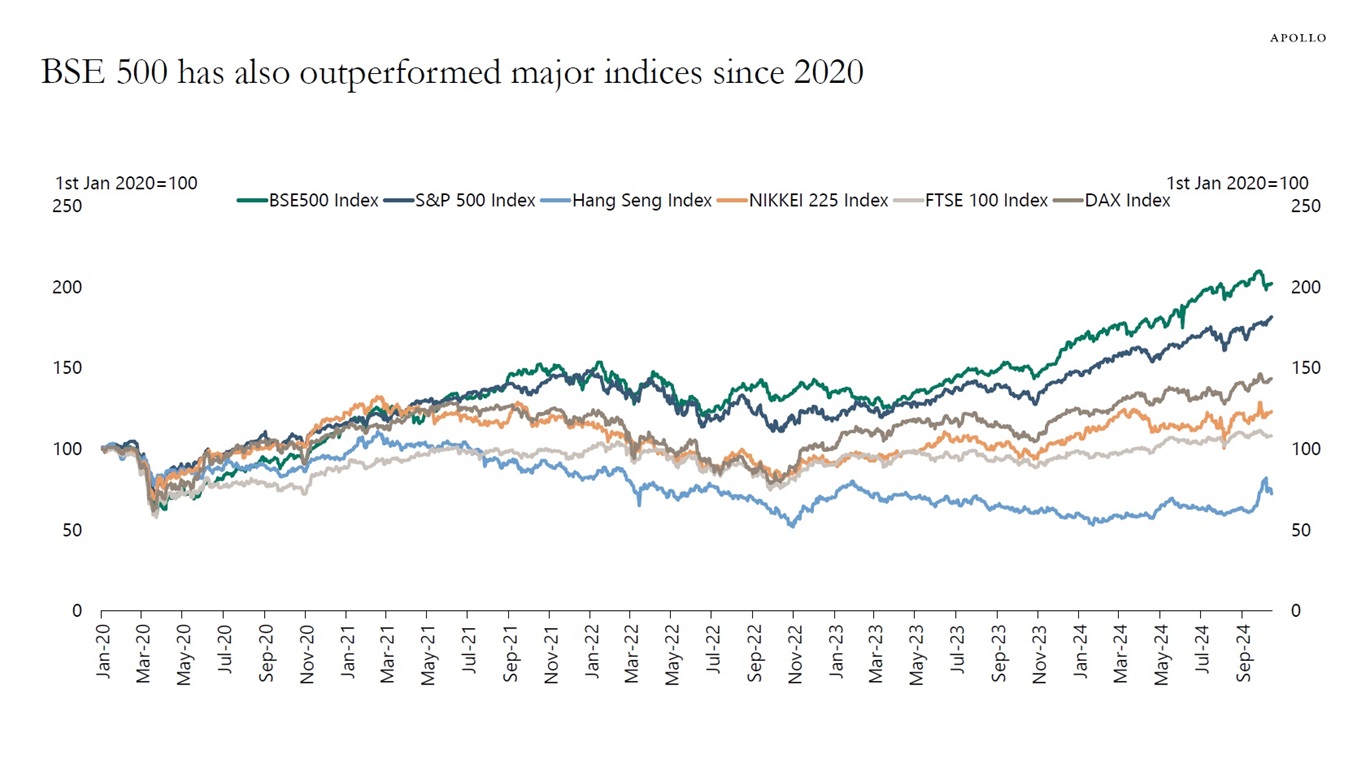
Source: Bloomberg, Apollo Chief Economist See important disclaimers at the bottom of the page.
-
This week we got data for retail sales for September and the first two weeks of October, and it shows that the US consumer continues to do well, driven by solid job growth, strong wage growth, and high stock prices and home prices, see the first two charts below.
With the Atlanta Fed GDP estimate for the third quarter currently at 3.4%, the bottom line is that the expansion continues, see the third chart.
Why is the incoming data so strong? Because the list of tailwinds to the economy keeps growing:
1) A dovish Fed
2) High stock prices, high home prices, and tight credit spreads
3) Public and private financing markets are wide open
4) Continued support to growth from the CHIPS Act, the IRA, the Infrastructure Act, and defense spending
5) Low debt-servicing costs for consumers with locked-in low interest rates
6) Low debt-servicing costs for firms with locked-in low interest rates
7) Geopolitical risks easing
8) US election uncertainty will soon be behind us
9) Continued strong spending on AI, data centers, and energy transition
10) Signs of a rebound in construction order books after the September Fed cut
These 10 tailwinds are increasing the likelihood that the Fed will have to reverse course at its November meeting.
In short, the no landing continues.
See our chart book with daily and weekly indicators for the US economy.
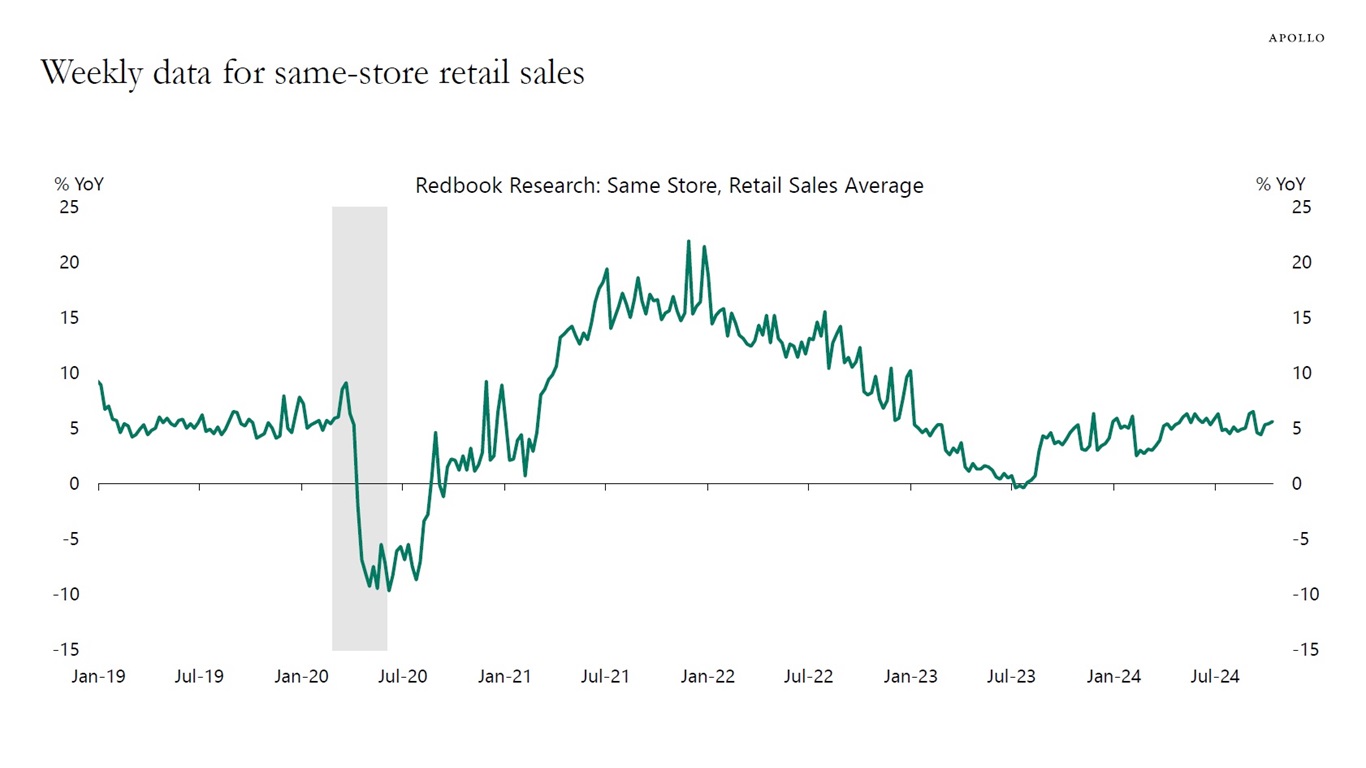
Source: Redbook, Haver Analytics, Apollo Chief Economist 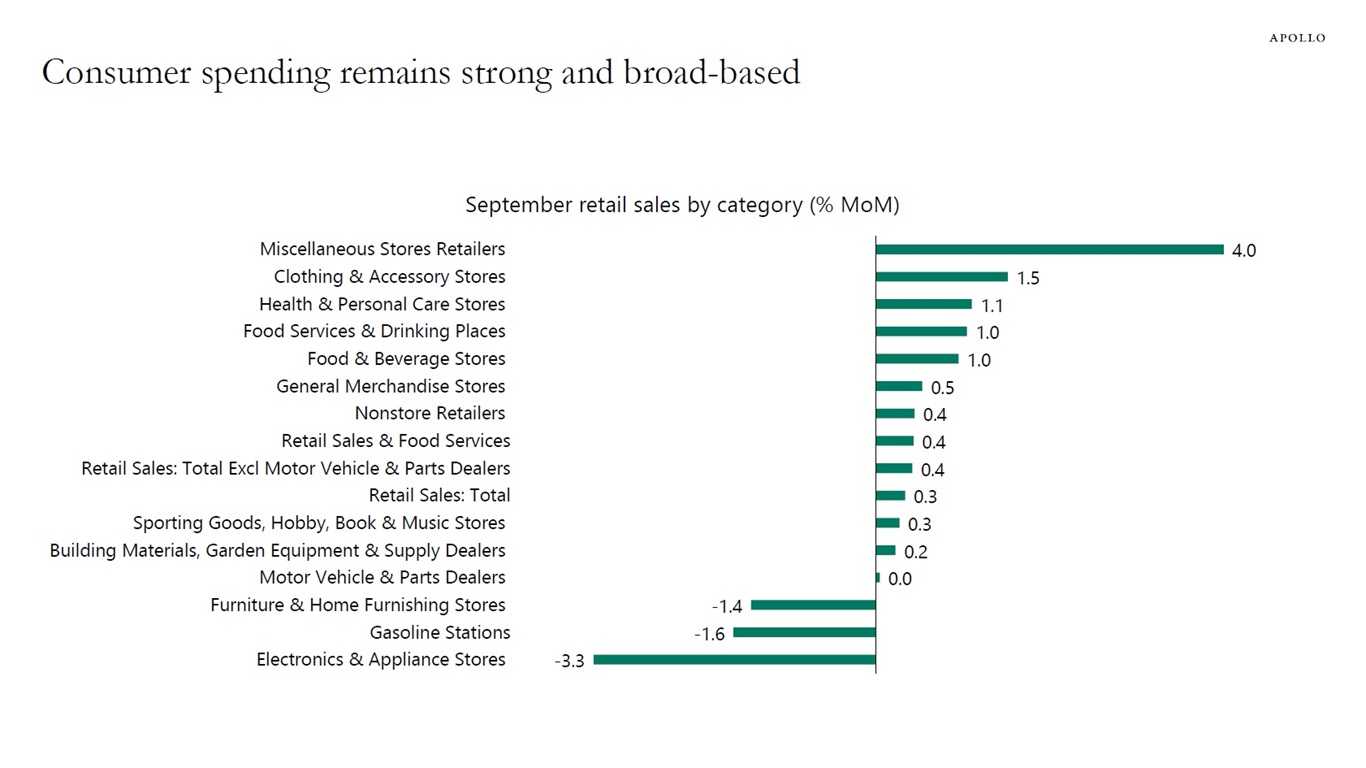
Source: Census Bureau, Haver Analytics, Apollo Chief Economist 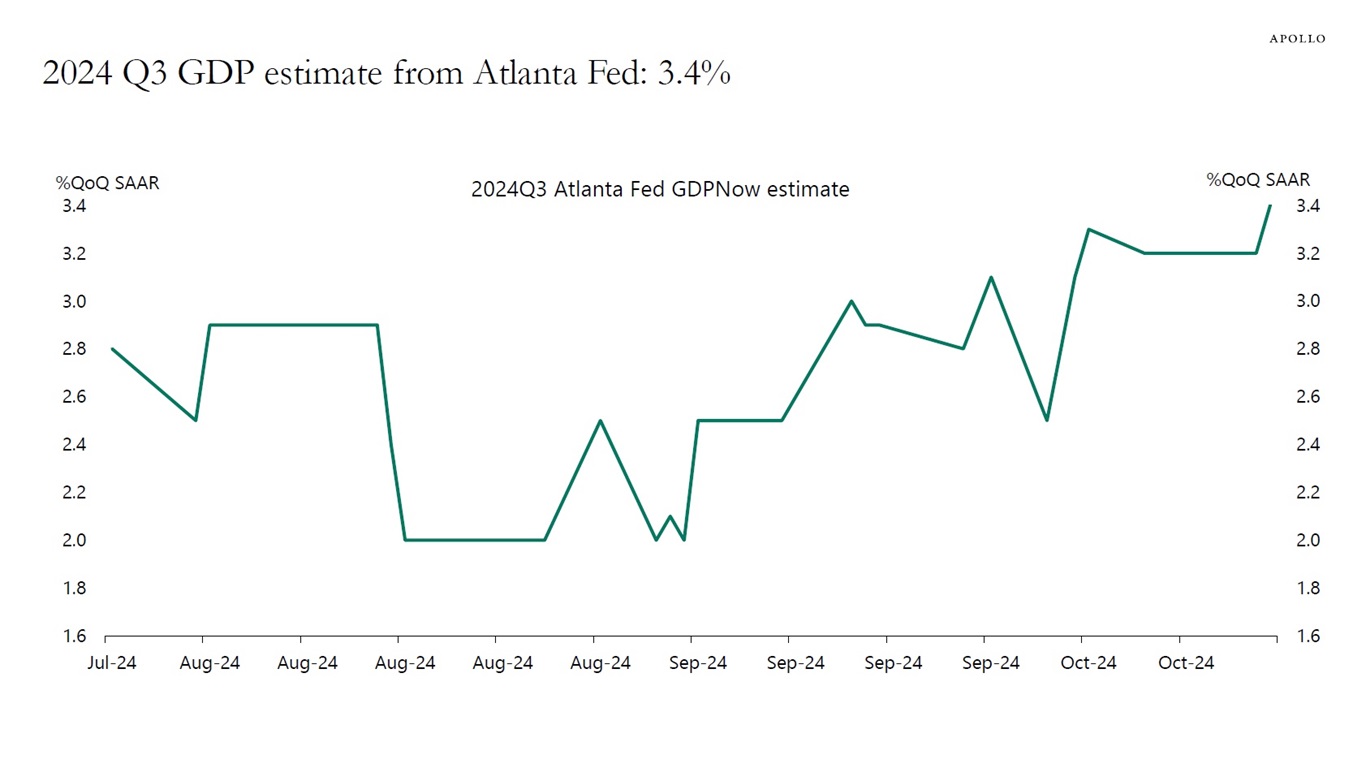
Source: Federal Reserve Bank of Atlanta, Haver Analytics, Apollo Chief Economist See important disclaimers at the bottom of the page.
-
Looking at the historical relationship between the S&P 500 forward P/E ratio and subsequent three-year returns in the benchmark index shows that the current forward P/E ratio at almost 22 implies a 3% annualized return over the coming three years, see chart below. In other words, when stocks are overvalued like they are today, investors should expect lower future returns.
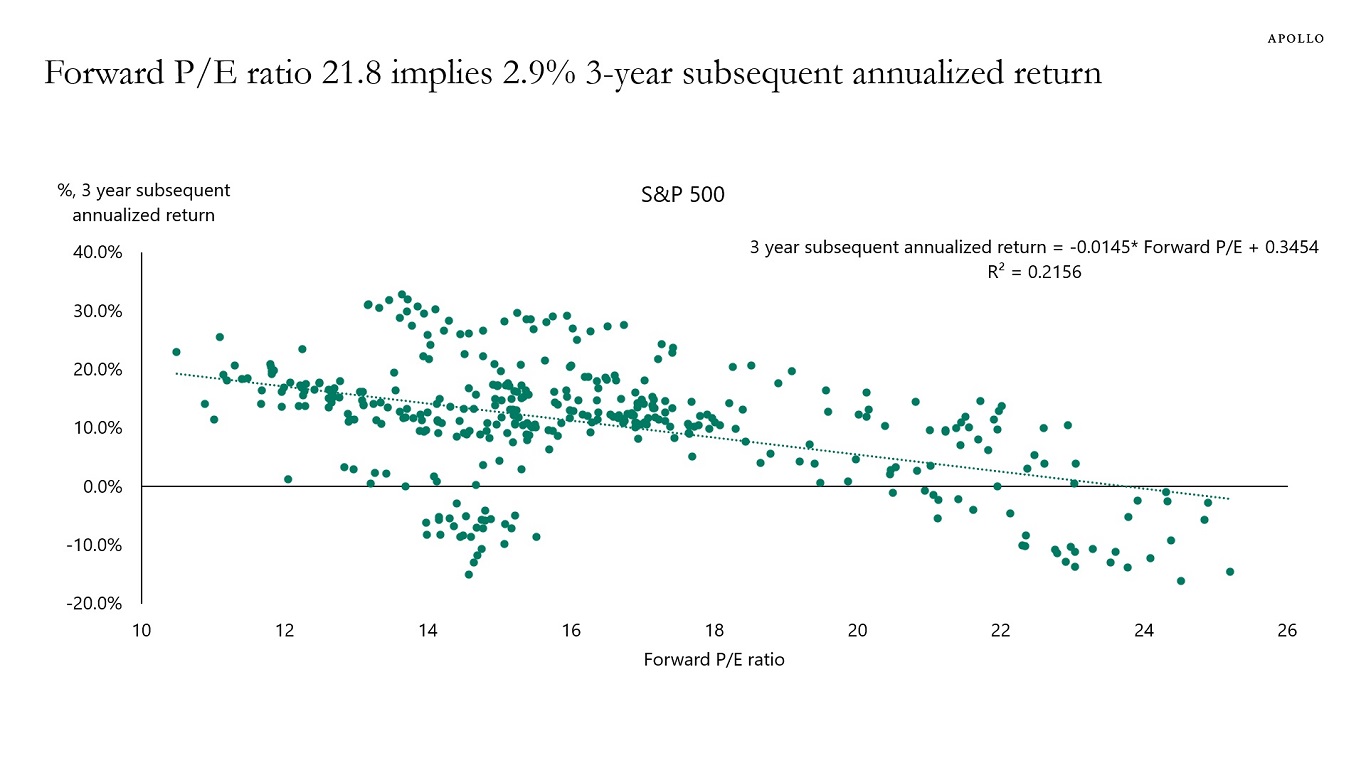
Source: Bloomberg, Apollo Chief Economist See important disclaimers at the bottom of the page.
-
Foreigners hold a significant amount of US stocks and fixed income, and the composition of their holdings has changed dramatically since the financial crisis, see chart below.
Today, 58% of US financial assets held by foreigners are equities. In 2010, 33% of financial assets held by foreigners were equities.
For corporate credit, the share has declined from 15% to 8%.
The bottom line is that foreigners are significantly overweight US equities and significantly underweight US credit.
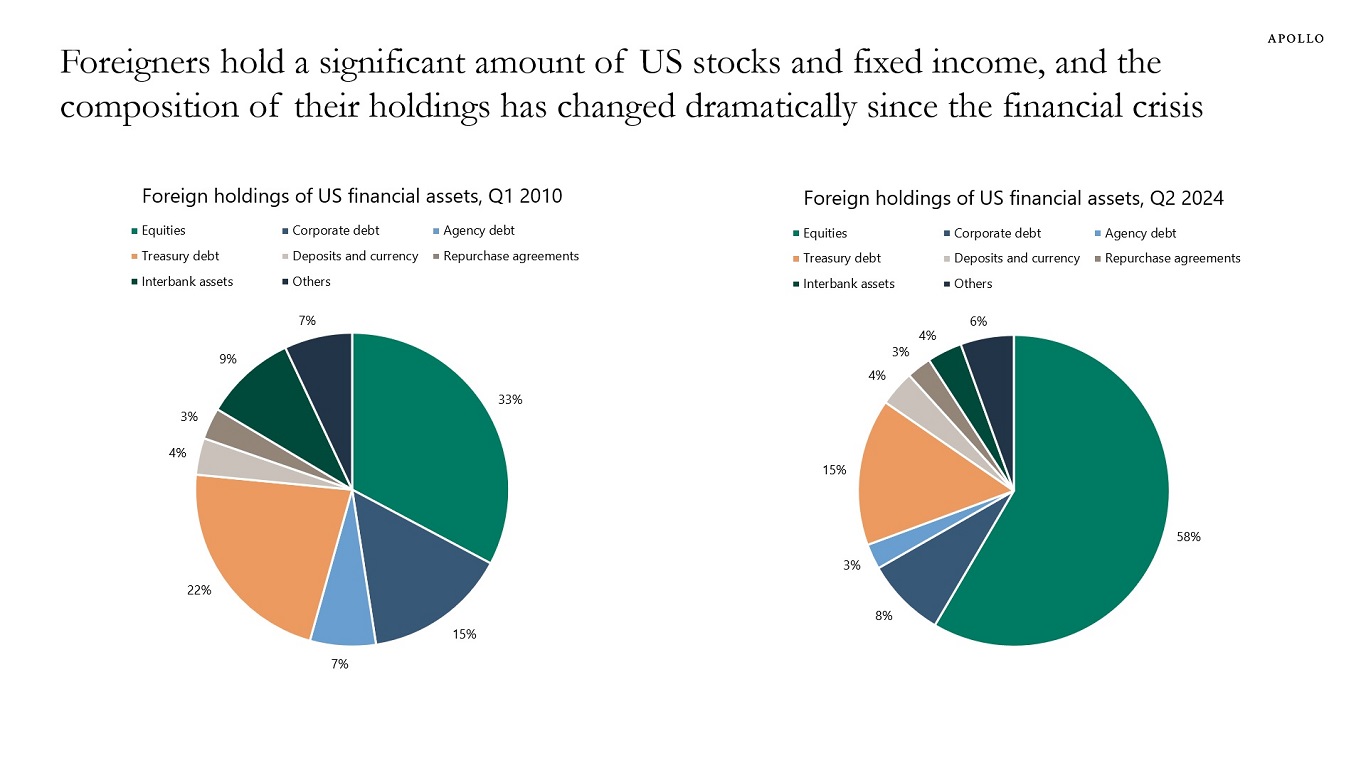
Note: Totals may not sum to 100% due to rounding. Source: FRB, Haver Analytics, Apollo Chief Economist See important disclaimers at the bottom of the page.
-
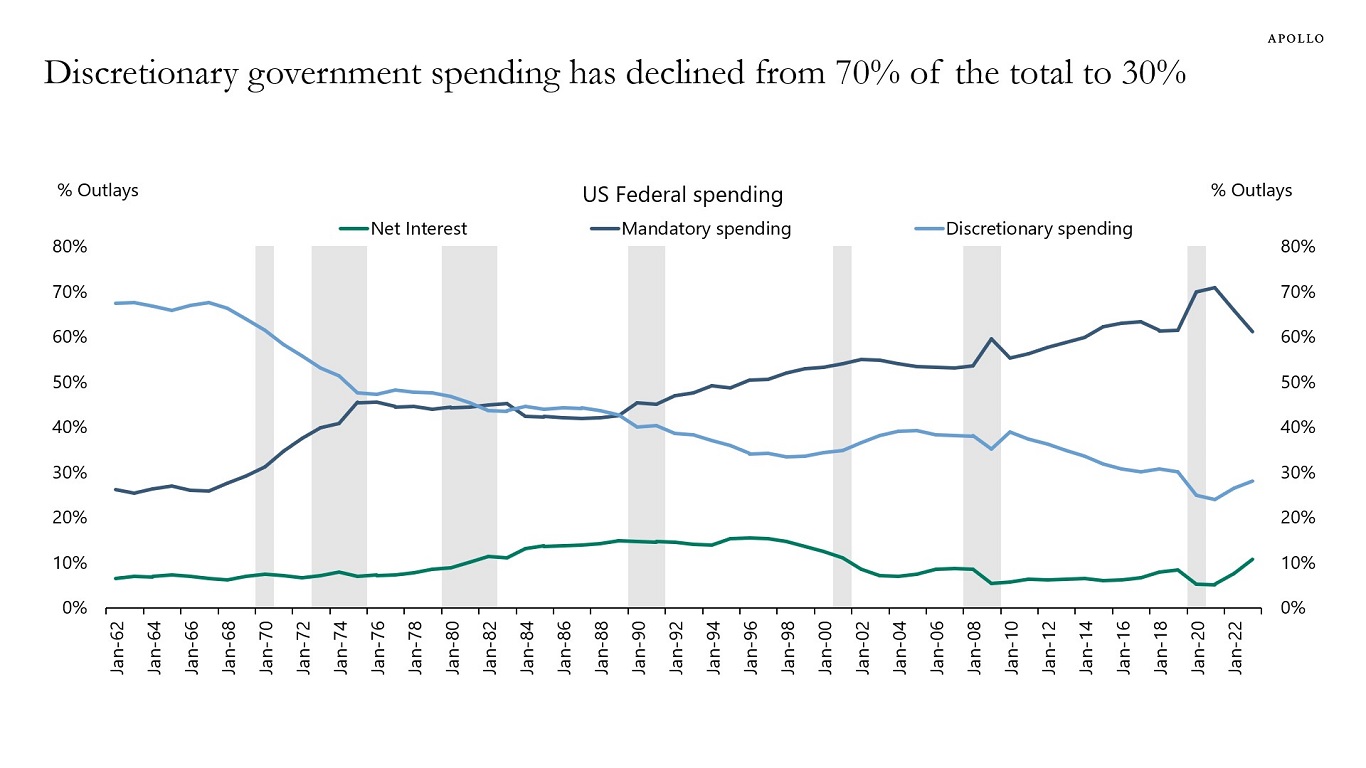
There are two categories of spending in the federal budget process, discretionary and mandatory.
Discretionary spending is subject to the appropriations process, and mandatory spending includes entitlement programs, such as Social Security and Medicare.
The share of government spending on mandatory spending has increased from 30% to 60%, thereby giving politicians less room to achieve a balanced budget without cutting entitlements.
Source: CBO, Haver Analytics. Apollo Chief Economist See important disclaimers at the bottom of the page.
-
Companies with no earnings, weak revenues, and weak cash flows underperform when interest rates stay higher for longer because they are not able to pay their higher debt servicing costs, see chart below.
Source: Bloomberg, Apollo Chief Economist See important disclaimers at the bottom of the page.

This presentation may not be distributed, transmitted or otherwise communicated to others in whole or in part without the express consent of Apollo Global Management, Inc. (together with its subsidiaries, “Apollo”).
Apollo makes no representation or warranty, expressed or implied, with respect to the accuracy, reasonableness, or completeness of any of the statements made during this presentation, including, but not limited to, statements obtained from third parties. Opinions, estimates and projections constitute the current judgment of the speaker as of the date indicated. They do not necessarily reflect the views and opinions of Apollo and are subject to change at any time without notice. Apollo does not have any responsibility to update this presentation to account for such changes. There can be no assurance that any trends discussed during this presentation will continue.
Statements made throughout this presentation are not intended to provide, and should not be relied upon for, accounting, legal or tax advice and do not constitute an investment recommendation or investment advice. Investors should make an independent investigation of the information discussed during this presentation, including consulting their tax, legal, accounting or other advisors about such information. Apollo does not act for you and is not responsible for providing you with the protections afforded to its clients. This presentation does not constitute an offer to sell, or the solicitation of an offer to buy, any security, product or service, including interest in any investment product or fund or account managed or advised by Apollo.
Certain statements made throughout this presentation may be “forward-looking” in nature. Due to various risks and uncertainties, actual events or results may differ materially from those reflected or contemplated in such forward-looking information. As such, undue reliance should not be placed on such statements. Forward-looking statements may be identified by the use of terminology including, but not limited to, “may”, “will”, “should”, “expect”, “anticipate”, “target”, “project”, “estimate”, “intend”, “continue” or “believe” or the negatives thereof or other variations thereon or comparable terminology.