


Want it delivered daily to your inbox?
-
Eighty-nine percent of US government debt outstanding is fixed rate and 22% are bills, 50% are notes, and 17% are coupons, see chart below.
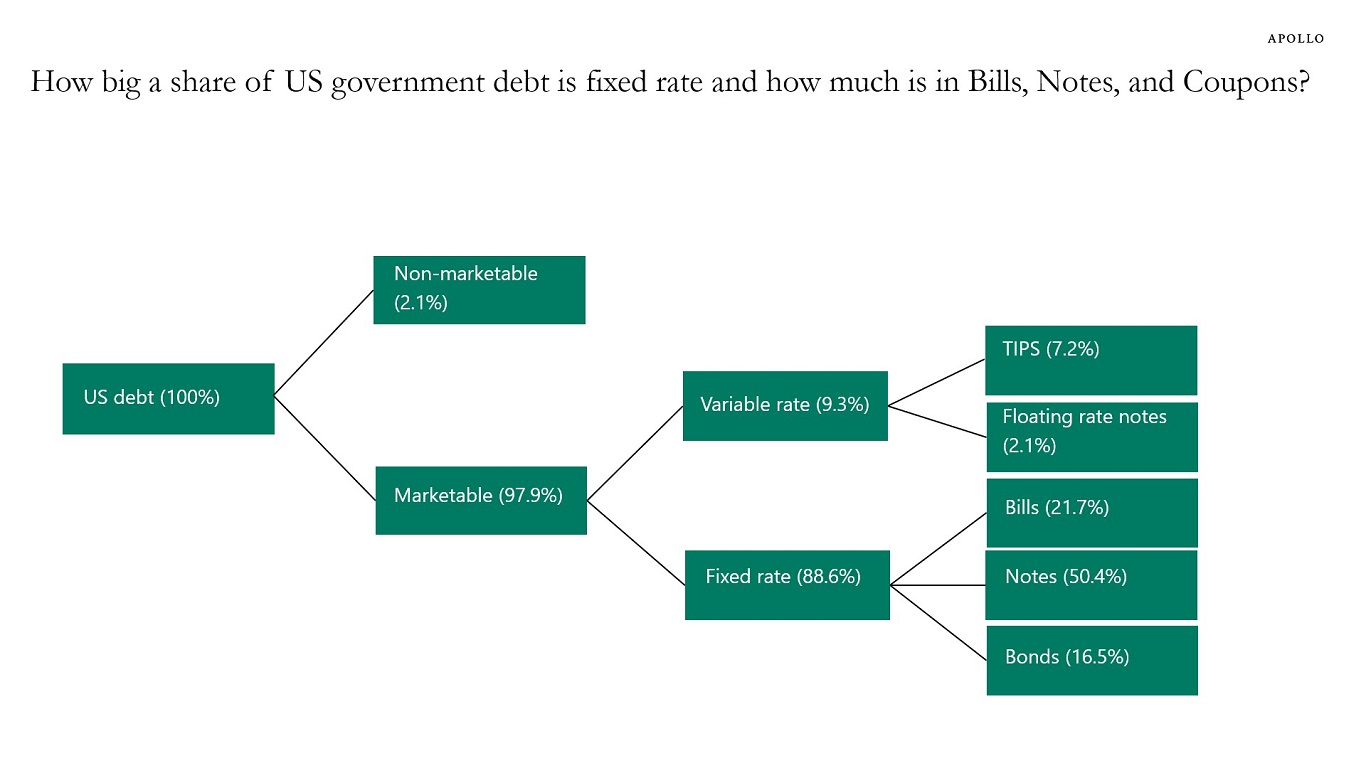
Data as of August 2024. Source: Fed, Monthly Statement of Public Debt (MSPD) | US Treasury Fiscal Data (https://fiscaldata.treasury.gov/datasets/monthly-statement-public-debt/summary-of-treasury-securities-outstanding), US Treasury Department, Apollo Chief Economist See important disclaimers at the bottom of the page.
-
US households have experienced significant gains in stock prices and home prices over the past 15 years, and Fed hikes have generated significant cash flows to owners of fixed income.
As a result, the debt-to-income ratio looks much better for US households compared with other countries, including Canada and Australia, see the first chart below.
At the same time, credit card debt for US households is at very low levels and declining, see the second chart.
The bottom line is that US household balance sheets are in excellent shape.
Combined with strong job growth, solid wage growth, rising asset prices, and the Fed cutting rates, there is no recession on the horizon.
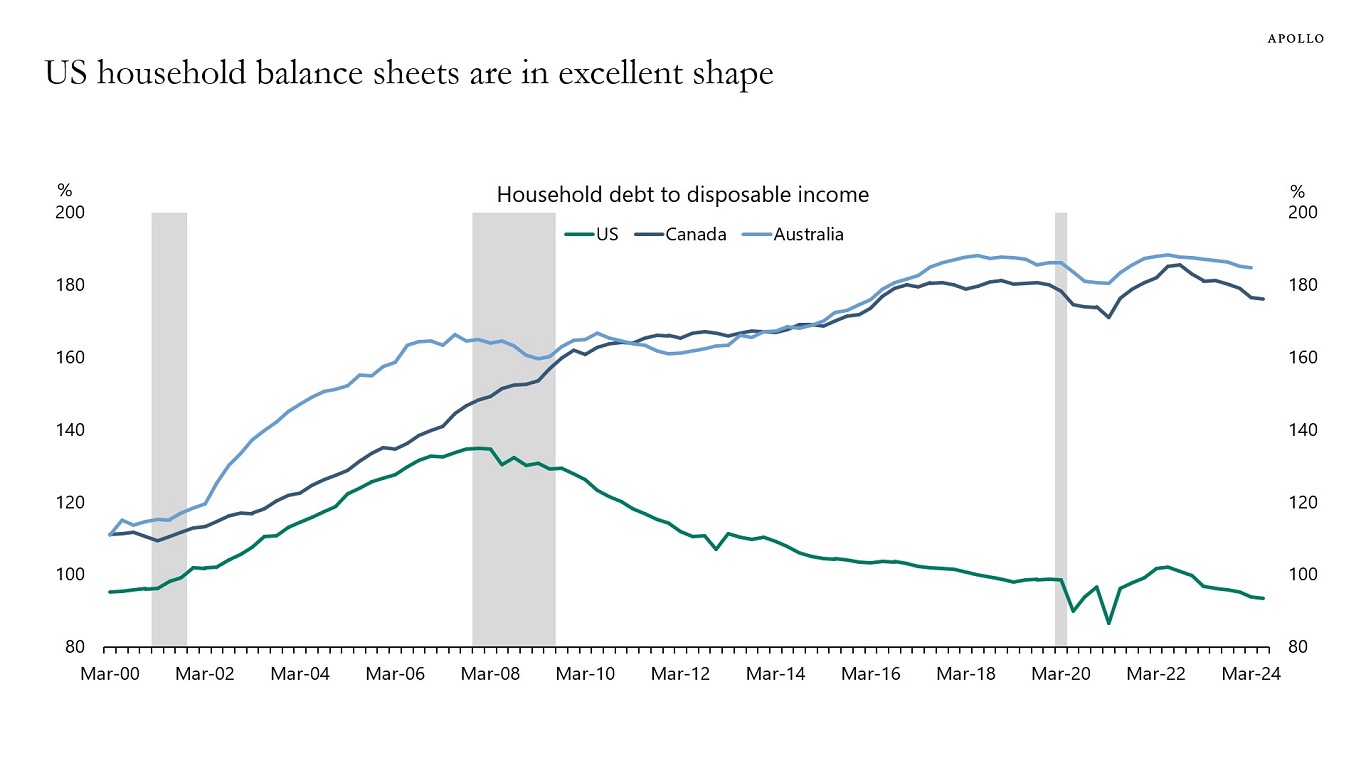
Source: Statistics Canada, Reserve Bank of Australia, Bloomberg, Apollo Chief Economist 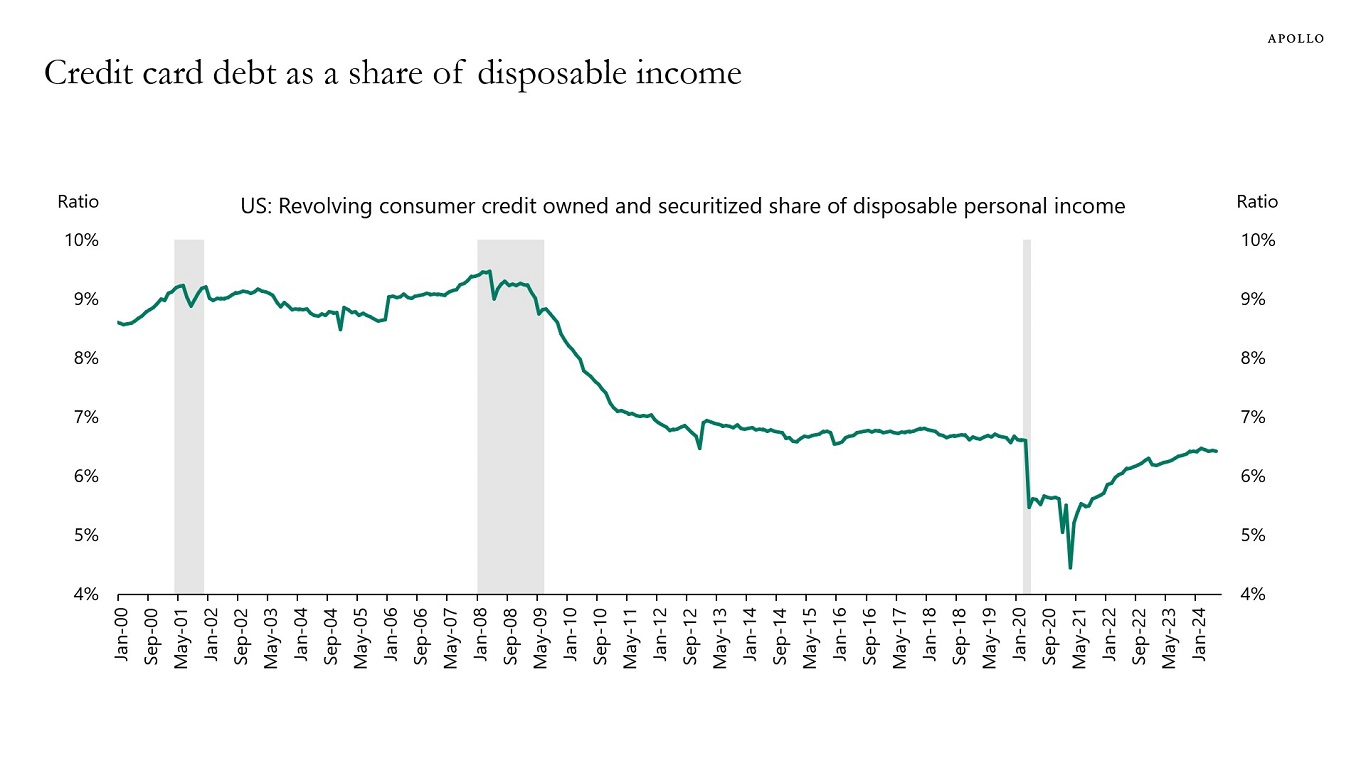
Source: Federal Reserve Board, BEA, Haver Analytics, Apollo Chief Economist See important disclaimers at the bottom of the page.
-
Going to a Broadway show can cost up to $200, and the latest weekly data shows that consumers are still happy to pay this discretionary expense, see the first chart below.
More broadly, GDP growth in the second quarter was 3.0%, and the Atlanta Fed GDP estimate for the third quarter is 3.2%, see the second and third chart.
Why is the economy so strong? Because of lower interest rate sensitivity for households and firms because of locked-in low interest rates, strong AI spending, and strong fiscal spending driven by the CHIPS Act, the IRA, and the Infrastructure Act. Combined with high stock prices and tight credit spreads, these forces are offsetting the long and variable lags of monetary policy.
See our chart book with daily and weekly indicators.
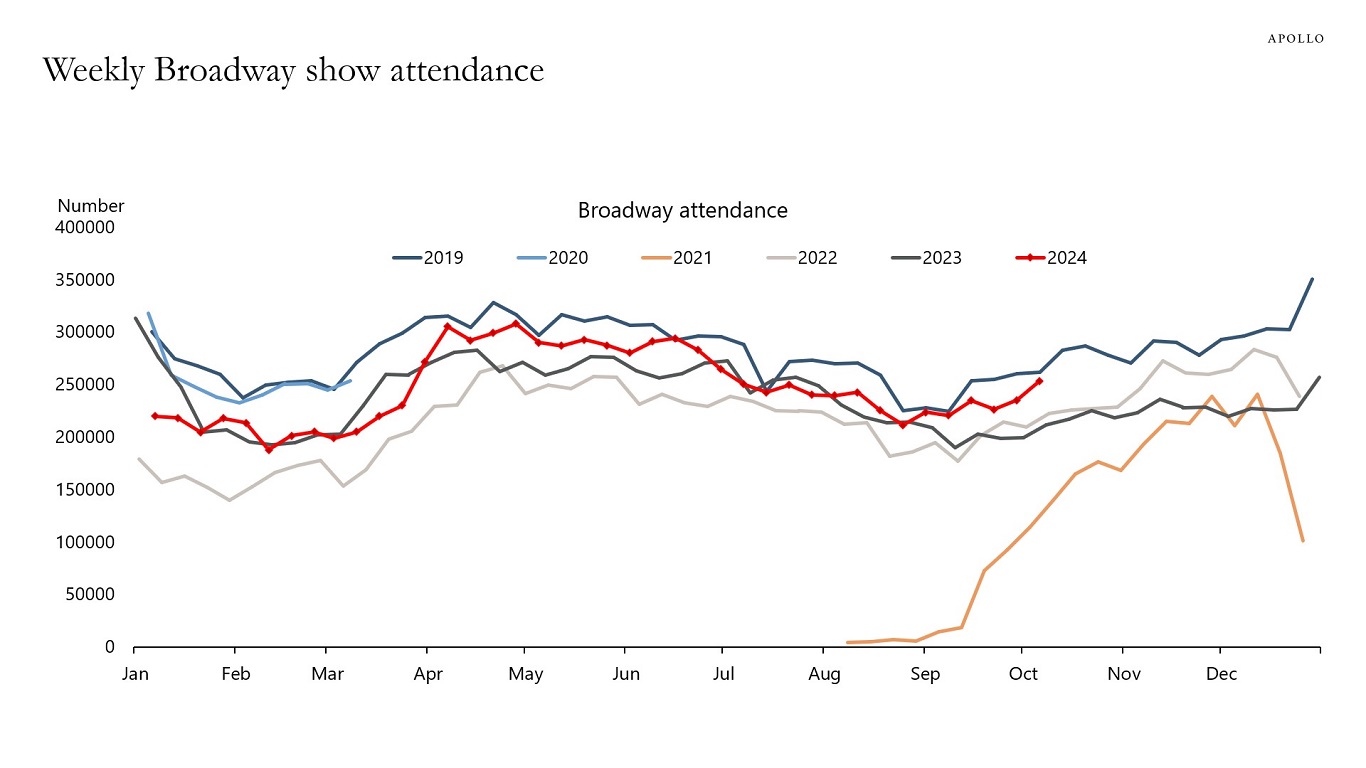
Source: Internet Broadway Database, Apollo Chief Economist 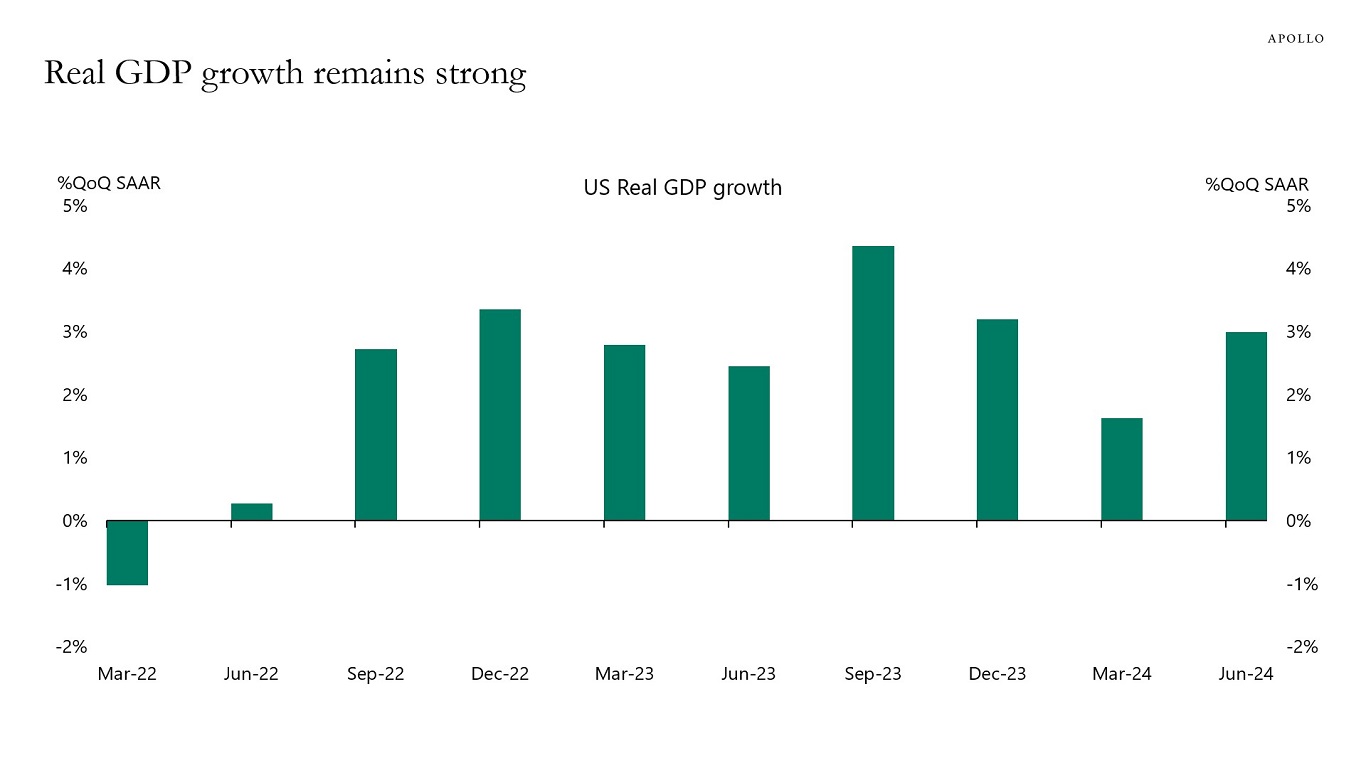
Source: BEA, Haver Analytics, Apollo Chief Economist 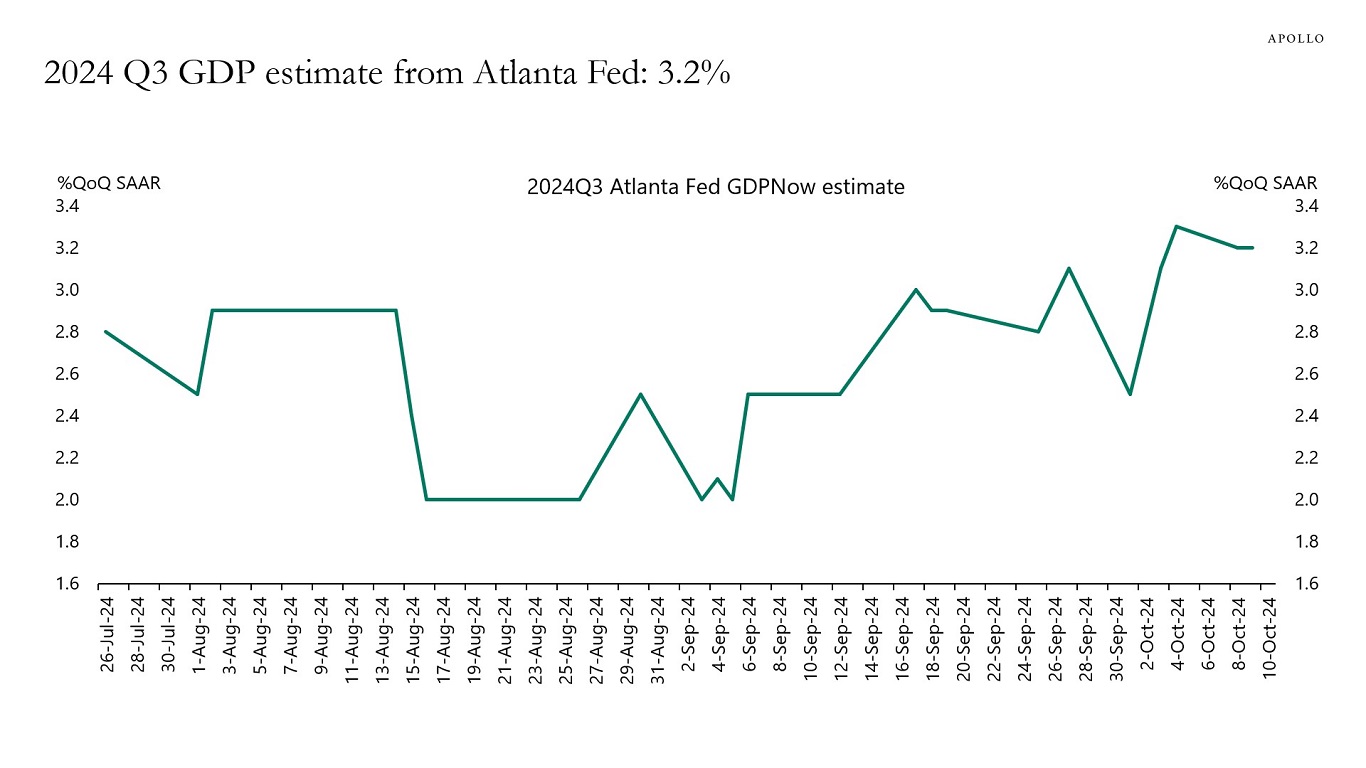
Source: Federal Reserve Bank of Atlanta, Haver Analytics, Apollo Chief Economist See important disclaimers at the bottom of the page.
-
Healthcare, financials, and consumer staples outperform during Fed cut episodes that end with a soft landing, see chart below.
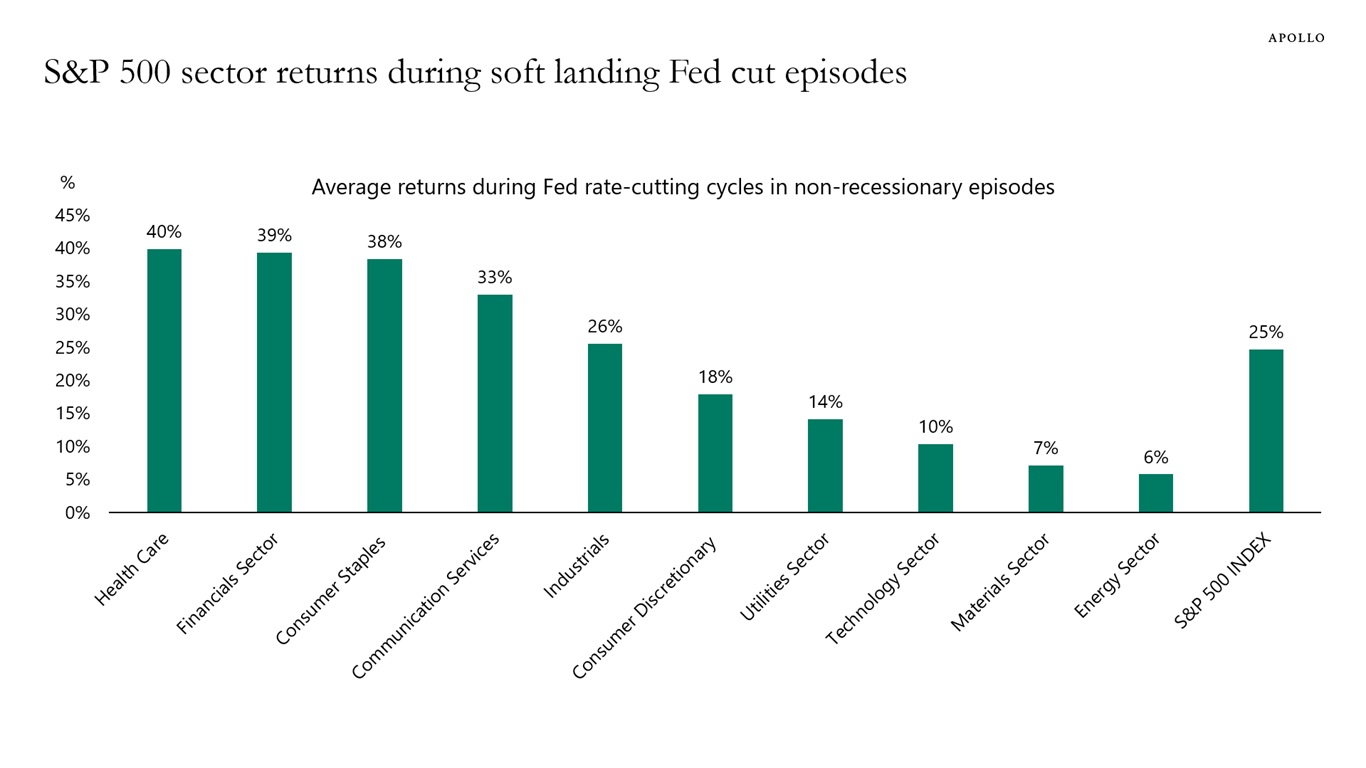
Note: The data represents cumulative total returns of each sector during the two rate cut cycles (July 1995-January 1996 and September 1998-November 1998) that did not overlap with a recession. Source: Bloomberg, Apollo Chief Economist See important disclaimers at the bottom of the page.
-
Voter turnout rates differ dramatically across states, with a 70% participation rate in Oregon and 38% in West Virginia, see chart below.
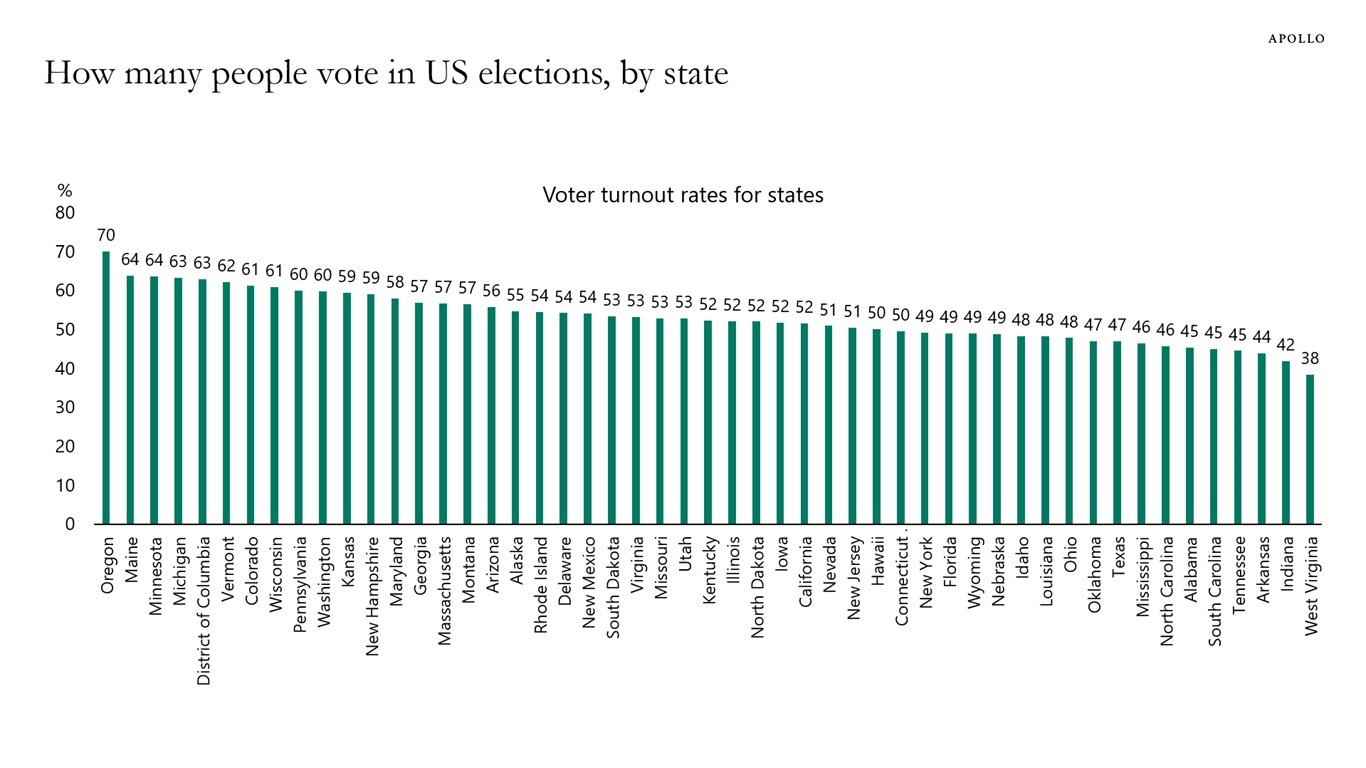
Note: Data for Midterm elections 2022. Source: The Brookings Institution, Apollo Chief Economist See important disclaimers at the bottom of the page.
-
Prime brokerage borrowing is now at $2.3 trillion, up from around $1 trillion before the pandemic, see chart below.
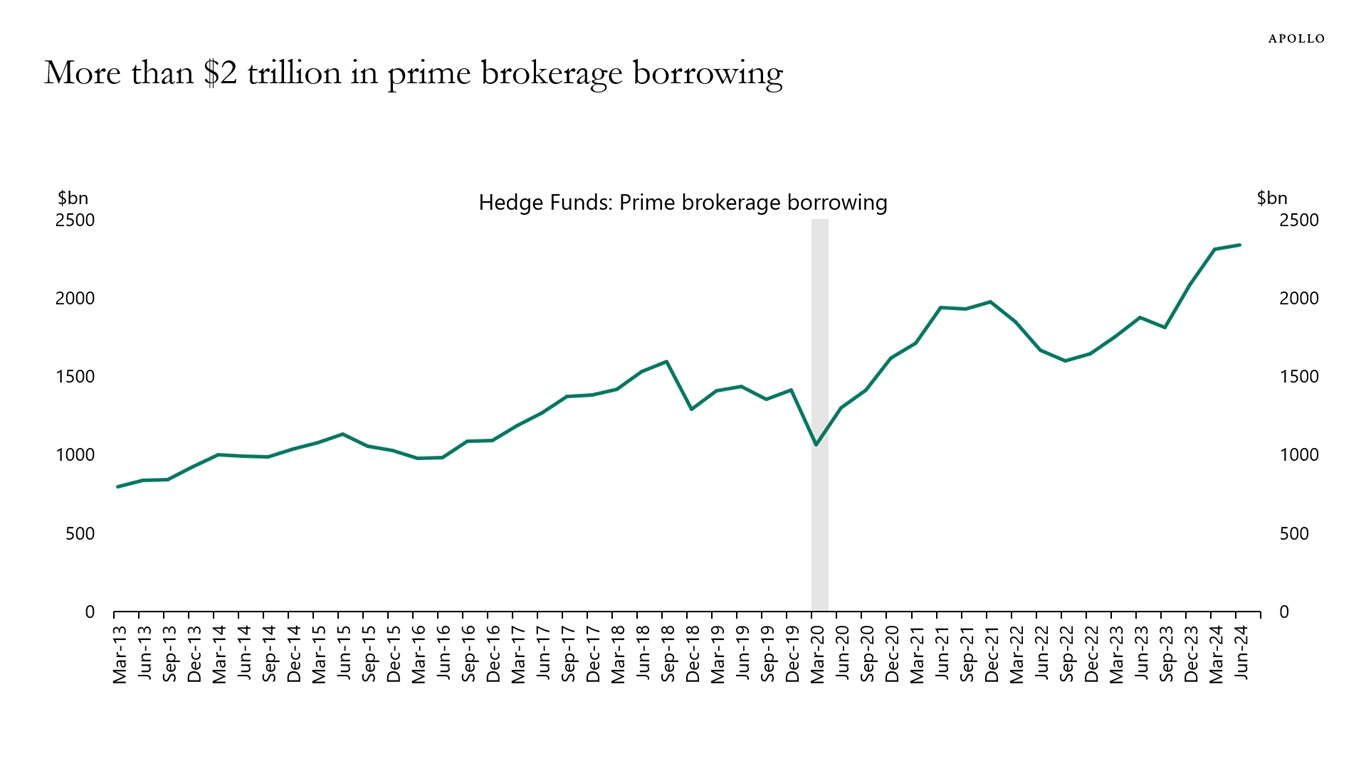
Note: The data are aggregated responses to SEC Form PF question 43. Only responses from Qualifying Hedge Funds are included.
Source: Data for the US Office of Financial Research, Apollo Chief EconomistSee important disclaimers at the bottom of the page.
-
Data centers use 26% of Virginia’s total power consumption, and there is a significant need for long-term investments in energy to power the ongoing AI revolution, see map below.
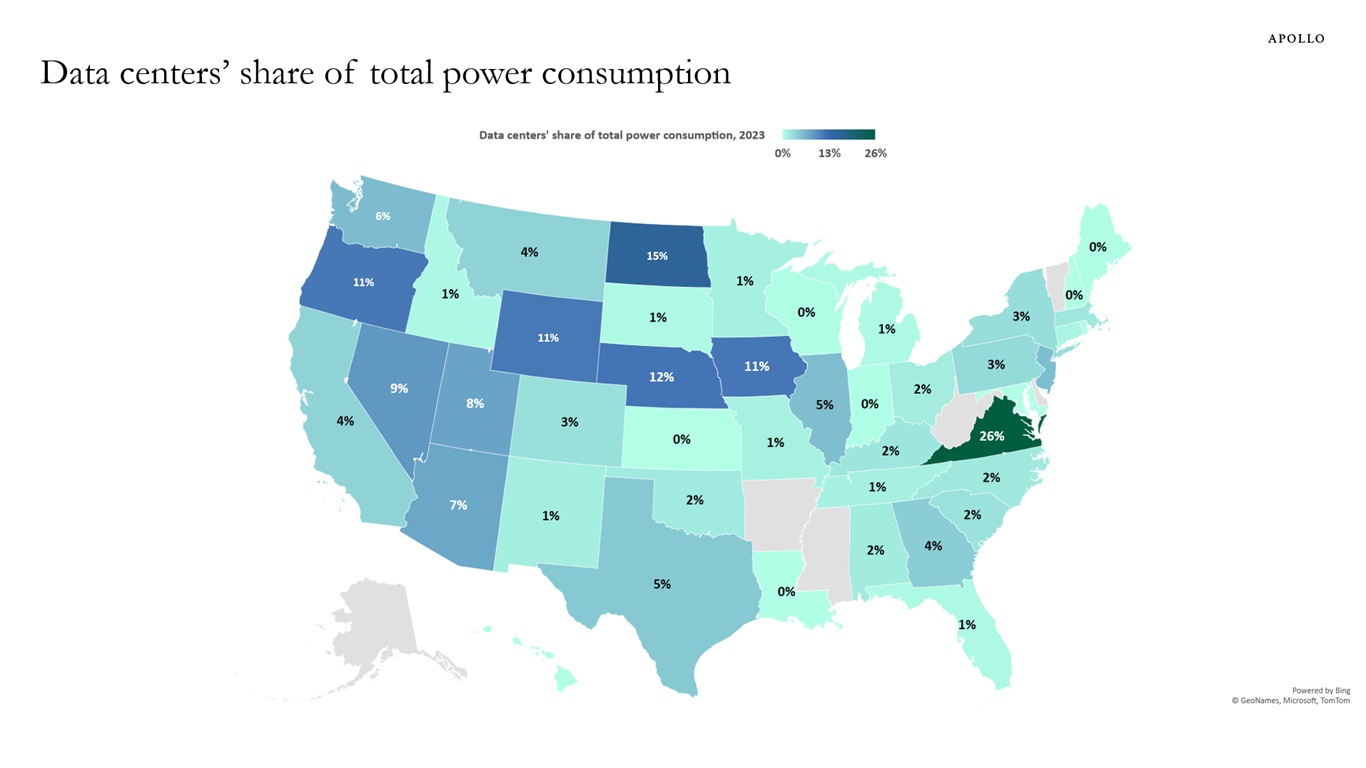
Note: There is no data available for states shaded in grey. Source: Electric Power Research Institute (EPRI), Apollo Chief Economist See important disclaimers at the bottom of the page.
-
The share of land owned by the federal government varies dramatically across states, see chart below.

Source: World Population Review, Apollo Chief Economist See important disclaimers at the bottom of the page.
-
The time it takes for applications for US citizenship has declined from 12 months to four months, which contributes to accelerating immigration growth at the moment.
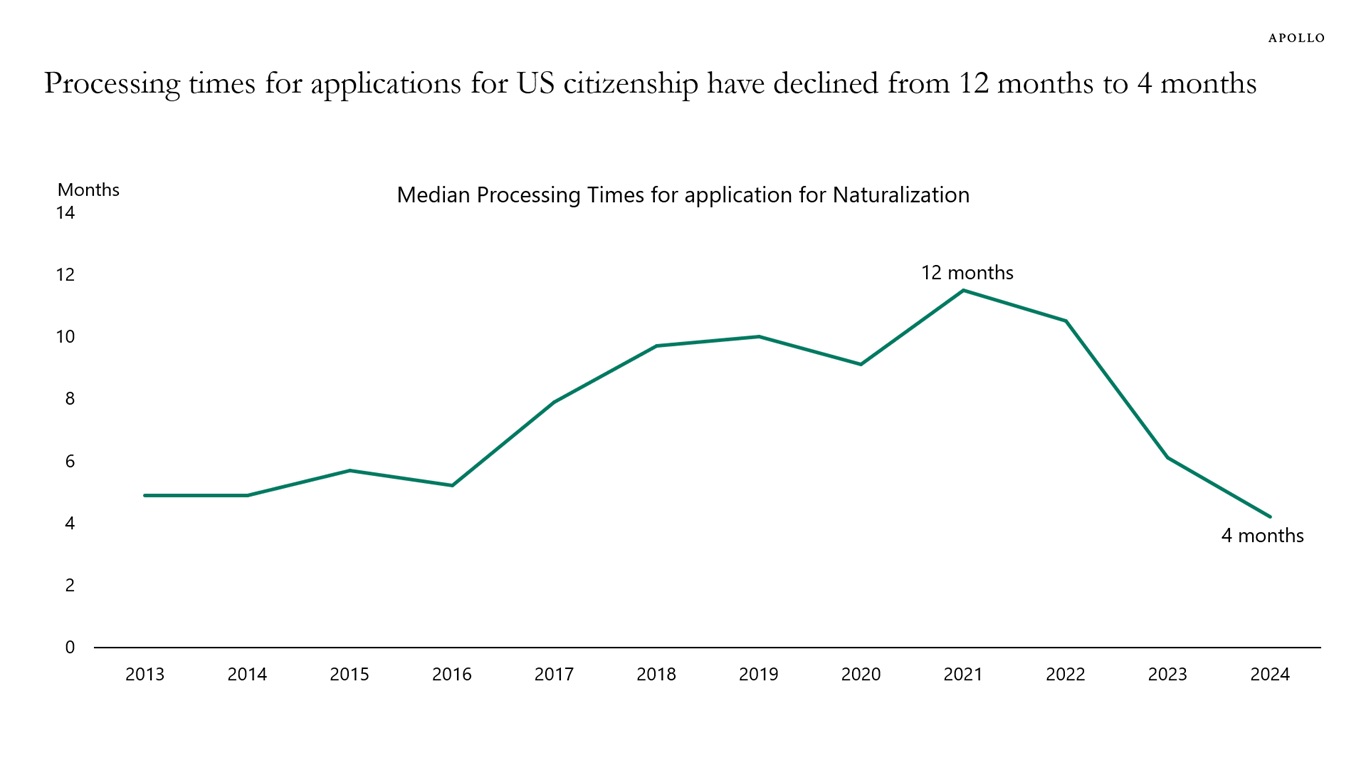
Note: Year indicates fiscal year. Source: US Citizenship and Immigration Services, Apollo Chief Economist See important disclaimers at the bottom of the page.
-
The incoming data continues to remain robust. The US economy added 254,000 jobs in September versus a consensus expectation of 150,000 jobs, the unemployment rate fell from 4.2% to 4.1%, wage growth is solid and remains sticky, job openings are going up, and the ISM services reading is also strong.
Why is the economy still strong? Because of lower sensitivity to Fed hikes for consumers and firms with locked-in low interest rates. Because of strong AI spending. Because of strong fiscal and defense spending. These tailwinds are countering the long and variable lags of monetary policy. And now the Fed is cutting rates, which is boosting growth and inflation further. Combined with very easy financial conditions, the bottom line remains that rates will stay higher for longer.
Our chart book with daily and weekly data is available here.
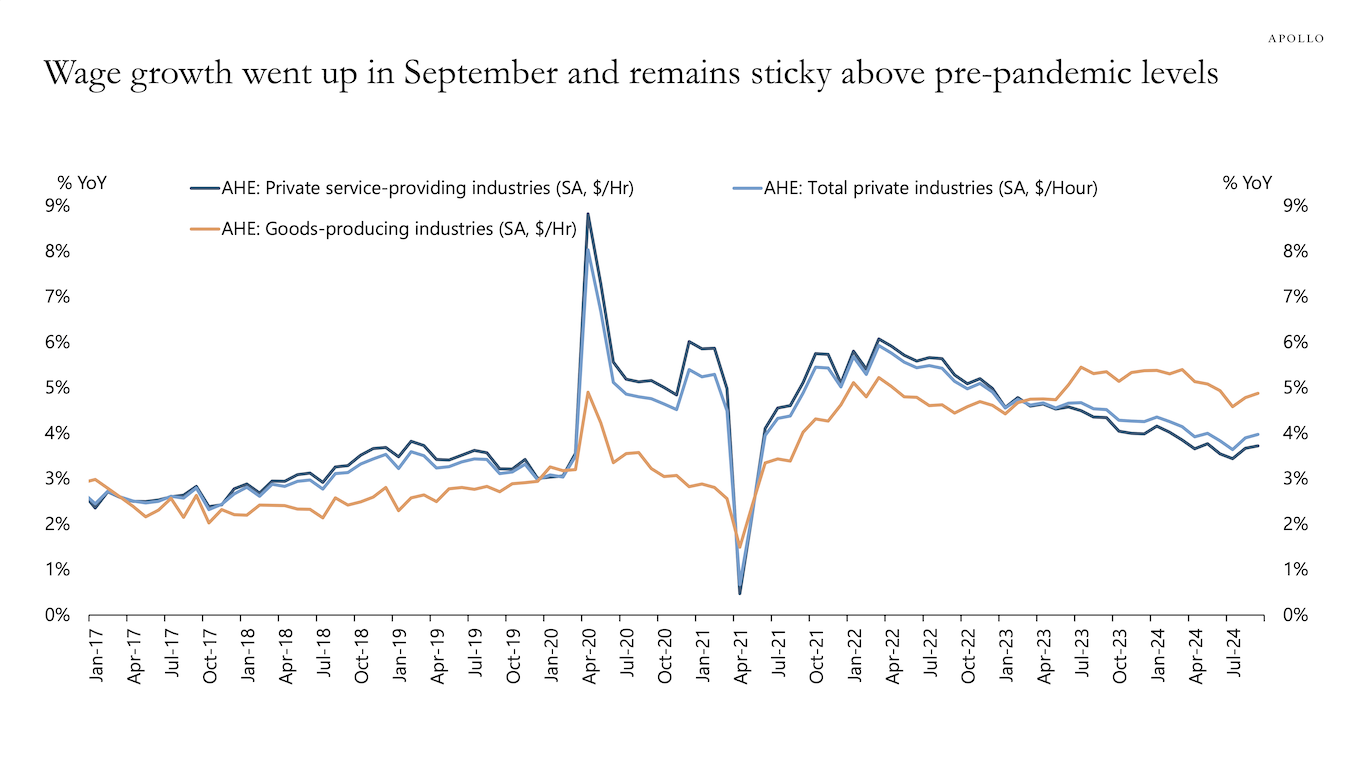
Source: BLS, Haver Analytics, Apollo Chief Economist 
Note: The Worker Adjustment and Retraining Notification (WARN) Act helps ensure 60 to 90 days advance notice in cases of qualified plant closings and mass layoffs. WARN factor is the Cleveland Fed estimate for WARN notices (https://www.clevelandfed.org/publications/working-paper/wp-2003r-advance-layoff-notices-and-aggregate-job-loss). Source: Department of Labor, Haver Analytics, Federal Reserve Bank of Cleveland, Apollo Chief Economist 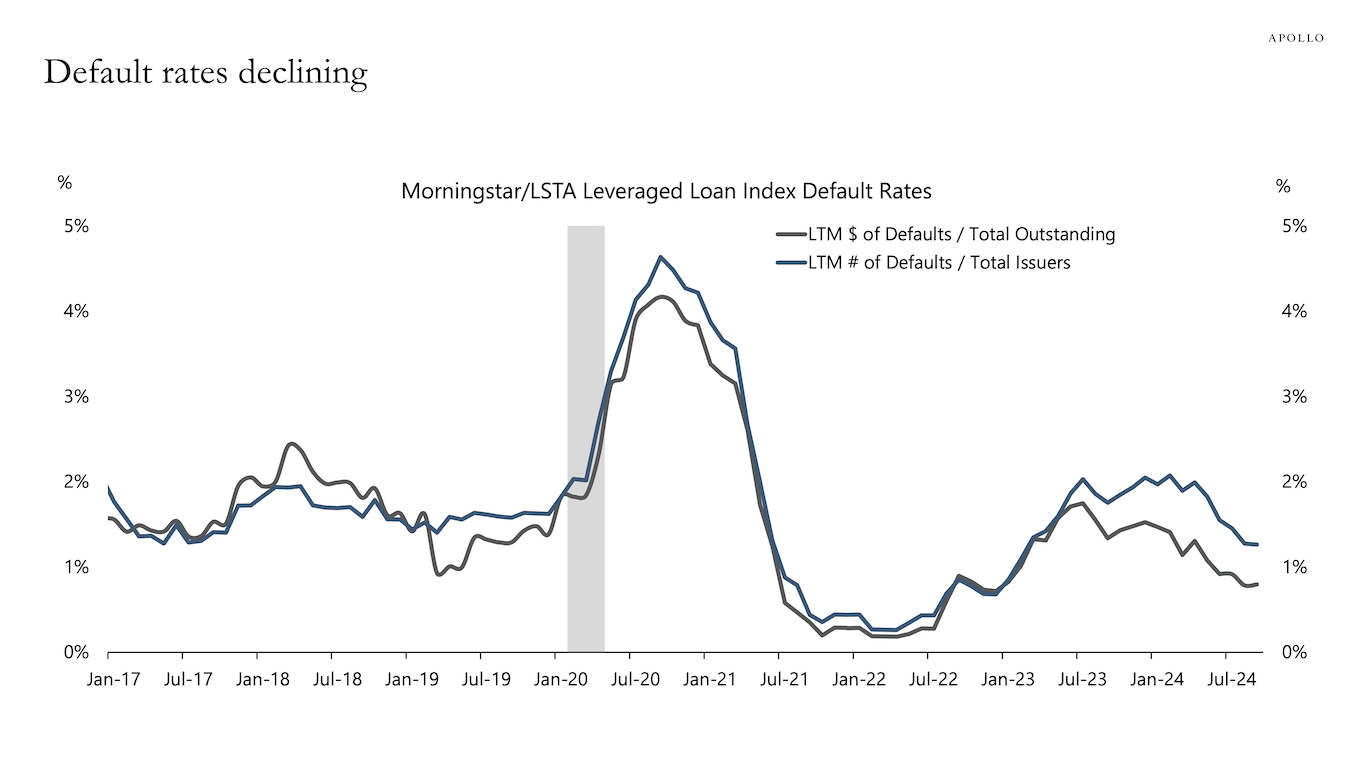
Source: PitchBook LCD, Apollo Chief Economist See important disclaimers at the bottom of the page.

This presentation may not be distributed, transmitted or otherwise communicated to others in whole or in part without the express consent of Apollo Global Management, Inc. (together with its subsidiaries, “Apollo”).
Apollo makes no representation or warranty, expressed or implied, with respect to the accuracy, reasonableness, or completeness of any of the statements made during this presentation, including, but not limited to, statements obtained from third parties. Opinions, estimates and projections constitute the current judgment of the speaker as of the date indicated. They do not necessarily reflect the views and opinions of Apollo and are subject to change at any time without notice. Apollo does not have any responsibility to update this presentation to account for such changes. There can be no assurance that any trends discussed during this presentation will continue.
Statements made throughout this presentation are not intended to provide, and should not be relied upon for, accounting, legal or tax advice and do not constitute an investment recommendation or investment advice. Investors should make an independent investigation of the information discussed during this presentation, including consulting their tax, legal, accounting or other advisors about such information. Apollo does not act for you and is not responsible for providing you with the protections afforded to its clients. This presentation does not constitute an offer to sell, or the solicitation of an offer to buy, any security, product or service, including interest in any investment product or fund or account managed or advised by Apollo.
Certain statements made throughout this presentation may be “forward-looking” in nature. Due to various risks and uncertainties, actual events or results may differ materially from those reflected or contemplated in such forward-looking information. As such, undue reliance should not be placed on such statements. Forward-looking statements may be identified by the use of terminology including, but not limited to, “may”, “will”, “should”, “expect”, “anticipate”, “target”, “project”, “estimate”, “intend”, “continue” or “believe” or the negatives thereof or other variations thereon or comparable terminology.