


Want it delivered daily to your inbox?
-
One way to measure liquidity is to add bank reserves and money market assets, see chart below which shows that there is record-high liquidity to push stock prices higher and credit spreads tighter. In particular, once the Fed starts lowering interest rates, some of the $6 trillion in money market funds is likely to find its way into stocks and credit.
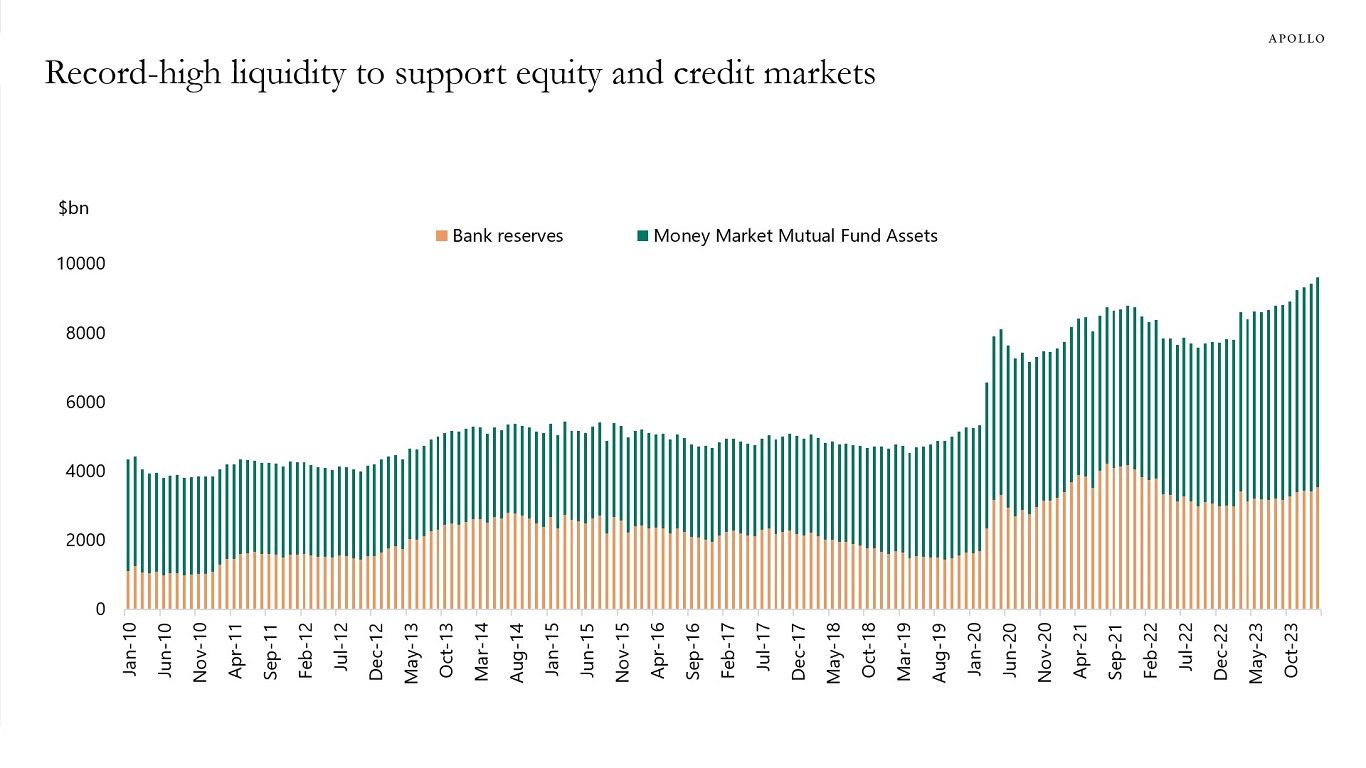
Source: ICI, FRB, Haver Analytics, Apollo Chief Economist See important disclaimers at the bottom of the page.
-
The best guide to whether monetary policy is restrictive is not r-star but the incoming data. The incoming data shows that after the Fed turned dovish and the stock market rallied, we have in January and February seen strong employment growth, low jobless claims, and upward pressure on CPI and PPI inflation.
Maybe the lagged effects of Fed hikes work after 12 to 18 months through income in the consumption function. However, the effects of easy financial conditions on consumer spending are immediate. Given that financial conditions have eased significantly over the past five months, with record-high stock prices, tight credit spreads, and rising home prices, it is not surprising that the incoming economic data is strong.
The bottom line is that the last mile is harder because of the immediate positive impact on the economy of record-high stock prices. In contrast, the long and variable lags work mainly through a rising unemployment rate.
In short, the long and variable lags of monetary policy have been overwhelmed by the 25% increase in the S&P 500 since November.
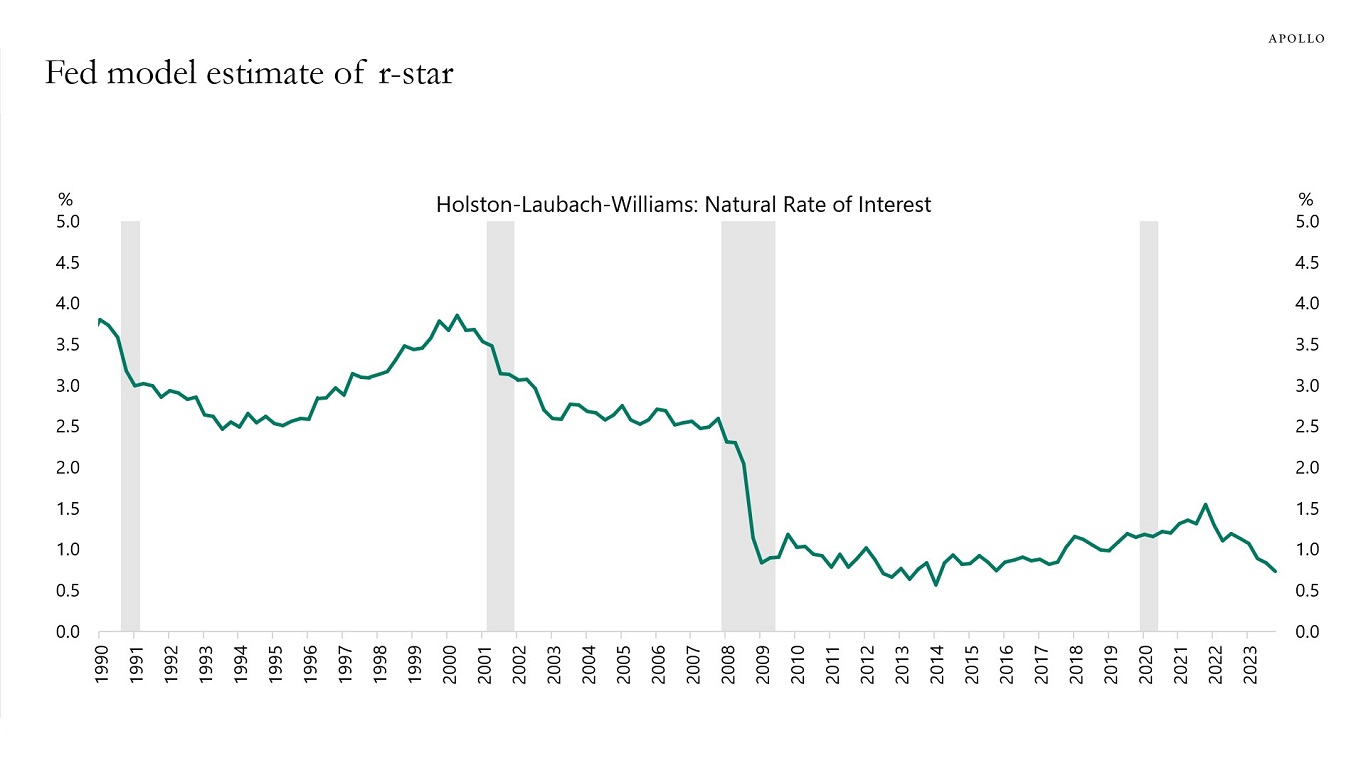
Source: FRBNY, Haver Analytics, Apollo Chief Economist See important disclaimers at the bottom of the page.
-
The New York Fed has constructed a new measure of trend wage inflation, which currently is running at 5%, see chart below and here.
Wage inflation at 5% is not consistent with the Fed’s 2% inflation target. The Fed will keep interest rates higher for longer.
This is not surprising given the ongoing reacceleration in both nonfarm payrolls and CPI and PPI inflation, likely driven by the significant easing of financial conditions since the December 13 FOMC meeting and Chris Waller’s hawkish-to-dovish speech in November.
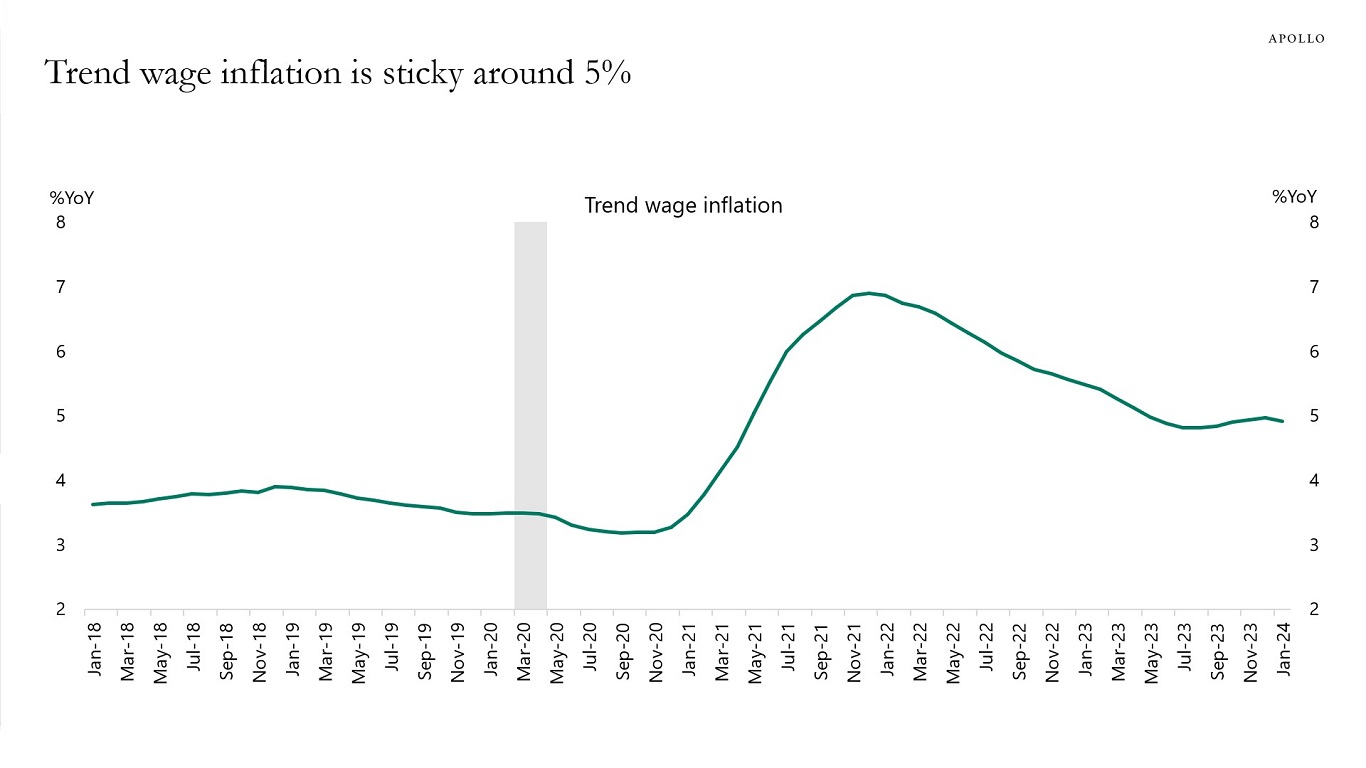
Source: Federal Reserve Bank of New York, Apollo Chief Economist See important disclaimers at the bottom of the page.
-
The total amount of corporate bonds outstanding is now over $10 trillion, and the primary dealer inventory of corporate bonds is $33 billion, see chart below.
This is not a liquid market. When credit markets are quiet and calm, it gives the impression that liquidity is fine, but if many holders of credit suddenly want to sell, liquidity will disappear. Even in quiet markets, finding a bond can take several days.
With more evergreen funds with monthly and quarterly liquidity in private credit, the reality is that the liquidity situation in public and private credit is converging, and in some cases, if you want to buy or sell a big amount of public credit without moving the price, private credit may be more liquid.

Source: FRBNY, Haver Analytics, ICE BofA, Bloomberg, Apollo Chief Economist See important disclaimers at the bottom of the page.
-
When the Fed lowered interest rates to zero in 2008, demand for $100 bills started growing faster than demand for $1 bills, and there are now more $100 bills than $1 bills in circulation, see chart below.
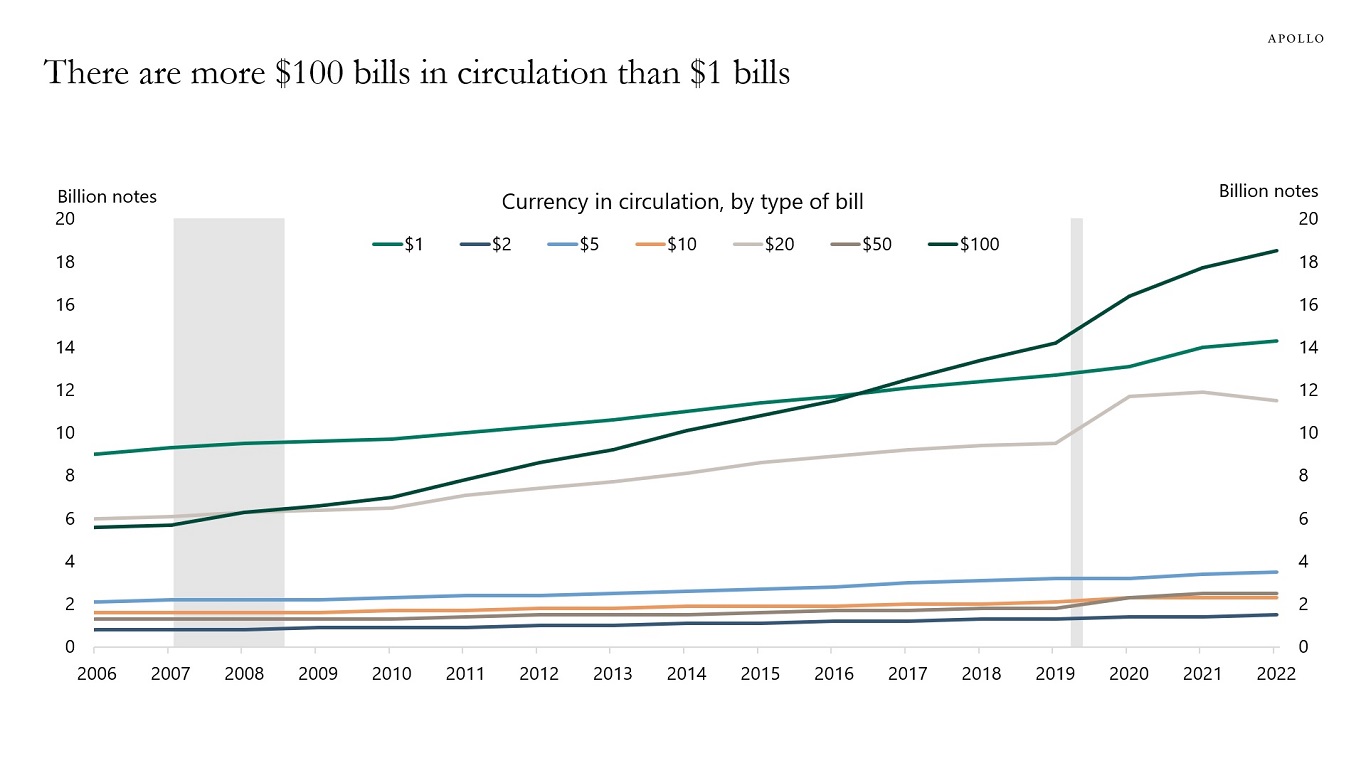
Source: Federal Reserve Board, Apollo Chief Economist See important disclaimers at the bottom of the page.
-
See important disclaimers at the bottom of the page.
-
Immigration continues to be the key source of population growth in the United States, and the CBO estimates that net births will be negative in a few decades, see chart below.
For more discussion, see also this new paper.
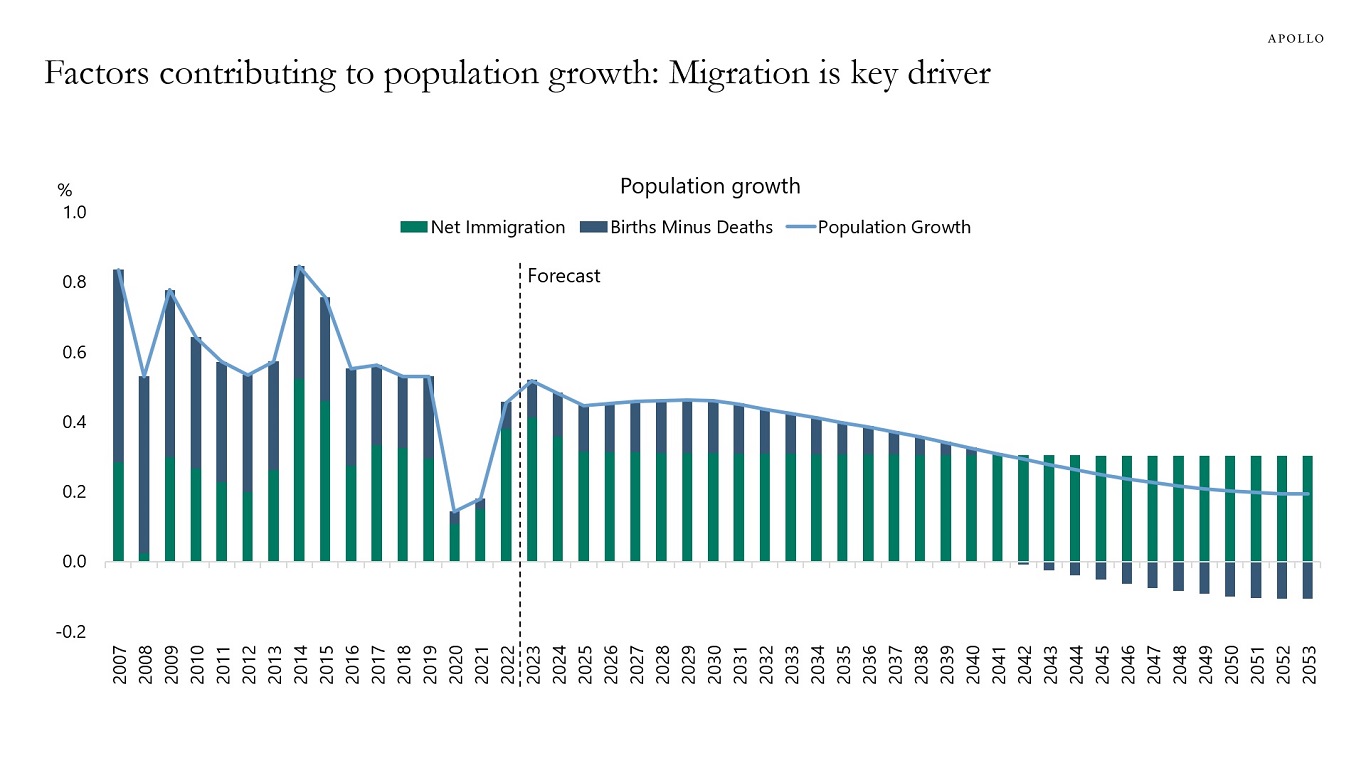
Source: The 2023 Long-Term Budget Outlook, CBO, Apollo Chief Economist See important disclaimers at the bottom of the page.
-
Fed hikes are increasingly impacting coverage ratios for highly leveraged companies, but the composition of coverage ratios remains similar to what we saw from 2012 to 2020, see chart below.

Source: Pitchbook LCD, Apollo Chief Economist See important disclaimers at the bottom of the page.
-
The Fed’s inflation target is 2%, and the bottom line of the inflation discussion is that inflation has started to move sideways at 3%, and this is a problem for the Fed, see chart below.
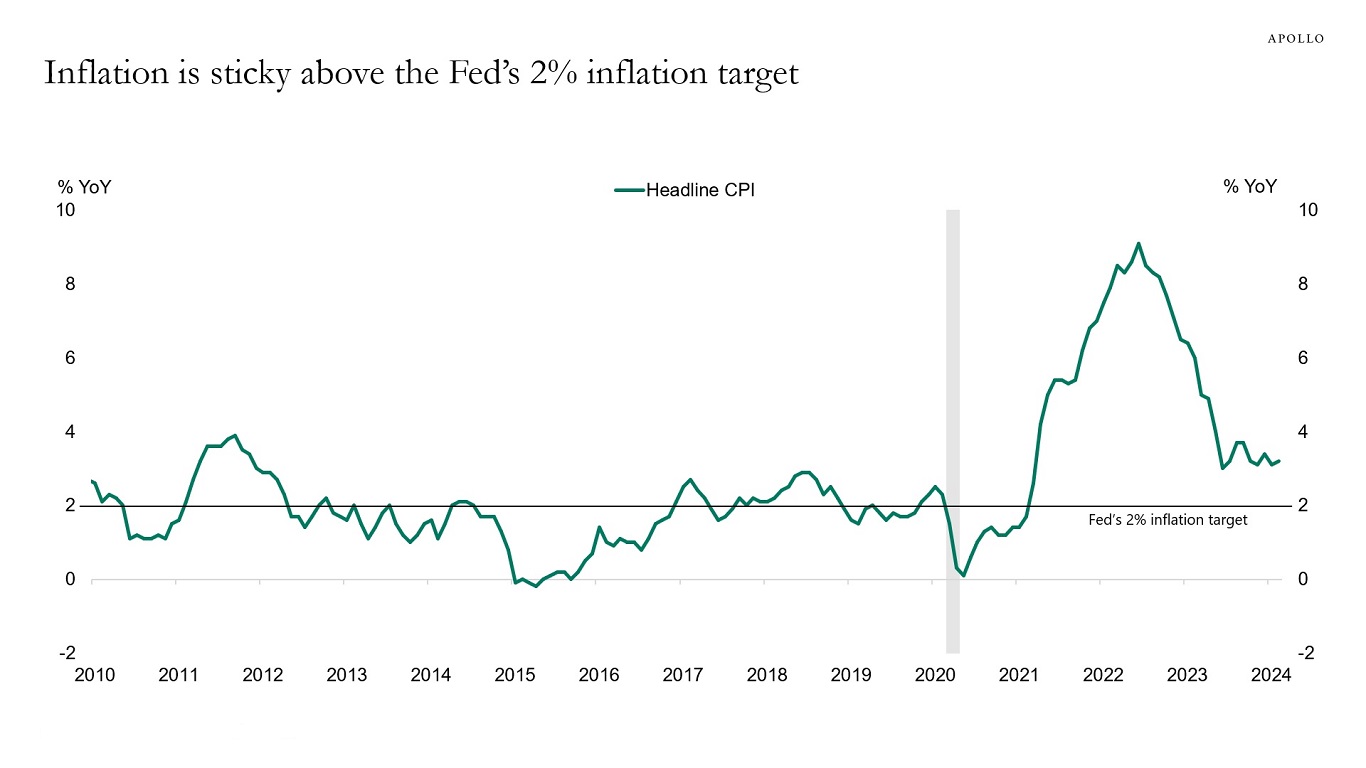
Source: BLS, Haver Analytics, Apollo Chief Economist See important disclaimers at the bottom of the page.
-
Container transportation prices are slowly coming down from their peaks, but IMF data shows that traffic volumes through the Suez Canal continue to deteriorate, see chart below.
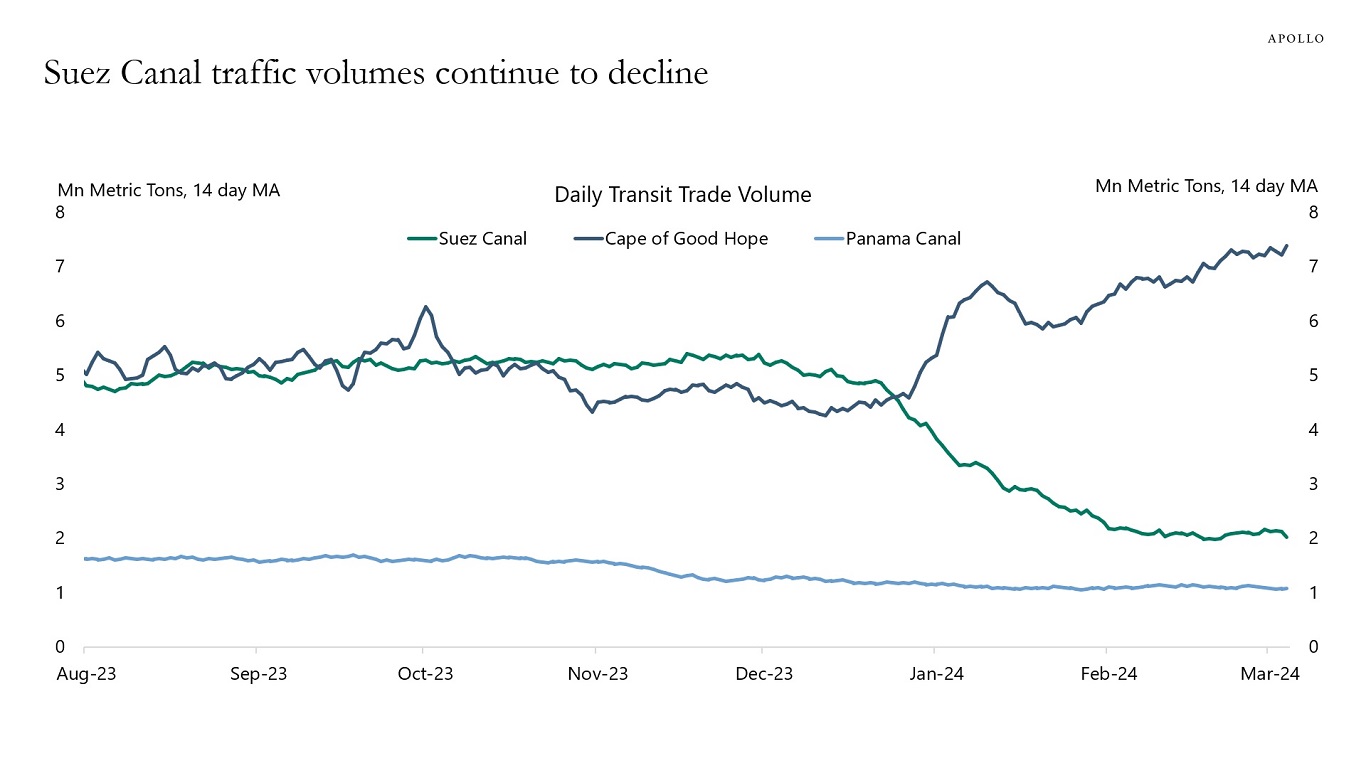
Source: IMF, Apollo Chief Economist See important disclaimers at the bottom of the page.


This presentation may not be distributed, transmitted or otherwise communicated to others in whole or in part without the express consent of Apollo Global Management, Inc. (together with its subsidiaries, “Apollo”).
Apollo makes no representation or warranty, expressed or implied, with respect to the accuracy, reasonableness, or completeness of any of the statements made during this presentation, including, but not limited to, statements obtained from third parties. Opinions, estimates and projections constitute the current judgment of the speaker as of the date indicated. They do not necessarily reflect the views and opinions of Apollo and are subject to change at any time without notice. Apollo does not have any responsibility to update this presentation to account for such changes. There can be no assurance that any trends discussed during this presentation will continue.
Statements made throughout this presentation are not intended to provide, and should not be relied upon for, accounting, legal or tax advice and do not constitute an investment recommendation or investment advice. Investors should make an independent investigation of the information discussed during this presentation, including consulting their tax, legal, accounting or other advisors about such information. Apollo does not act for you and is not responsible for providing you with the protections afforded to its clients. This presentation does not constitute an offer to sell, or the solicitation of an offer to buy, any security, product or service, including interest in any investment product or fund or account managed or advised by Apollo.
Certain statements made throughout this presentation may be “forward-looking” in nature. Due to various risks and uncertainties, actual events or results may differ materially from those reflected or contemplated in such forward-looking information. As such, undue reliance should not be placed on such statements. Forward-looking statements may be identified by the use of terminology including, but not limited to, “may”, “will”, “should”, “expect”, “anticipate”, “target”, “project”, “estimate”, “intend”, “continue” or “believe” or the negatives thereof or other variations thereon or comparable terminology.