


Want it delivered daily to your inbox?
-
Weakest Links are loan issuers rated B-minus or lower with a negative outlook.
The number of US leveraged loan Weakest Links continues to increase, driven by higher costs of capital and costlier financing terms, see chart below.
This is how monetary policy works. Higher cost of capital makes it harder for more vulnerable companies to get financing.
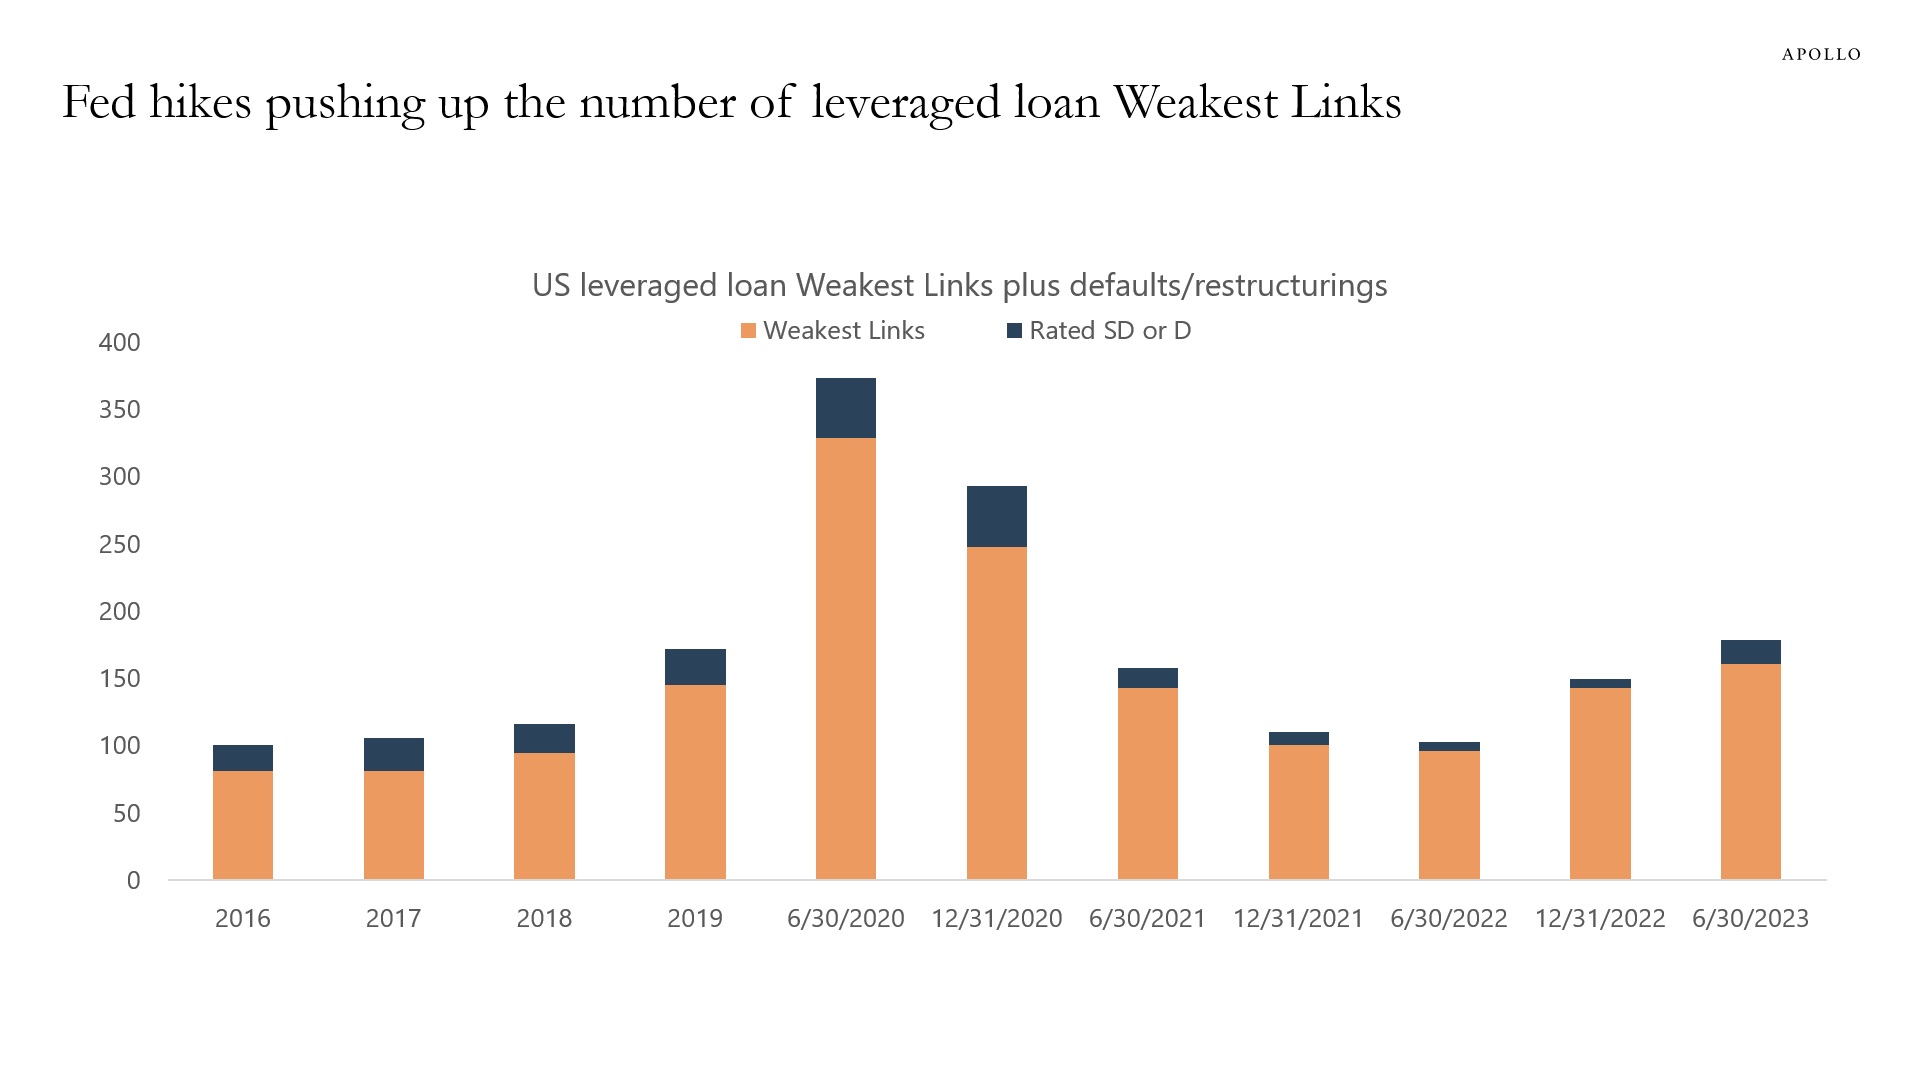
Source: Pitchbook | LCD, Morningstar LSTA US Leveraged Loan Index, Apollo Chief Economist. Data through June 30, 2023. Note: SD and D – An obligor rated “SD” (Selective Default) or “D” has failed to pay one or more of its financial obligations (rated or unrated) when it came due. A “D” rating is assigned when Standard & Poor’s believes that the default will be a general default and that the obligor will fail to pay all or substantially all of its obligations as they come due. An “SD” rating is assigned when Standard & Poor’s believes that the obligor has selectively defaulted on a specific issue or class of obligations, but it will continue to meet its payment obligations on other issues or classes of obligations in a timely manner. See important disclaimers at the bottom of the page.
-
The costs of capital have increased because of Fed hikes and tighter credit conditions. As a result, there are firms every day that cannot get a new loan or refinance their maturing loan.
This is how monetary policy works. Higher costs of capital slow down financings and, ultimately, growth and inflation.
With the Fed saying that interest rates will stay high for “a couple of years,” this process will continue to slow down the economy. Our outlook for regional banks is available here and documents current trends in detail.
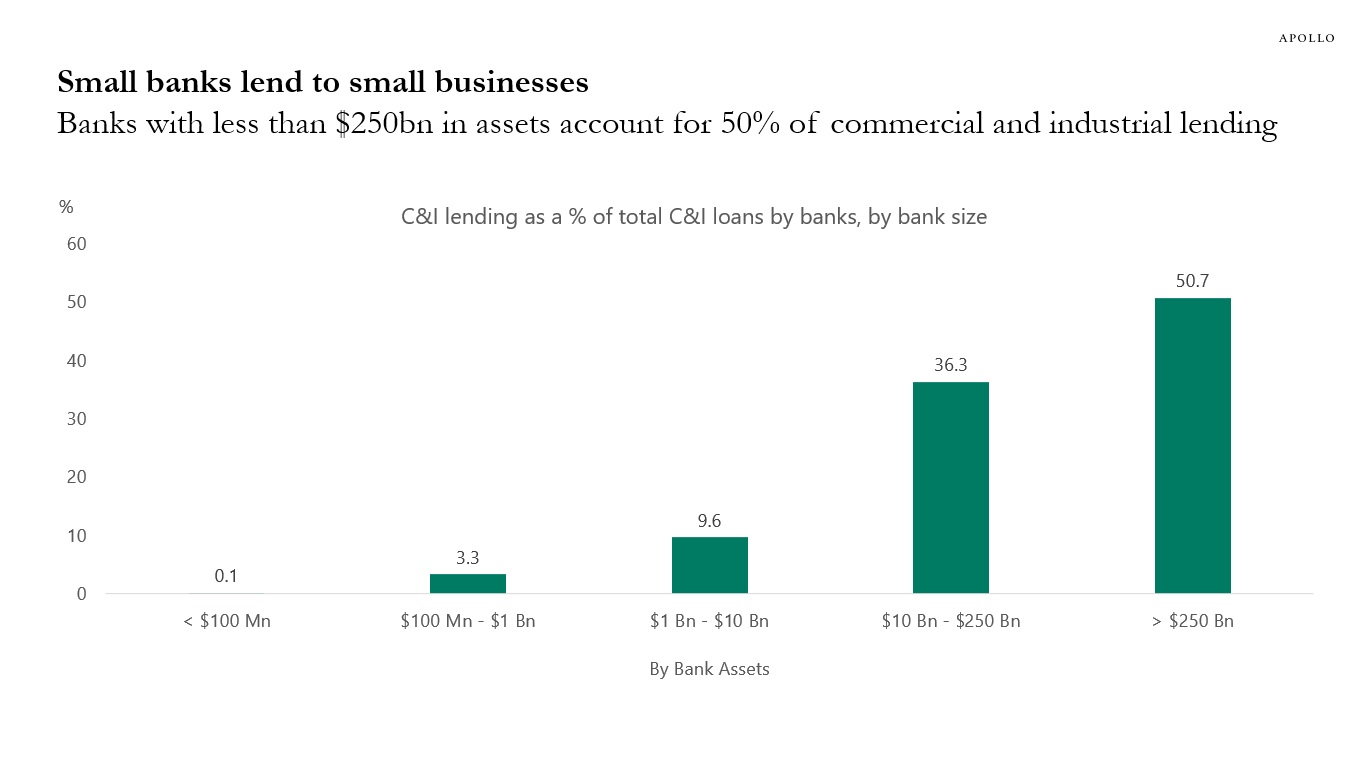
Source: FDIC, Apollo Chief Economist. Data as of Q3 2022. 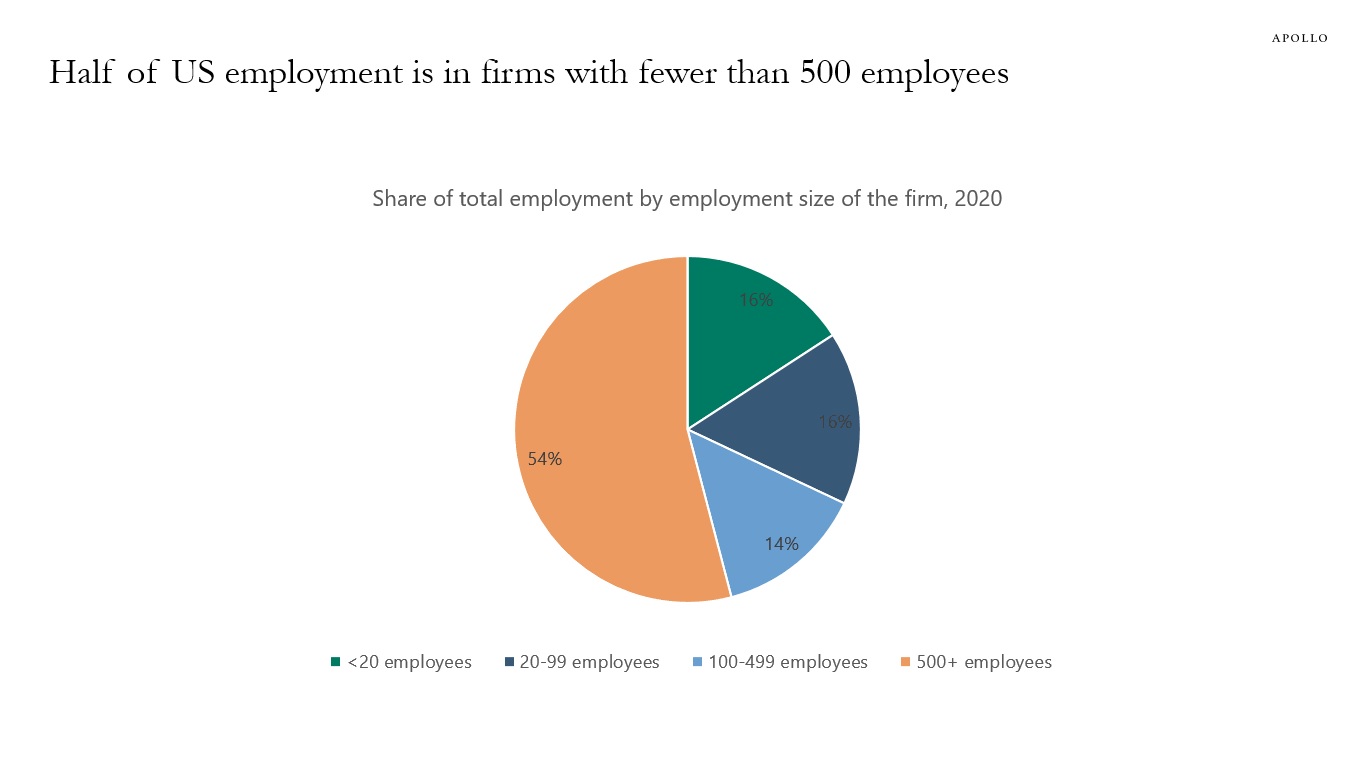
Source: Census, Apollo Chief Economist 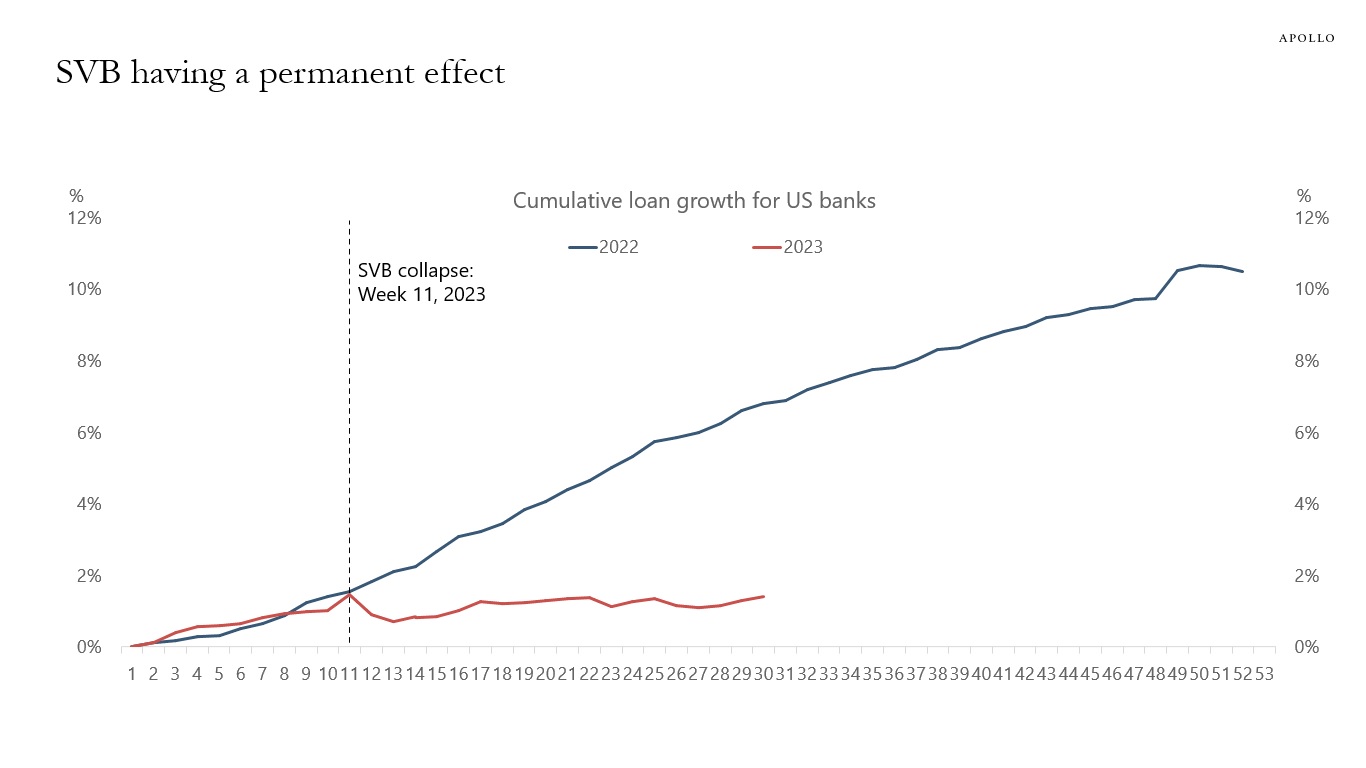
Source: FRB, Bloomberg, Apollo Chief Economist 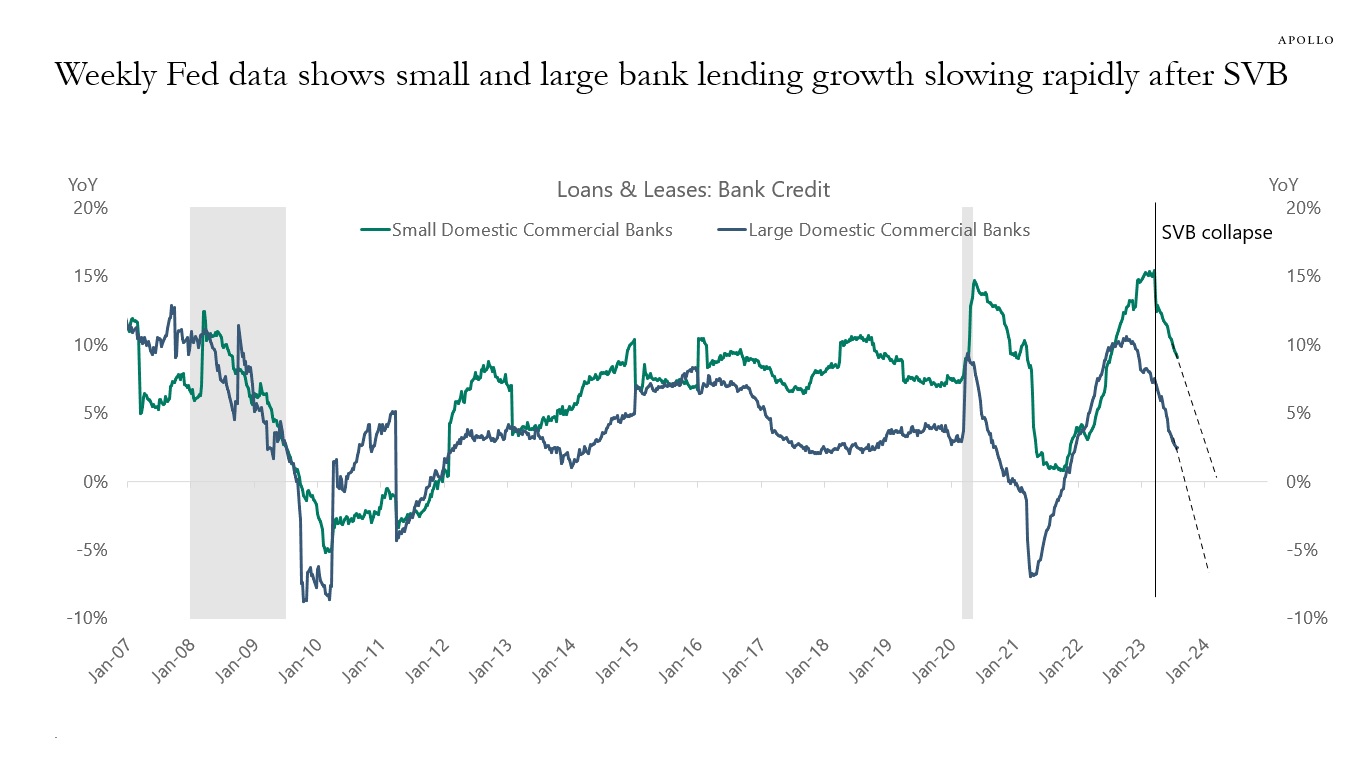
Source: Federal Reserve Board, Haver Analytics, Apollo Chief Economist 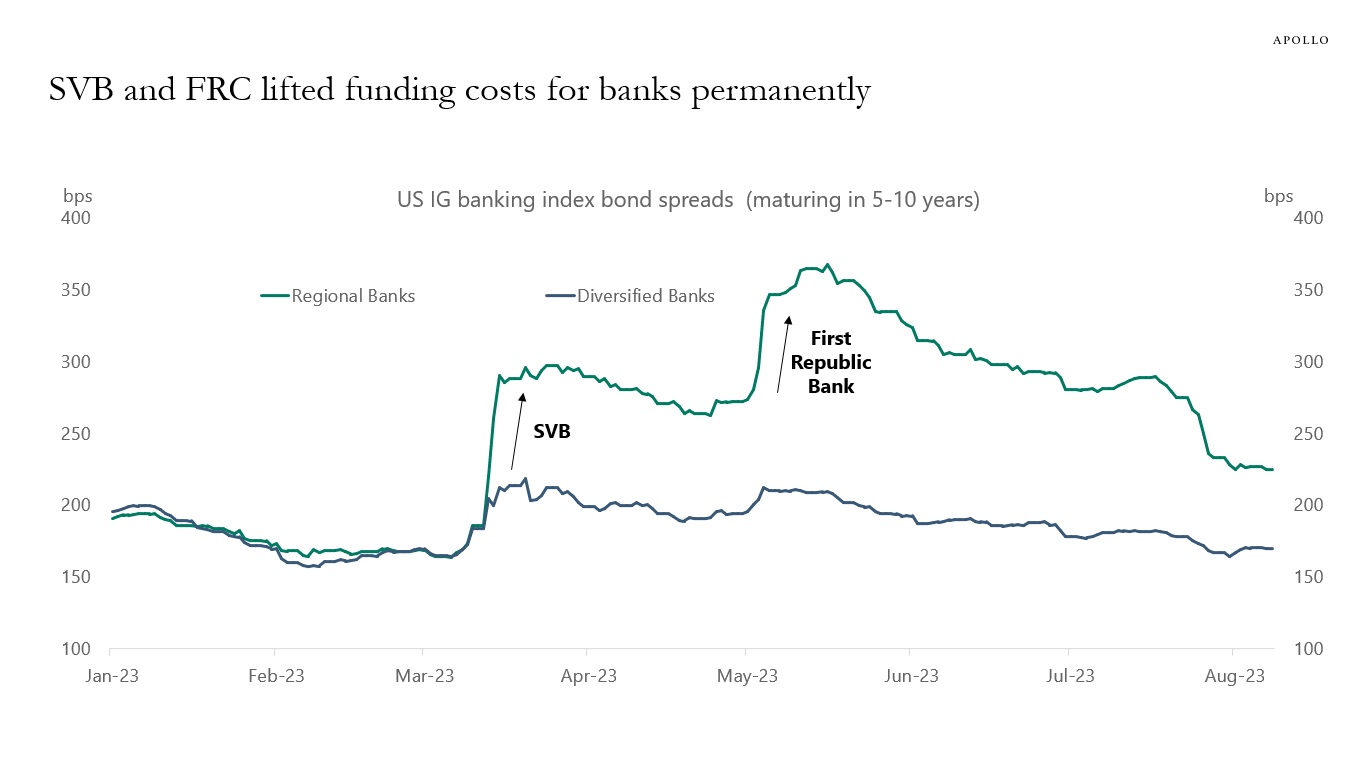
Source: ICE BofA, Bloomberg, Apollo Chief Economist. Note: Unweighted average spreads of bonds from ICE 5-10 Year US Banking Index, C6PX Index for bonds issued before Jan 1, 2023. There are eight banks in the Regional index and 41 banks in the Diversified index. Regional banks include BankUnited, Citizens Financial, Huntington, and Zions. Diversified banks include JP Morgan, Citibank, and Bank of America. 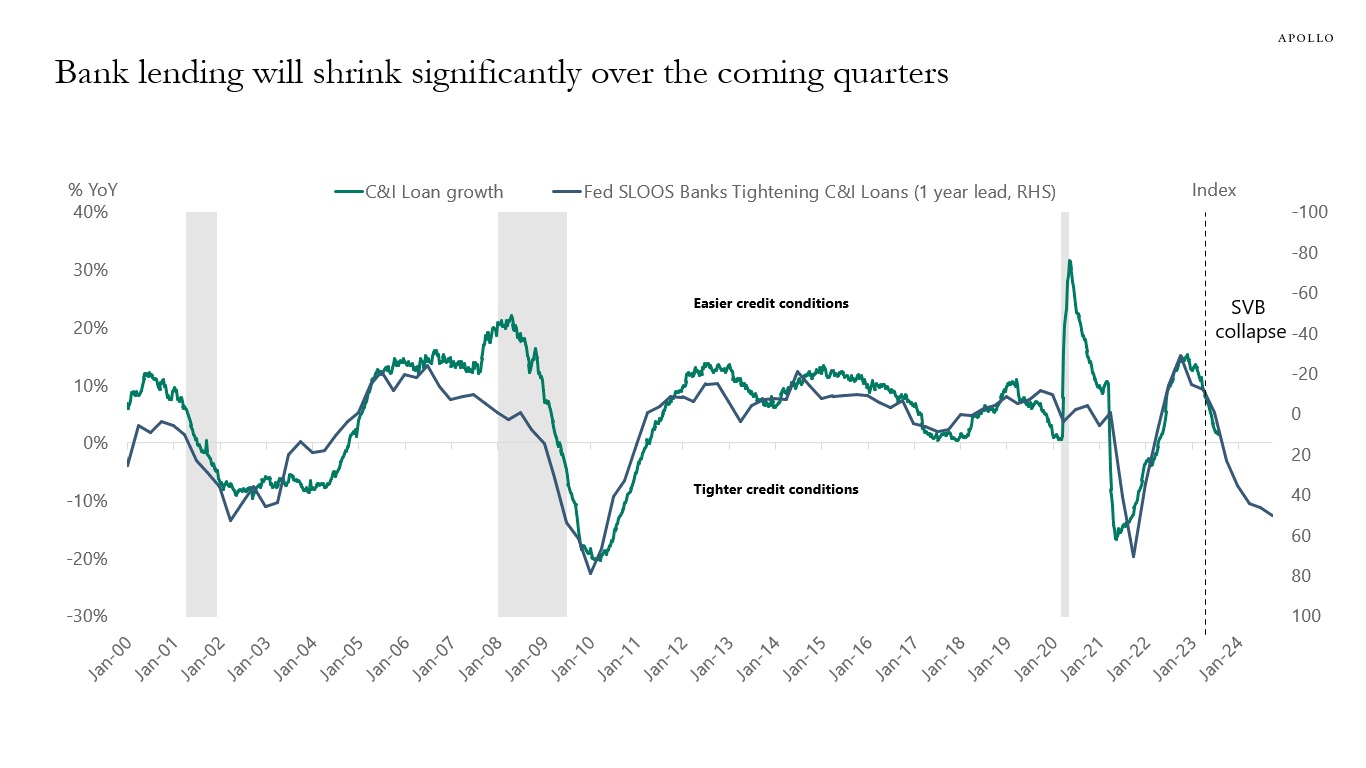
Source: FRB, Haver Analytics, Apollo Chief Economist 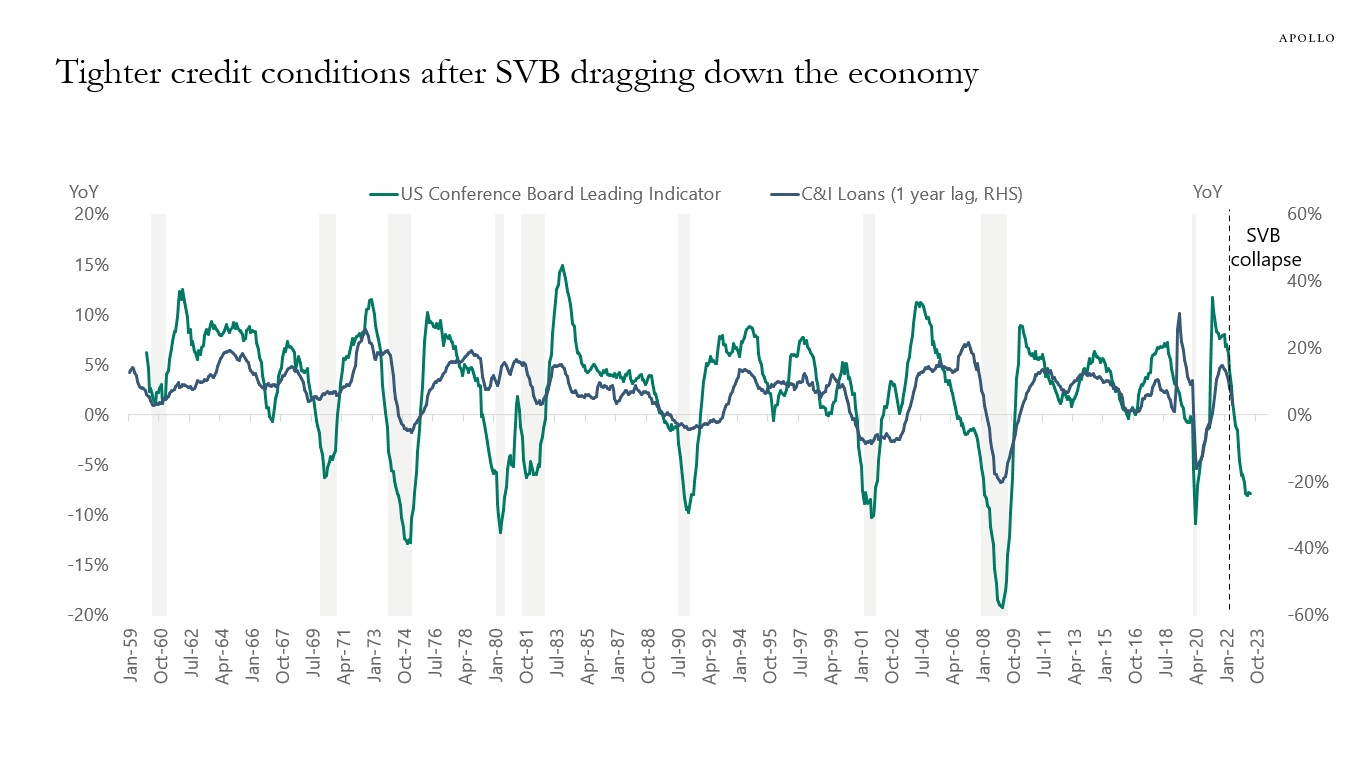
Source: Conference Board, FRB, Haver Analytics, Apollo Chief Economist 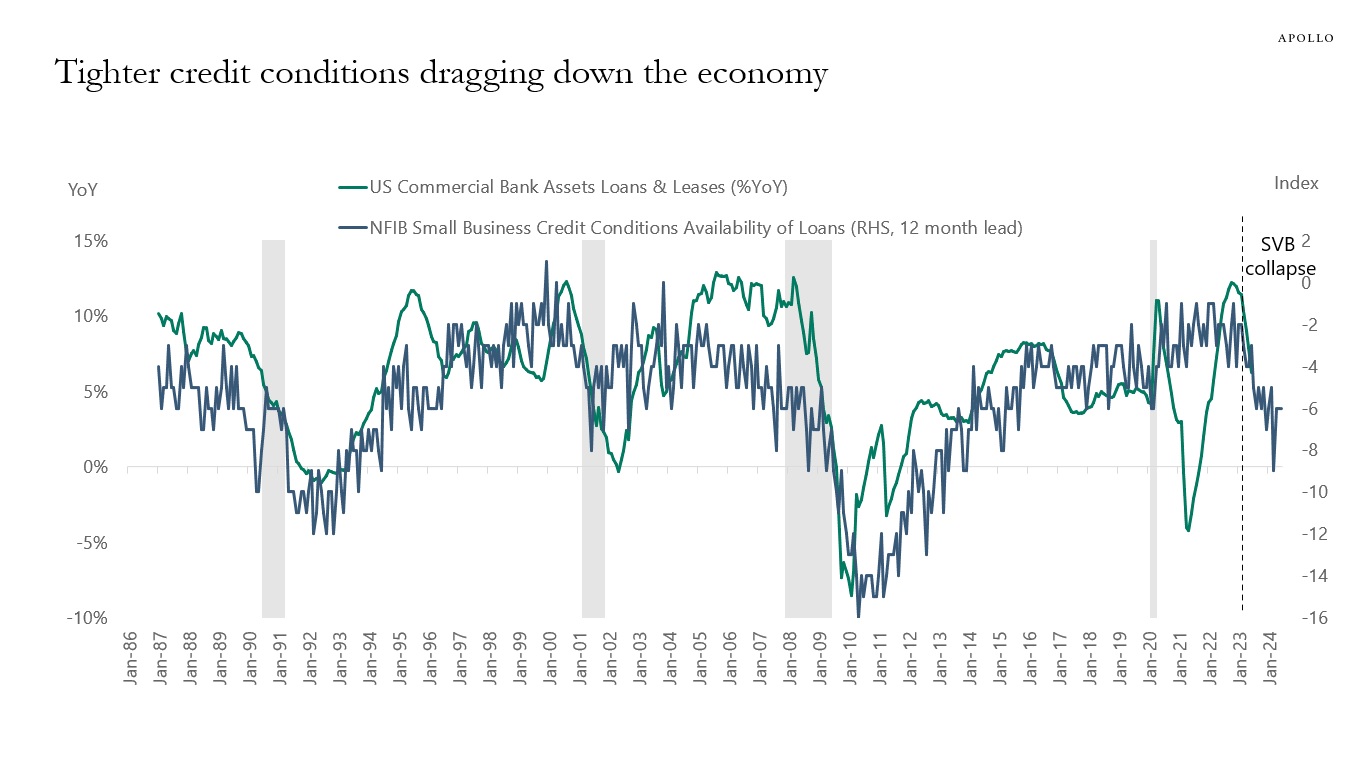
Source: NFIB, FRB, Bloomberg, Apollo Chief Economist 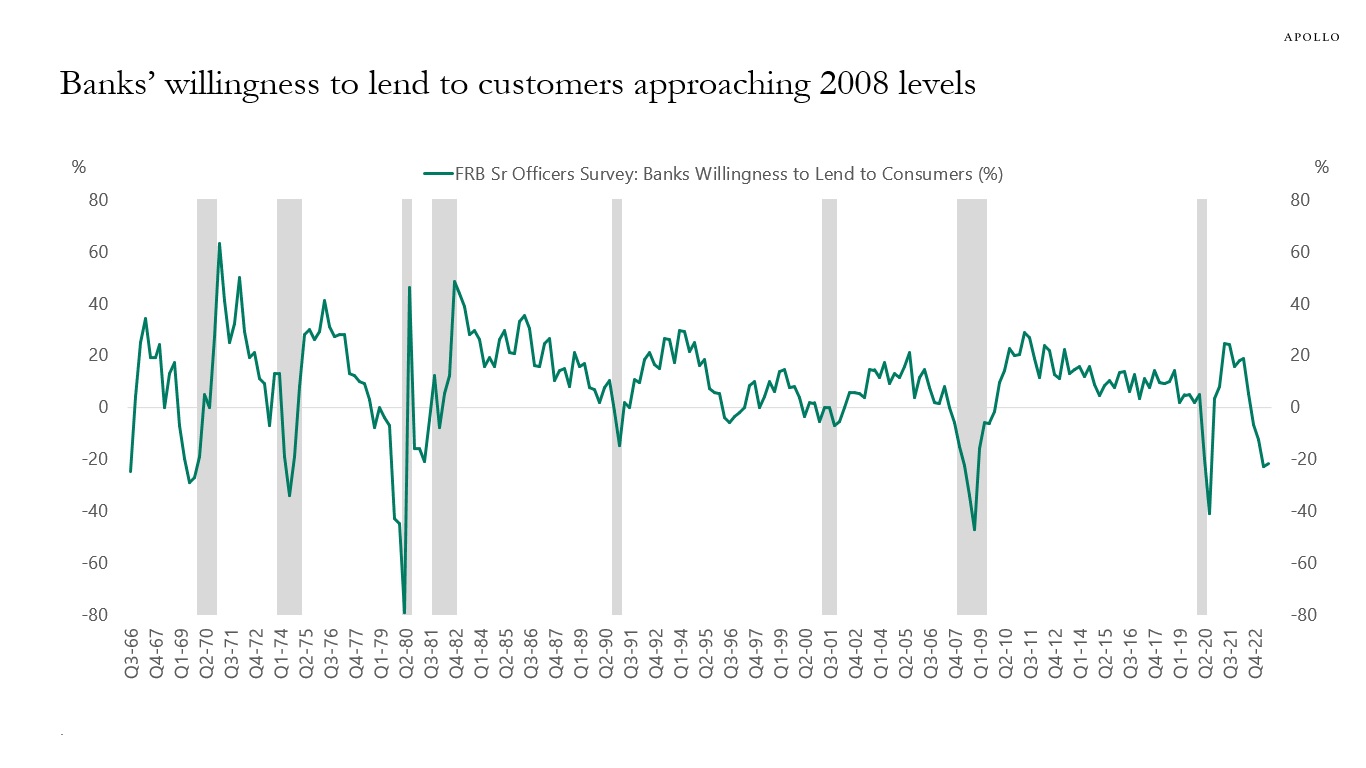
Source: FRB, Bloomberg, Apollo Chief Economist 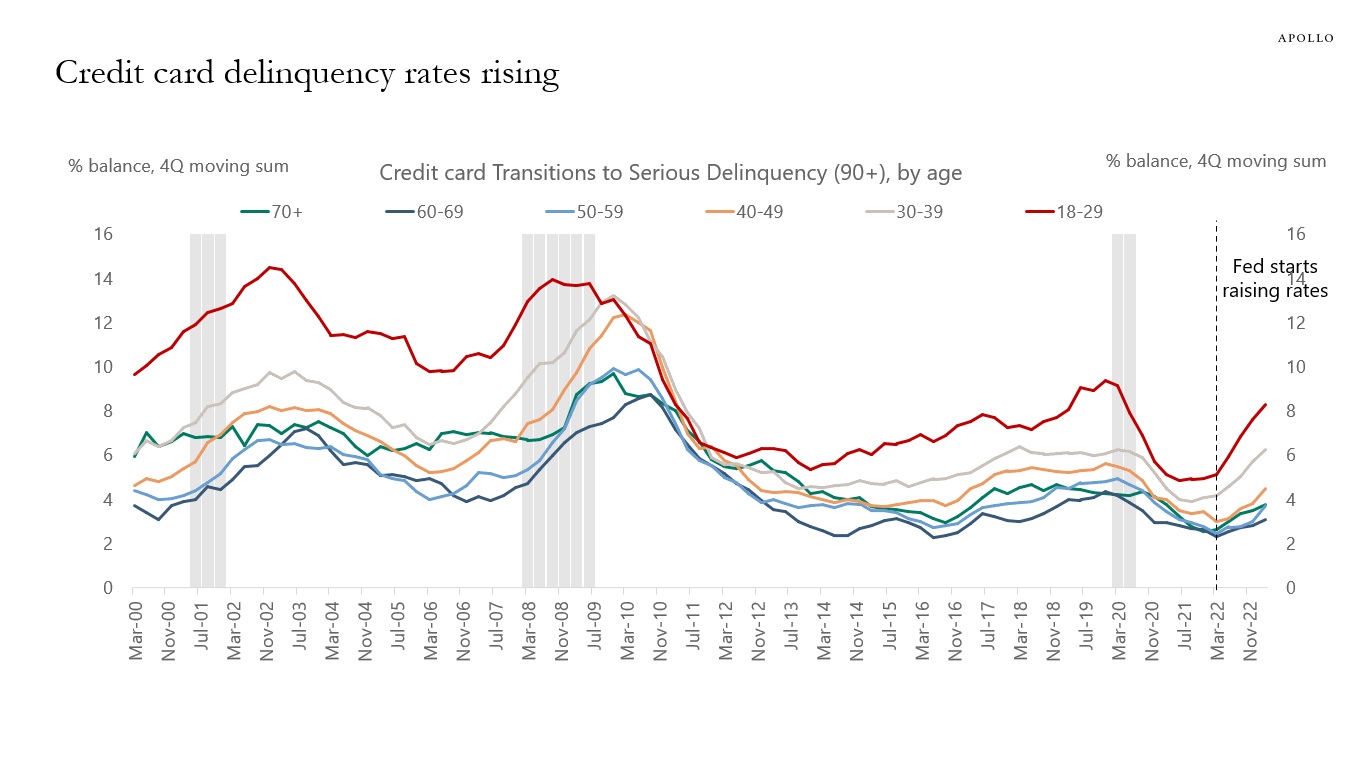
Source: New York Fed Consumer Credit Panel / Equifax, Apollo Chief Economist 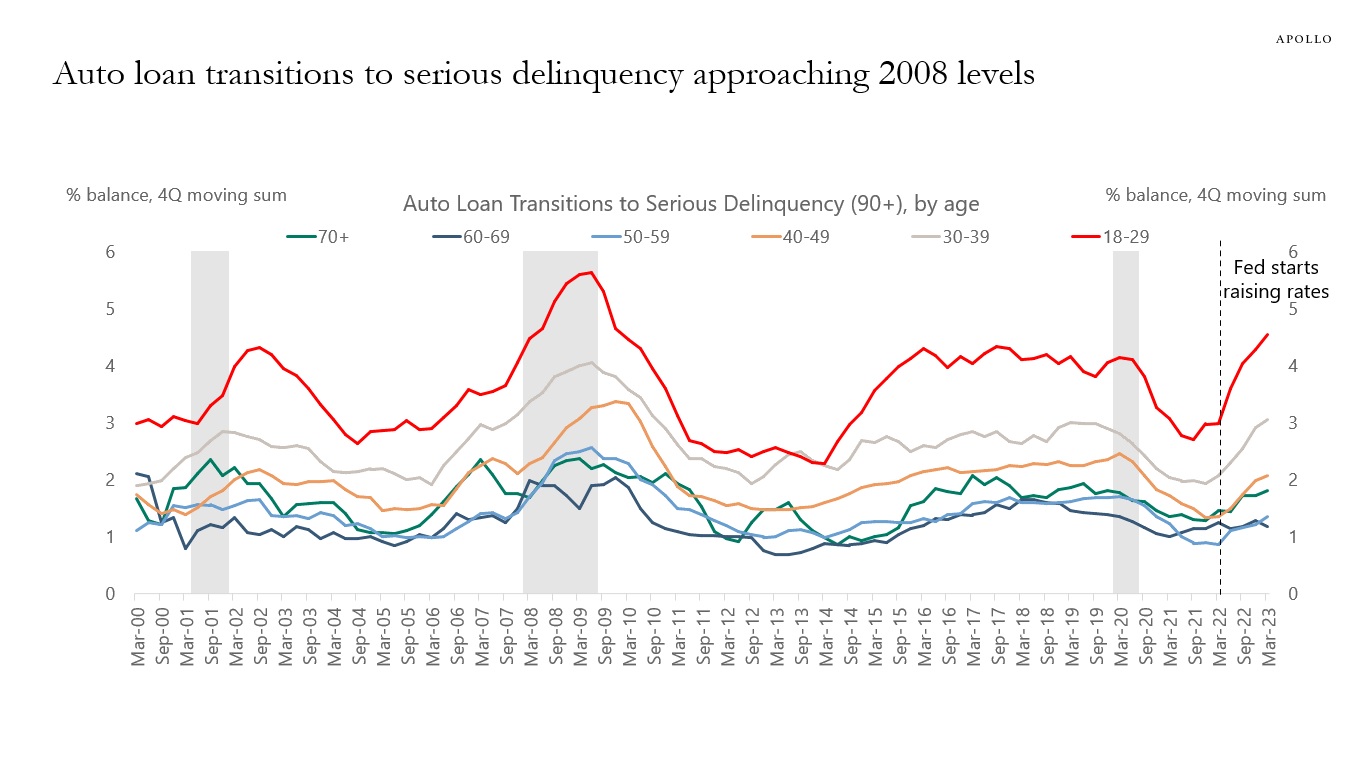
Source: FRBNY Consumer Credit Panel, Equifax, Haver Analytics, Apollo Chief Economist See important disclaimers at the bottom of the page.
-
The Fed started raising rates in March 2022, and the effects are clear. Higher costs of capital have pushed more and more companies into bankruptcy. This is the idea behind raising rates: to slow the economy down with the ultimate goal of getting inflation back to 2%. Every day there are companies that cannot get new loans or refinance, and this trend higher in bankruptcies will continue as long as interest rates stay high.
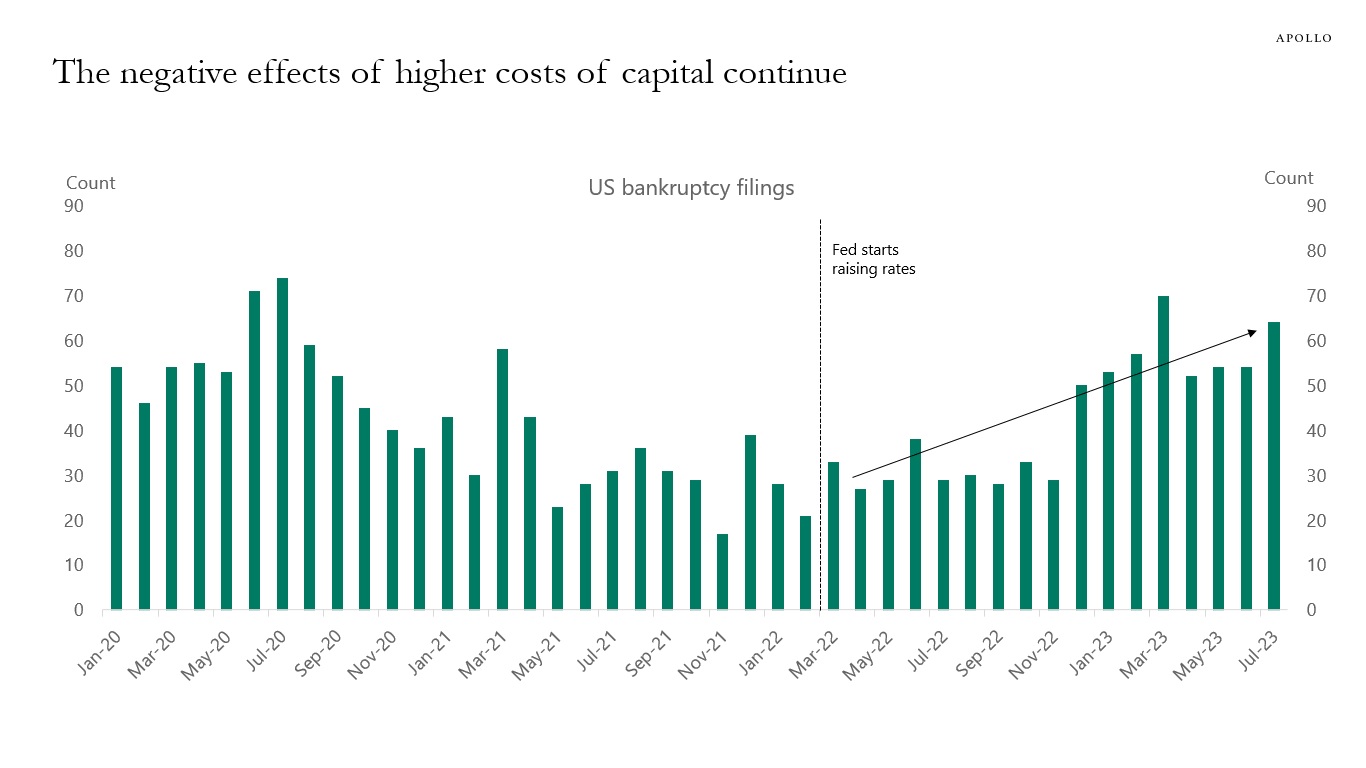
Source: S&P Capital IQ, Bloomberg, Apollo Chief Economist. Note: Bankruptcy figures include public companies or private companies with public debt with a minimum of $2 million in assets or liabilities at the time of filing, in addition to private companies with at least $10 million in assets or liabilities. See important disclaimers at the bottom of the page.
-
Arguments for US long rates moving higher are QT, the large government budget deficit, BoJ YCC exit, and the significant amount of T-bills outstanding, which need to be rolled into longer-dated Treasury bonds and notes, see chart below.
Arguments for US long rates moving lower are peaking inflation, slowing growth, and the Fed being done with raising rates.
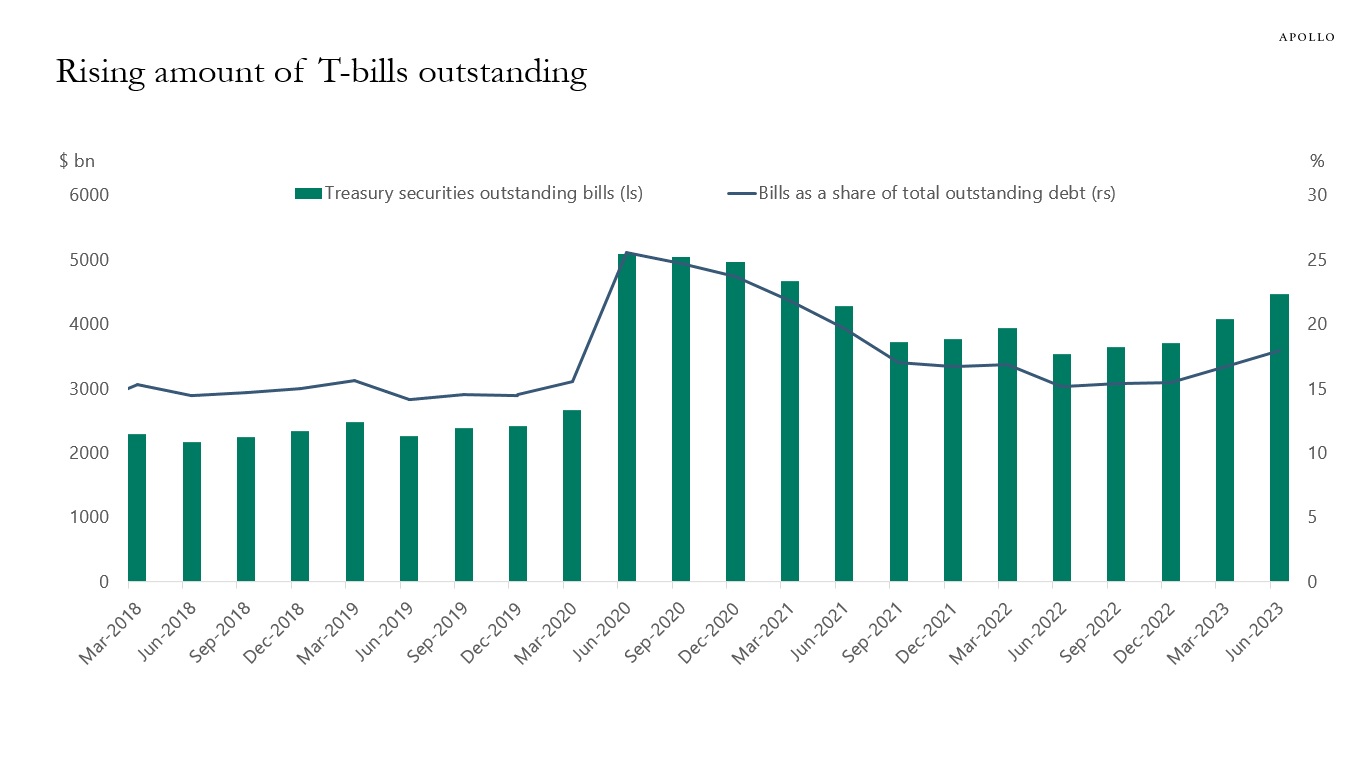
Source: US Treasury, Haver, Apollo Chief Economist See important disclaimers at the bottom of the page.
-
Fed hikes had an immediate negative effect on the manufacturing sector because the goods sector is more sensitive to interest rates.
With interest rates remaining high and consumers running out of excess savings, the next shoe to drop in 2023H2 is the service sector.
The divergence between manufacturing and services is likely why high yield spreads have not yet widened the way they usually do, see chart below.
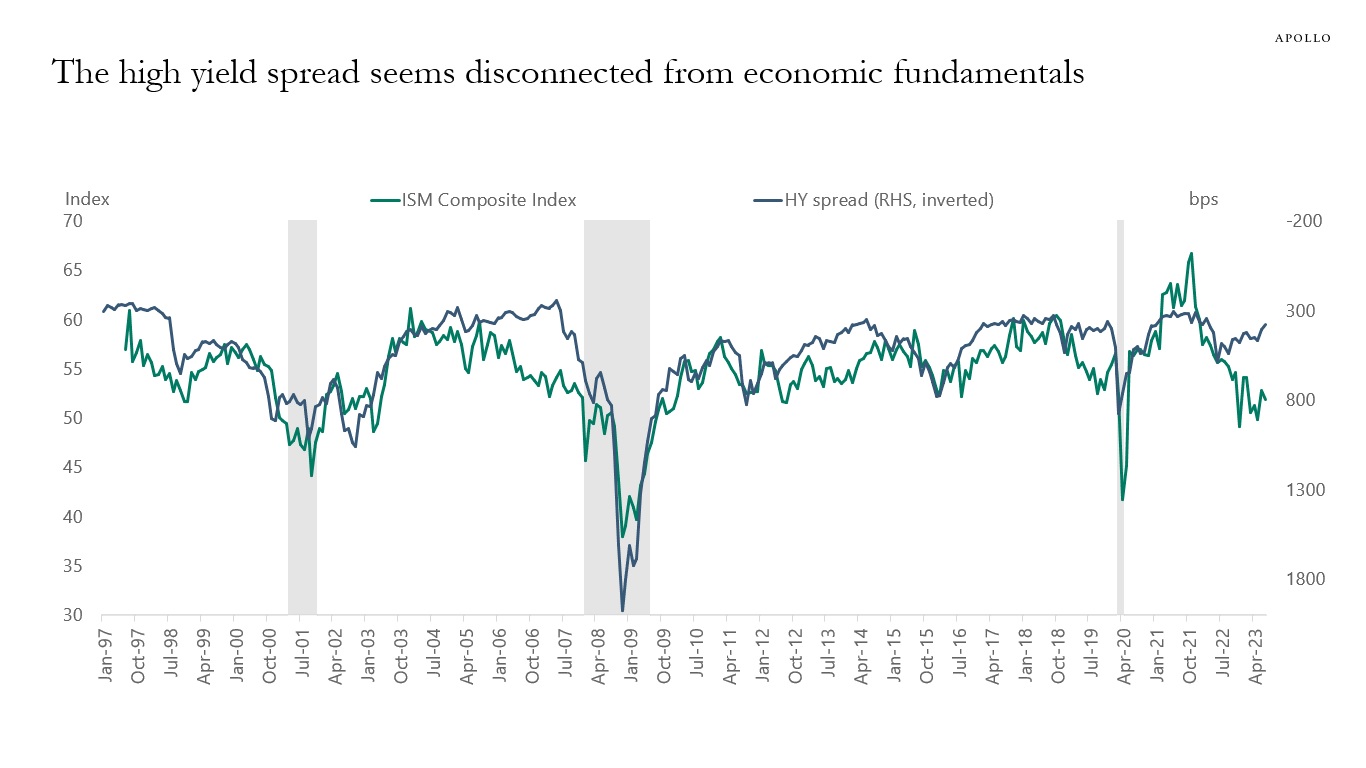
Source: ISM, ICE BofA, Haver Analytics, Apollo Chief Economist See important disclaimers at the bottom of the page.
-
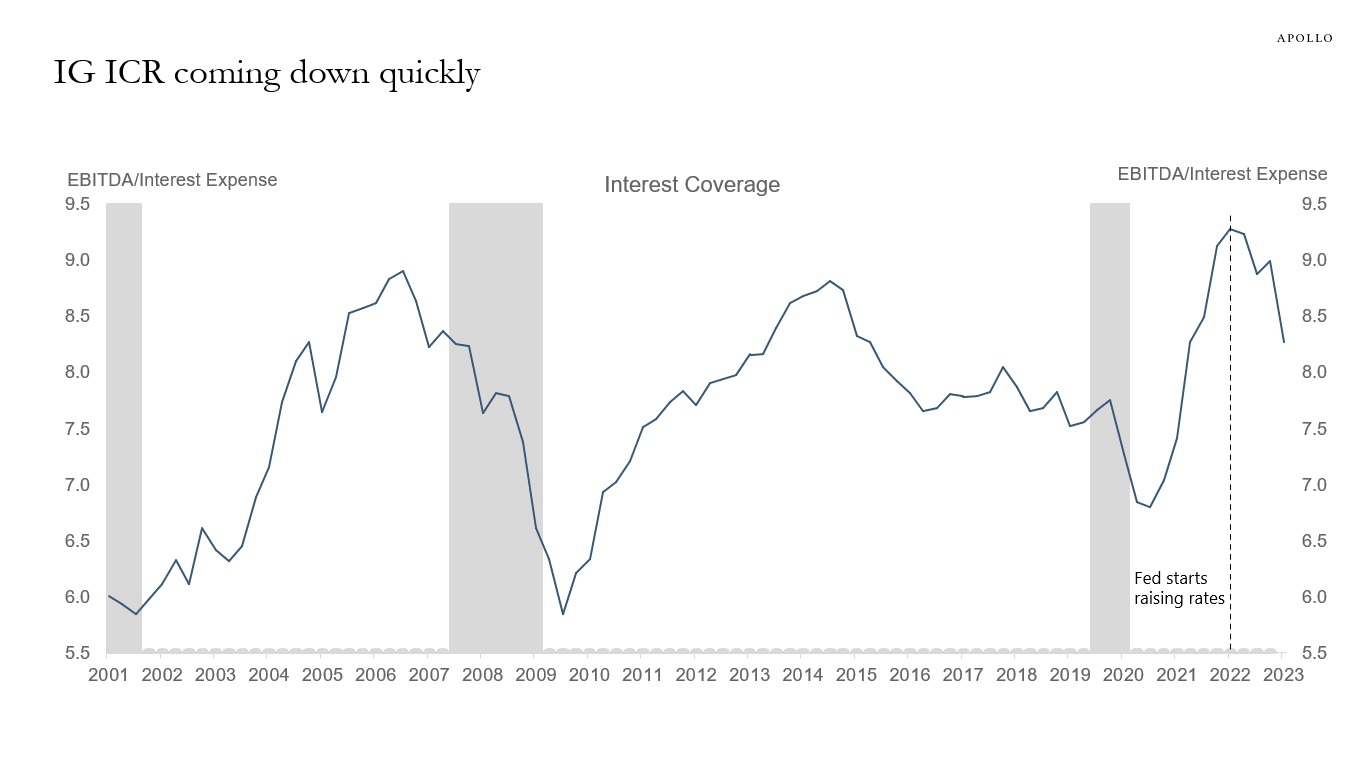
Since the Fed started raising rates, credit fundamentals have continued to deteriorate. The higher cost of capital is putting significant downward pressure on interest coverage ratios across IG, HY, and loans. Cash flow coverage is declining, and leverage is rising, see charts below.
The pressure on corporate balance sheets is the direct result of the Fed keeping the costs of capital at high levels, and with rates staying high for a couple of years, the ongoing deterioration in credit fundamentals will continue to have a negative impact on employment growth and capex spending, and ultimately GDP.
Our credit market outlook is available here.
Source: Bloomberg, Apollo Chief Economist 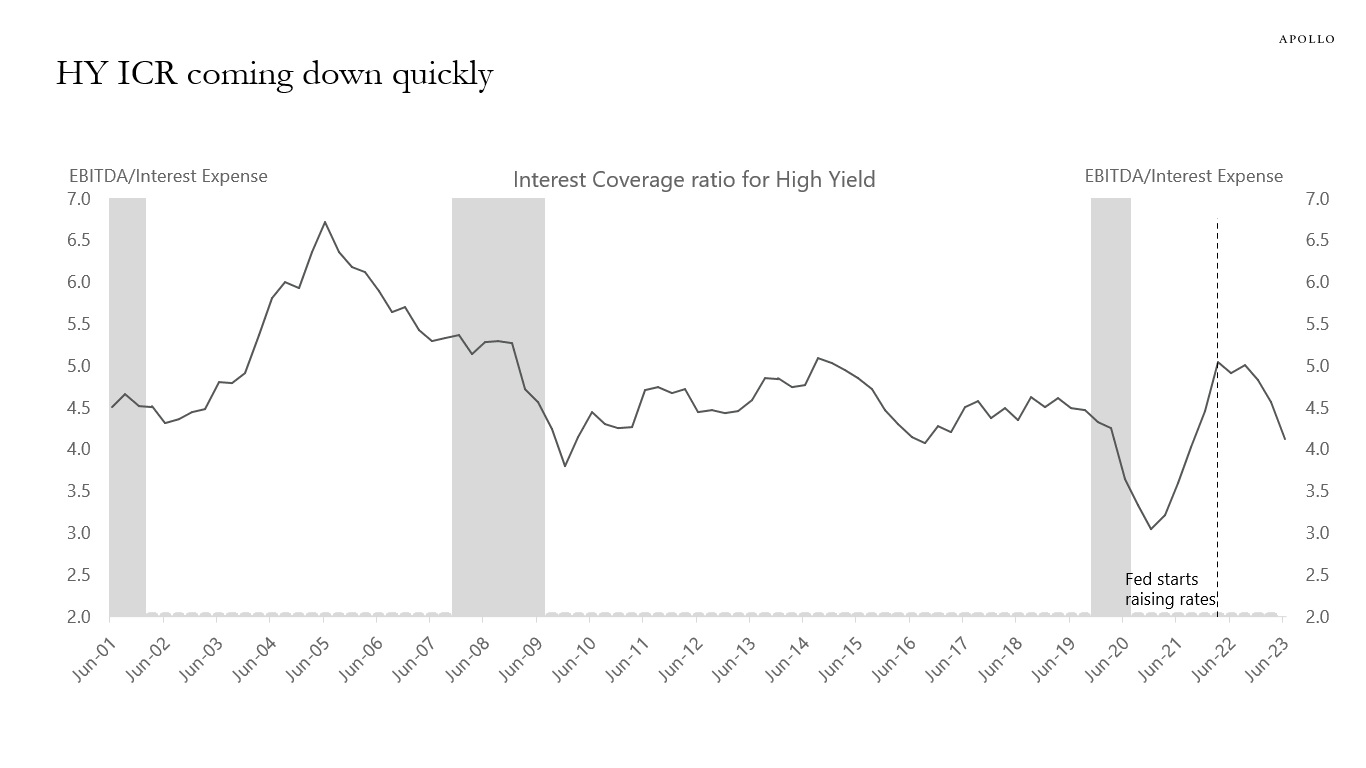
Source: Bloomberg, Apollo Chief Economist 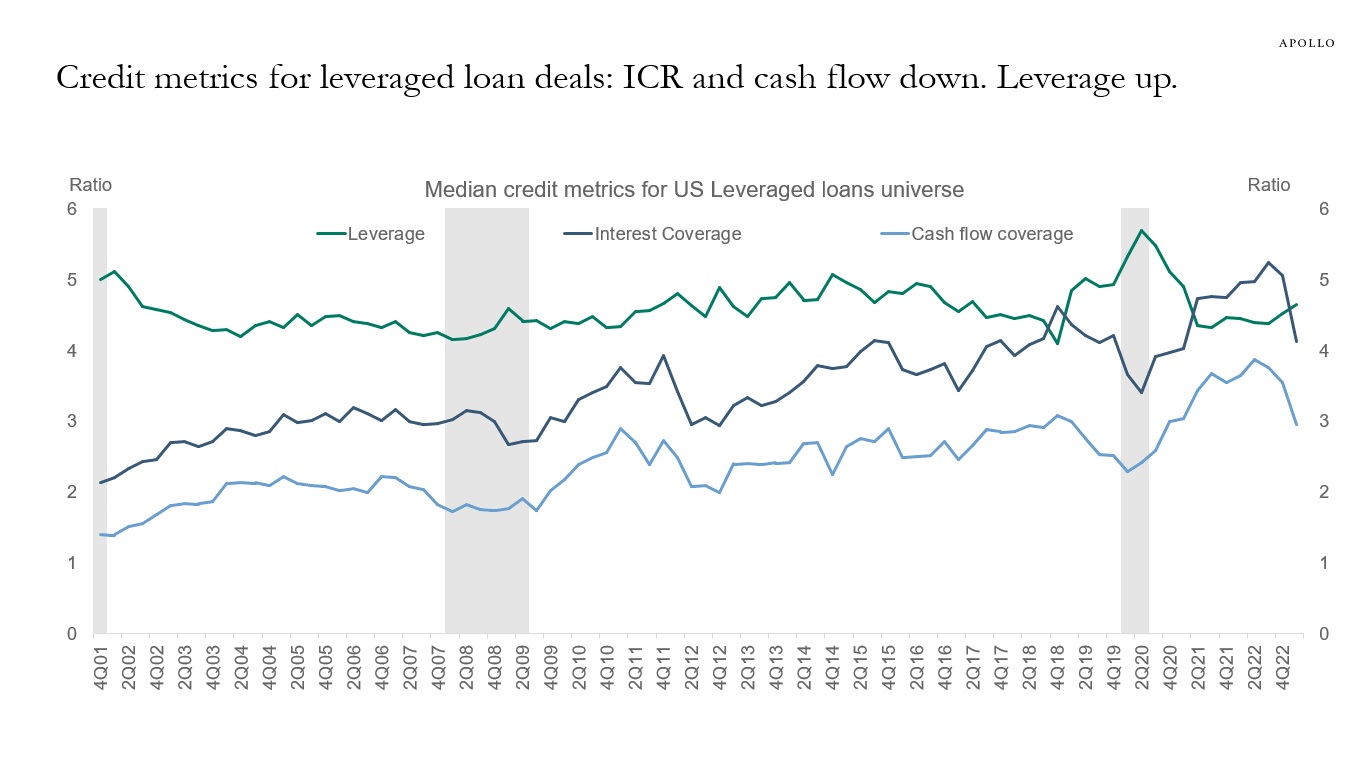
Source: Pitchbook LCD, Apollo Chief Economist See important disclaimers at the bottom of the page.
-
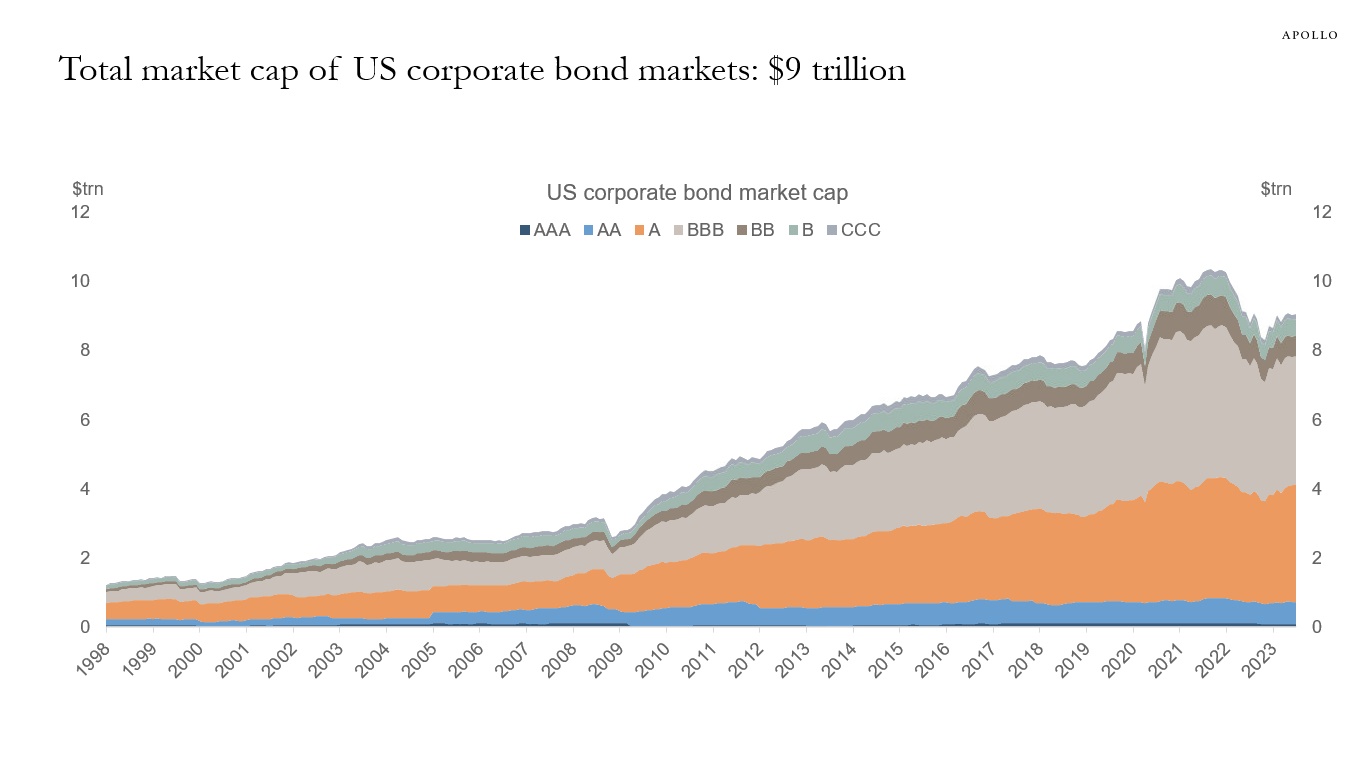
The total market cap of US corporate bond markets is now at $9 trillion. BBB market cap is currently at $3.7 trillion, and single-A is at $3.4 trillion, see chart below.
Source: ICE BofA, Bloomberg, Apollo Chief Economist See important disclaimers at the bottom of the page.
-
Financials have a weight of almost 50% in the European IG index and 33% in the US IG index, see chart below. For the high yield index, financials also have a higher weight in Europe than in the US. For the US, the sectors with the biggest weight in the HY index are consumer discretionary, communications, and energy.

Source: Bloomberg Barclays, Bloomberg, Apollo Chief Economist 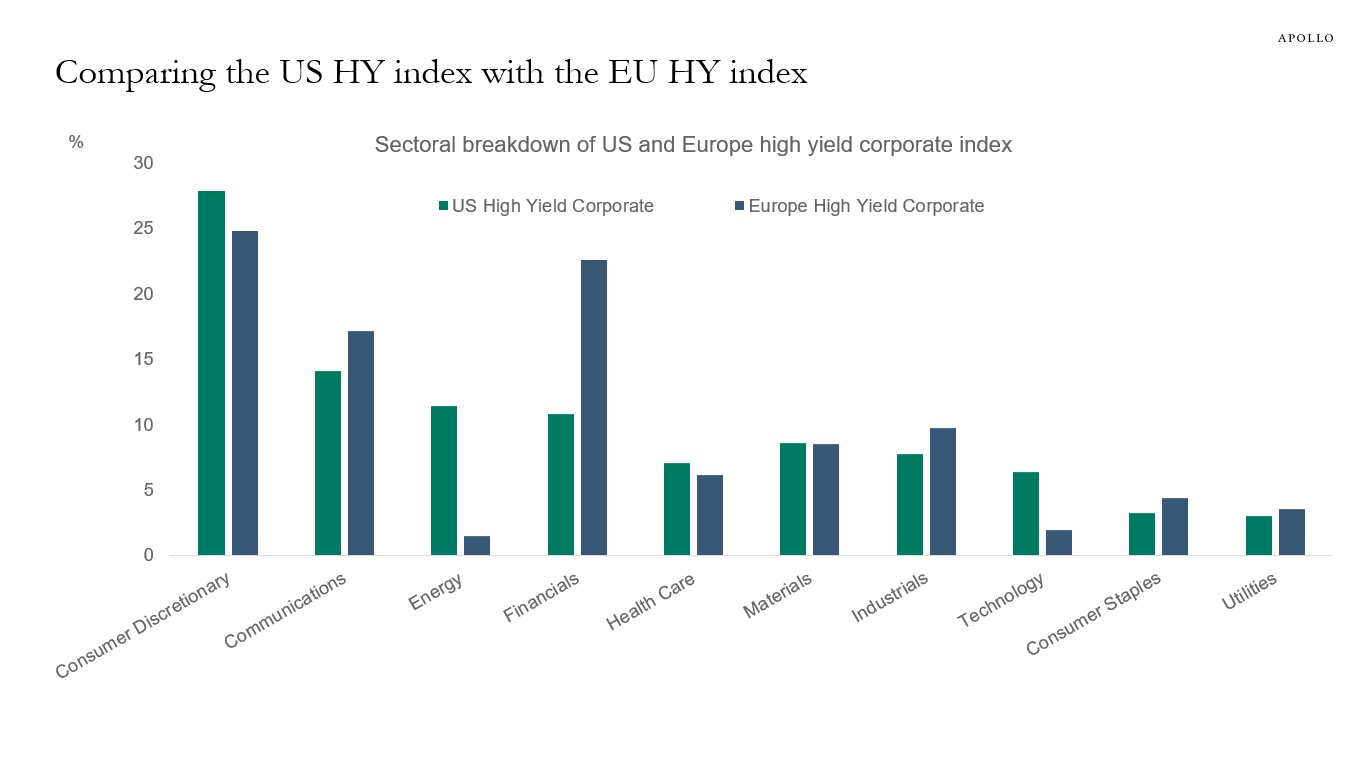
Source: Bloomberg Barclays, Bloomberg, Apollo Chief Economist See important disclaimers at the bottom of the page.
-
Ninety-one percent of US investment grade bonds are trading below par, see chart below.

Source: Bloomberg, Apollo Chief Economist. Note: Data used for members in the LBUSTRUU Index. See important disclaimers at the bottom of the page.
-
Modified duration measures the expected change in a bond’s price to a 1% change in interest rates. The charts below show that since the Fed started raising rates, index duration has declined both for high yield and investment grade, with high yield duration currently standing at 4% and investment grade duration at 7.5%.
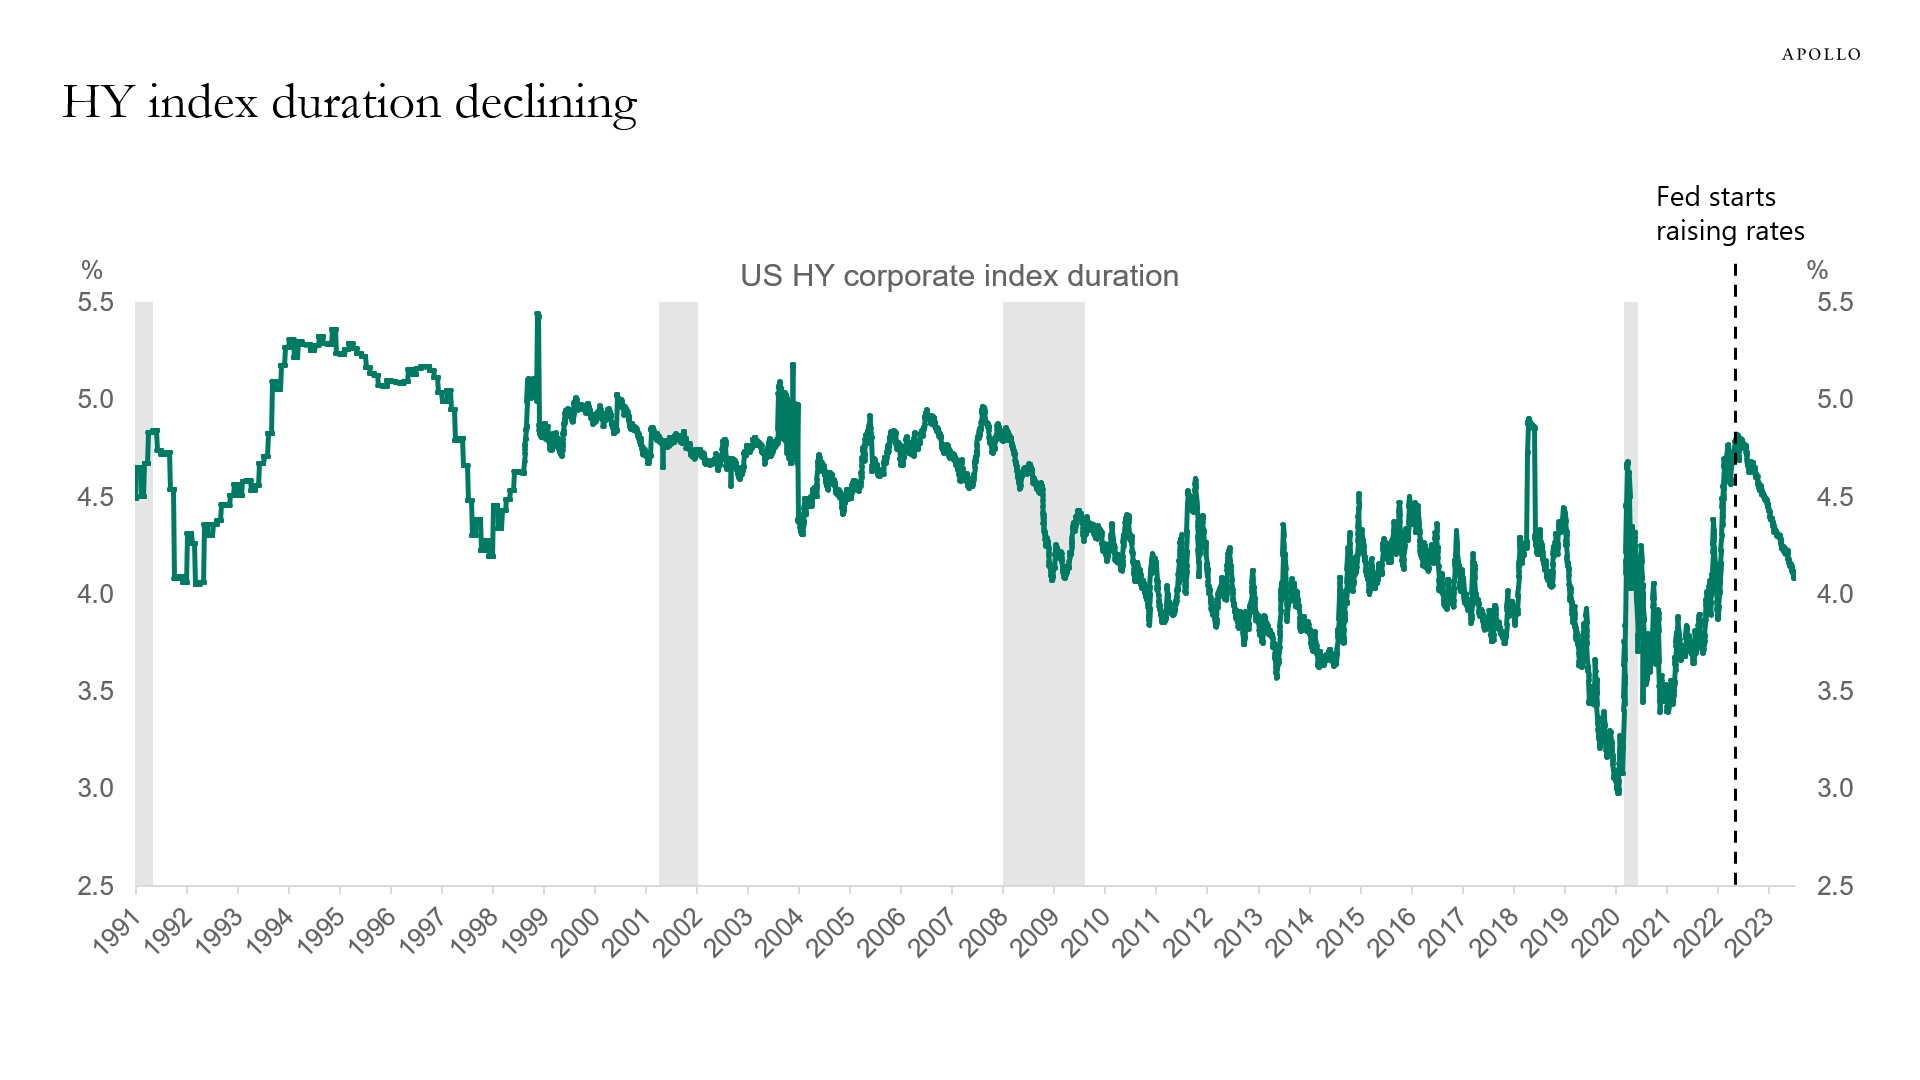
Source: Bloomberg, Apollo Chief Economist. Note: The measure used is modified duration, which measures the expected change in a bond’s price to a 1% change in interest rates. 
Source: Bloomberg, Apollo Chief Economist. Note: The measure used is modified duration, which measures the expected change in a bond’s price to a 1% change in interest rates. See important disclaimers at the bottom of the page.

This presentation may not be distributed, transmitted or otherwise communicated to others in whole or in part without the express consent of Apollo Global Management, Inc. (together with its subsidiaries, “Apollo”).
Apollo makes no representation or warranty, expressed or implied, with respect to the accuracy, reasonableness, or completeness of any of the statements made during this presentation, including, but not limited to, statements obtained from third parties. Opinions, estimates and projections constitute the current judgment of the speaker as of the date indicated. They do not necessarily reflect the views and opinions of Apollo and are subject to change at any time without notice. Apollo does not have any responsibility to update this presentation to account for such changes. There can be no assurance that any trends discussed during this presentation will continue.
Statements made throughout this presentation are not intended to provide, and should not be relied upon for, accounting, legal or tax advice and do not constitute an investment recommendation or investment advice. Investors should make an independent investigation of the information discussed during this presentation, including consulting their tax, legal, accounting or other advisors about such information. Apollo does not act for you and is not responsible for providing you with the protections afforded to its clients. This presentation does not constitute an offer to sell, or the solicitation of an offer to buy, any security, product or service, including interest in any investment product or fund or account managed or advised by Apollo.
Certain statements made throughout this presentation may be “forward-looking” in nature. Due to various risks and uncertainties, actual events or results may differ materially from those reflected or contemplated in such forward-looking information. As such, undue reliance should not be placed on such statements. Forward-looking statements may be identified by the use of terminology including, but not limited to, “may”, “will”, “should”, “expect”, “anticipate”, “target”, “project”, “estimate”, “intend”, “continue” or “believe” or the negatives thereof or other variations thereon or comparable terminology.