


Want it delivered daily to your inbox?
-
Following the recent publication of our Mid-Year Economic Outlook, our credit team published our inaugural Mid-Year Credit Outlook paper yesterday. It’s available here.
The key themes we explore in this paper are:
- The buoyant demand for corporate debt that bolstered primary markets this year came alongside pockets of distress in the riskier parts of the market. We expect this divergence to persist through 2024 as demand for high-quality credit keeps index spreads near record tights while a subset of lower-quality corporates struggle with generationally high interest rates.
- We expect investment grade bonds and BB spreads to remain stable despite tight valuations, given elevated funding costs do not pose a meaningful risk for the credit metrics of these issuers. Meanwhile, the outlook for lower-quality credit is more uncertain and credit spreads across the B/CCC universe could be pressured if the economic backdrop deteriorates or in a higher-for-longer rate environment.
- The continued evolution of AI and its increased grid and power demand, the disruption of media providers from new technologies and competitors as well as the US elections are all key themes we expect will take center stage throughout the rest of the year.
- Looking at the investment grade market, there appears to be a rising fragmentation when it comes to liquidity. The most liquid segments of the market have seen an improvement in trading volumes, while the liquidity profile of older vintage and smaller bonds has deteriorated. At the same time, given liquidity premia have compressed, we believe private credit is an attractive replacement for this allocation.
- The significant growth in middle market lending over the past year has driven an increase in issuance of two types of debt instruments that share some resemblance: middle-market CLOs and BDC unsecured debt. While issued in distinct markets, they have similar underlying risk exposures making their valuations readily comparable. We present a novel analysis comparing the two types of structures.
See important disclaimers at the bottom of the page.
-
It is difficult to be negative on the economic outlook when household net worth relative to income is near record high levels, see chart below.
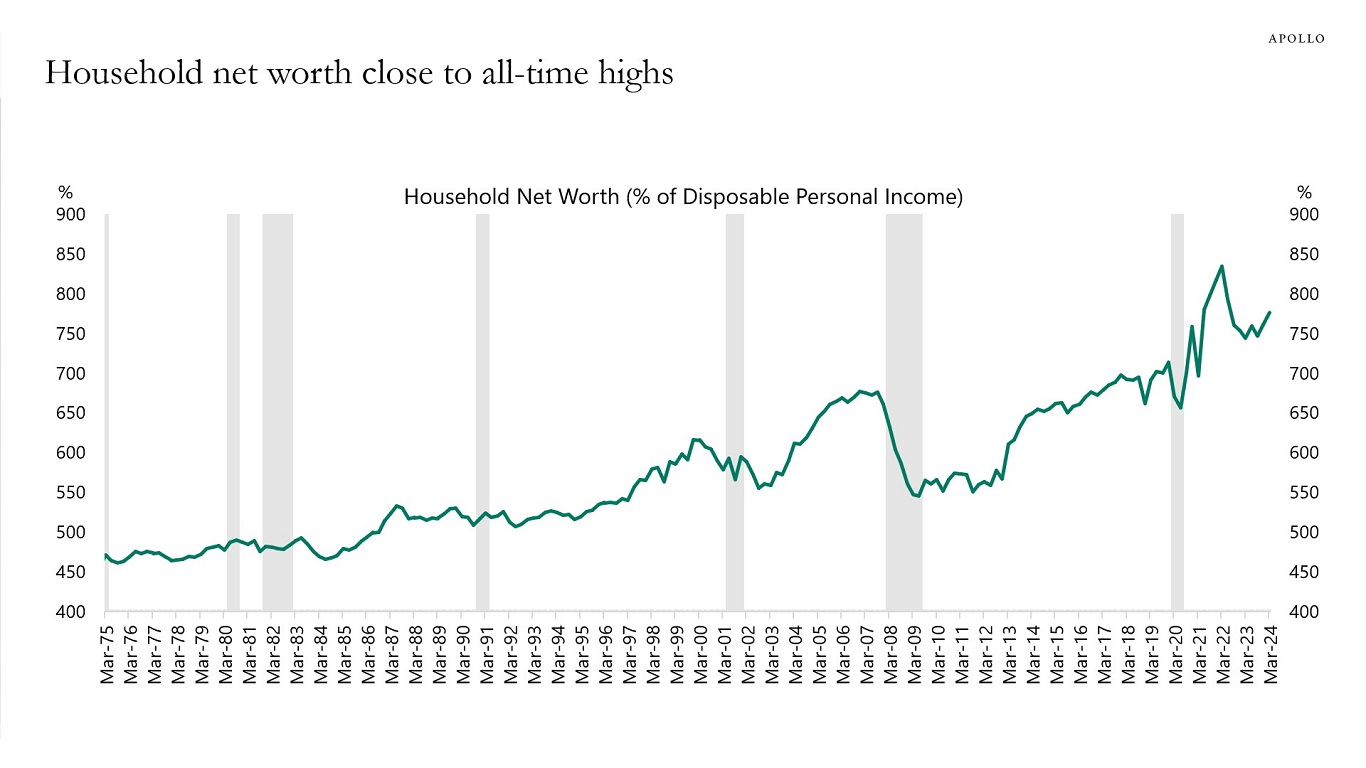
Source: FRB, Haver Analytics, Apollo Chief Economist See important disclaimers at the bottom of the page.
-
Measures of liquidity in Treasury markets continue to send worrying signals, with the average yield error approaching 4.5, see chart below.

Source: Bloomberg, Apollo Chief Economist. Note: The index displays the average yield error across the universe of government notes and bonds with remaining maturity of one year or greater, based off the intra-day Bloomberg relative value curve fitter. When liquidity conditions are favorable, the average yield errors are small as any dislocations from fair values are normalized within a short time frame. Average yield error is defined as an aggregate measure for dislocations in Treasury securities across the curve. See important disclaimers at the bottom of the page.
-
Last week, we published our mid-year outlook, it is available here. For private equity, there are three themes:
1. Interest rates will remain higher for longer due to strong near-term growth, deglobalization, the energy transition, increased defense spending, rising Treasury issuance, and US fiscal deficits.
2. With rates higher for longer and growth eventually slowing down, opportunities in private equity will likely continue to emerge among potential distressed companies.
3. Ongoing uncertainty and volatility in the broader market call for a flexible, value-oriented strategy in private equity. Strategies with the ability to invest opportunistically across the capital stack are well-positioned to capitalize on the shifting fortunes of companies seeking financing in these turbulent times.

Our private equity chart book is available here.
See important disclaimers at the bottom of the page.
-
Last week, we published our mid-year outlook, it is available here. For real assets, there are three themes:
1. Interest rates will remain higher for longer due to strong near-term growth, deglobalization, the energy transition, increased defense spending, rising Treasury issuance, and US fiscal deficits.
2. Office remains particularly weak for a variety of reasons, including work from home and higher interest rates, but other real asset sectors are showing resiliency. Secular growth trends continue to persist for industrial, multifamily, as well as specialty areas such as data centers, cold storage, self-storage, and student housing.
3. The opportunity remains more compelling towards real estate debt than equity on a risk-adjusted basis in the current cycle. Real estate credit can offer a more attractive proposition due to high base interest rates, widening spreads, more protective loan structures, as well as expectations of higher-for-longer rates.
Our real assets chart book is available here.
See important disclaimers at the bottom of the page.
-
The FOMC has started to revise higher its estimate of where the fed funds rate will be in the long run. This is likely driven by upward pressures on inflation and rates from deglobalization, the energy transition, more restrictions on immigration, more defense spending, and higher levels of government debt.
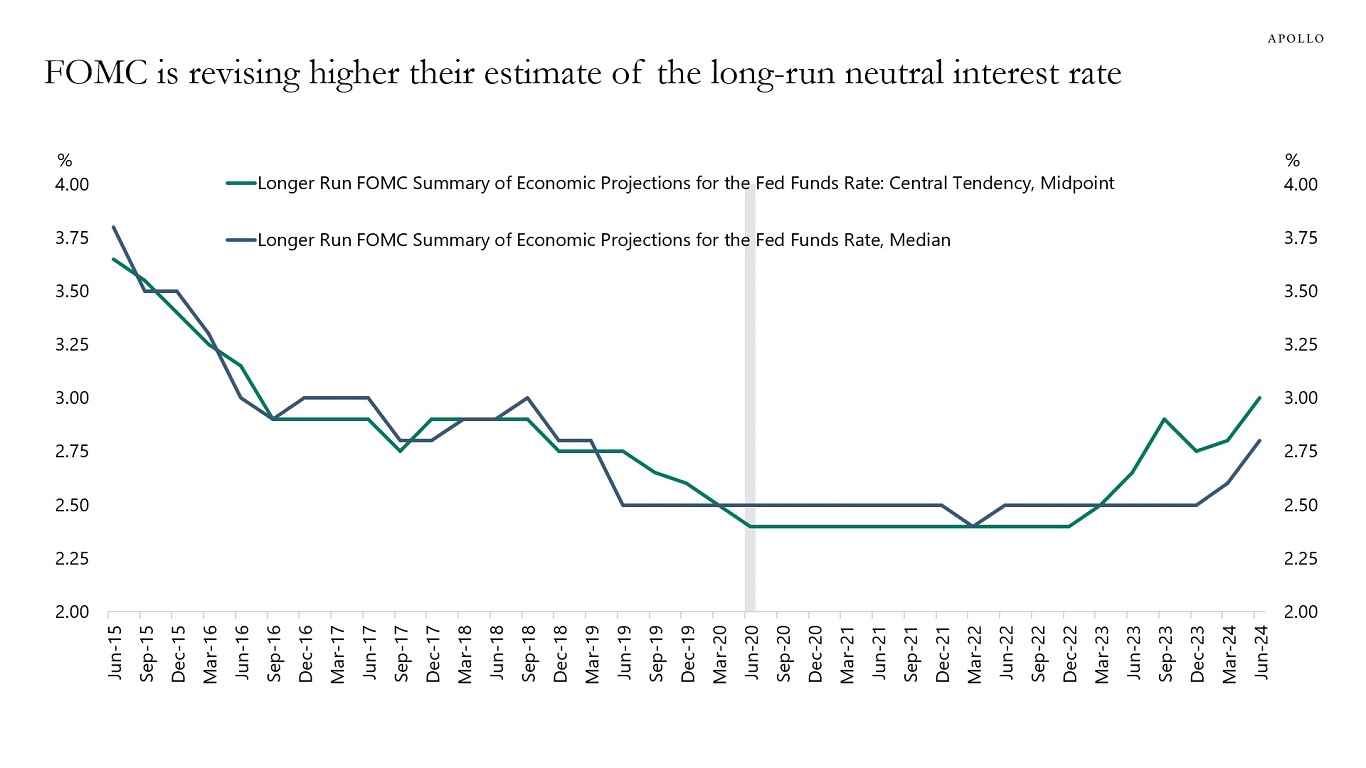
Source: Federal Reserve Board, Apollo Chief Economist See important disclaimers at the bottom of the page.
-
There is a major gap opening up between the mean and the median of long-term inflation expectations, which means that half of the population has long-term inflation expectations that are dramatically higher than the other half, see charts below and in this chart book. This is a very significant challenge for the Fed because it cannot cut interest rates when inflation expectations are out of control.
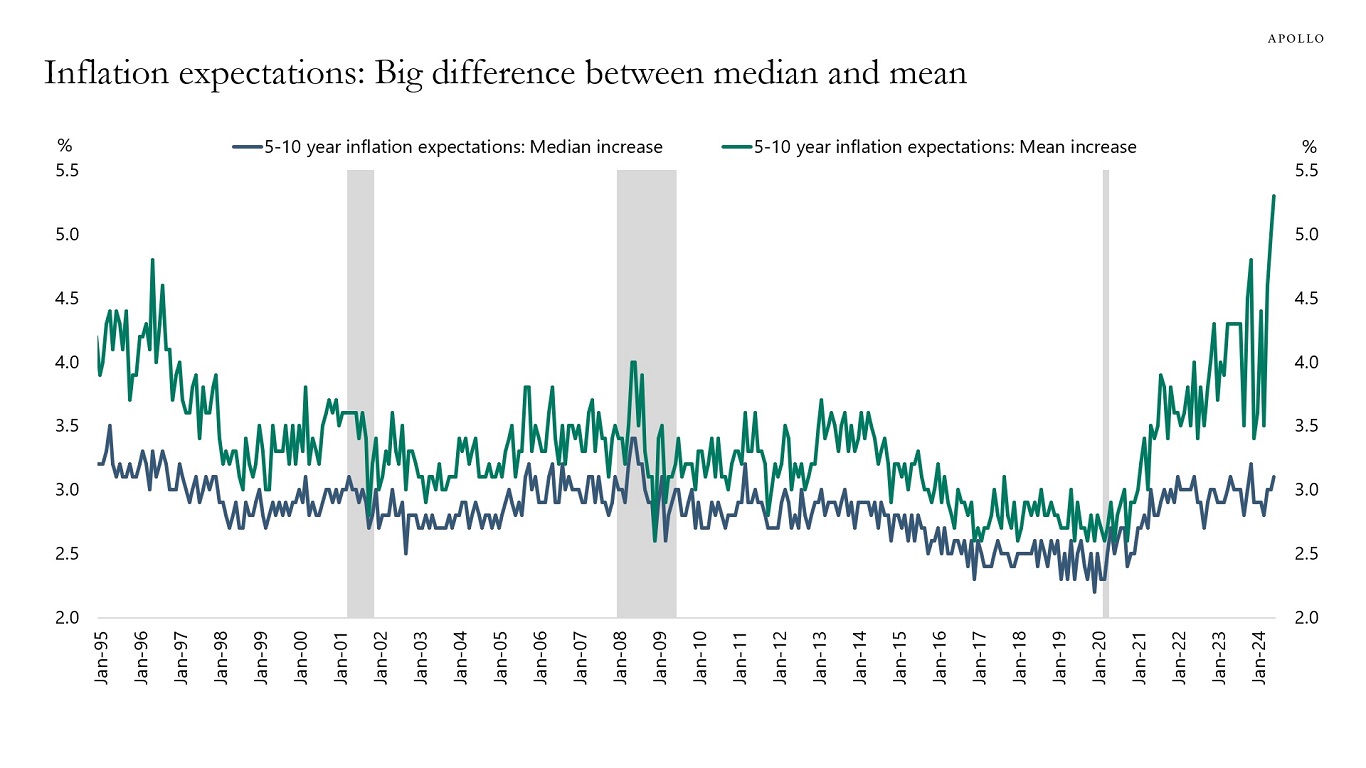
Source: University of Michigan, Haver Analytics, Apollo Chief Economist 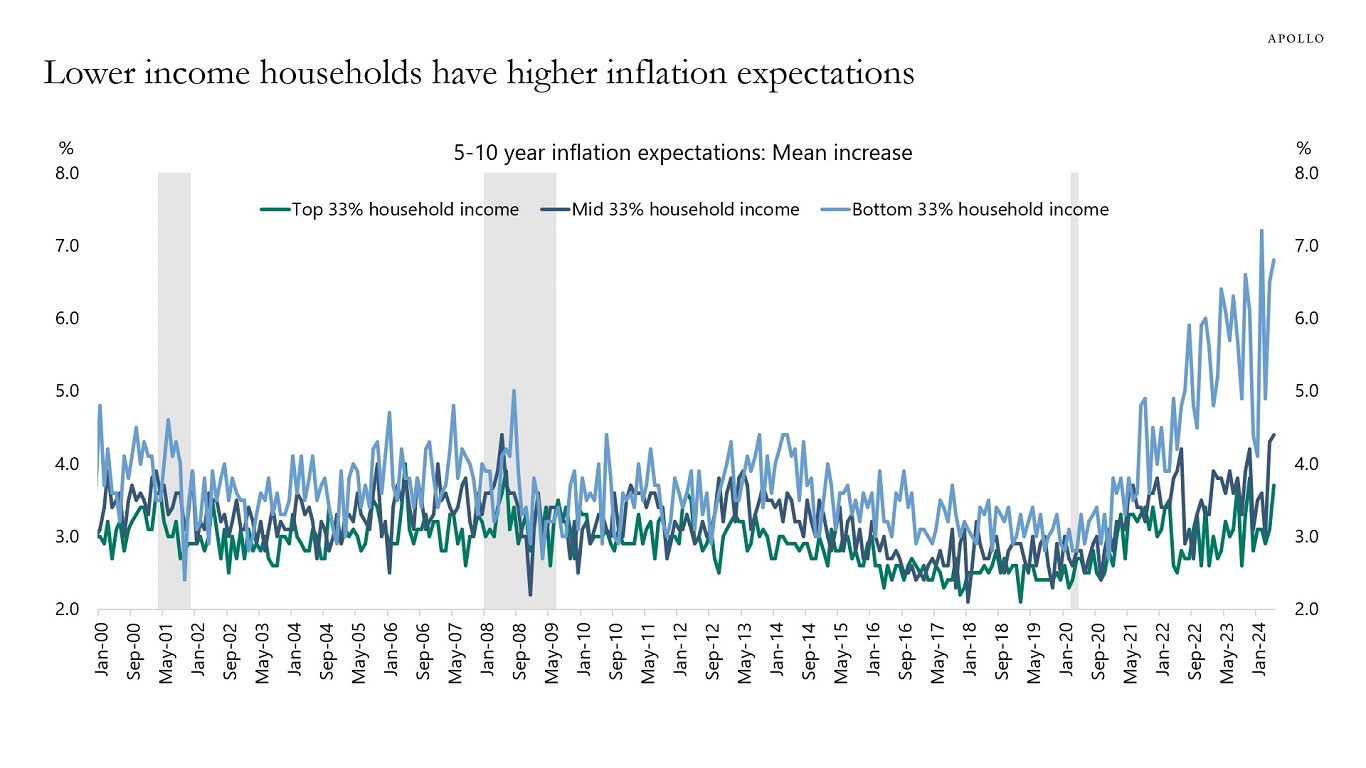
Source: University of Michigan, Haver Analytics, Apollo Chief Economist 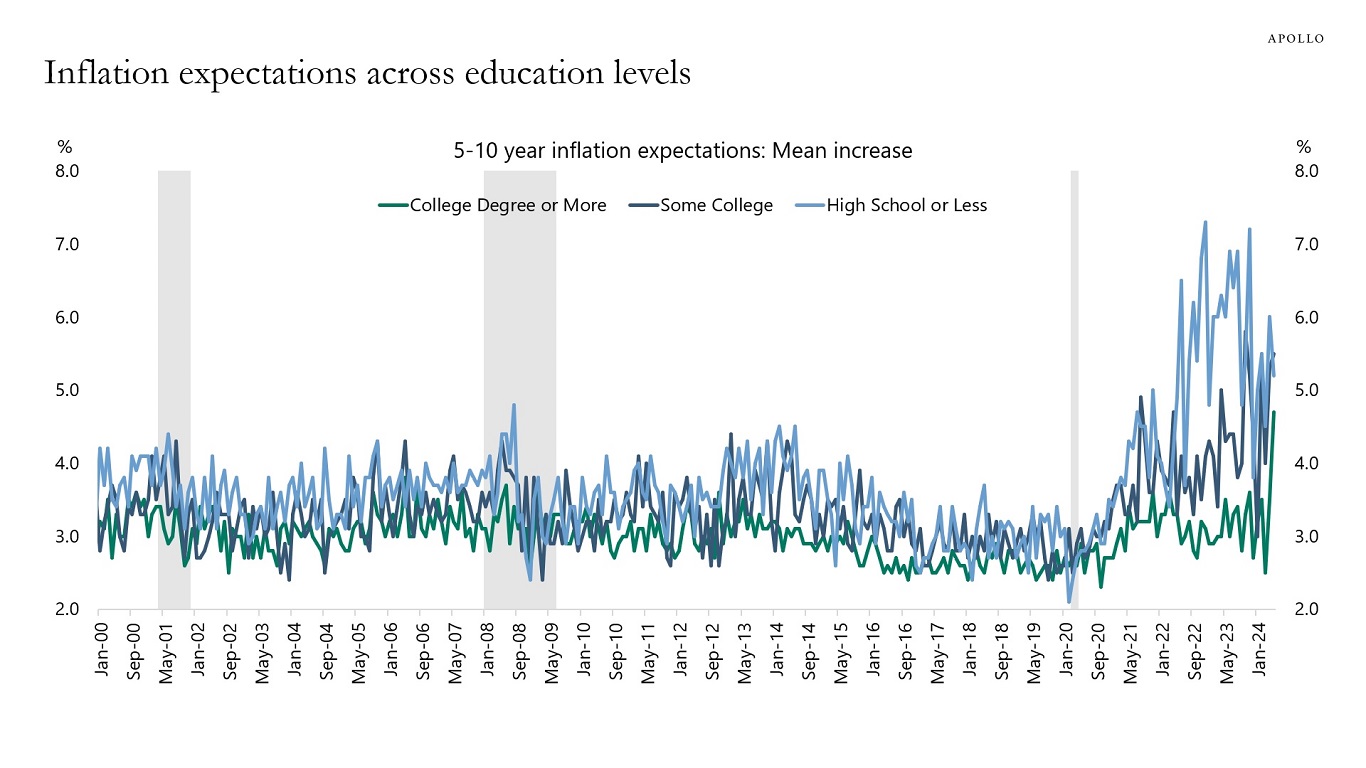
Source: University of Michigan, Haver Analytics, Apollo Chief Economist 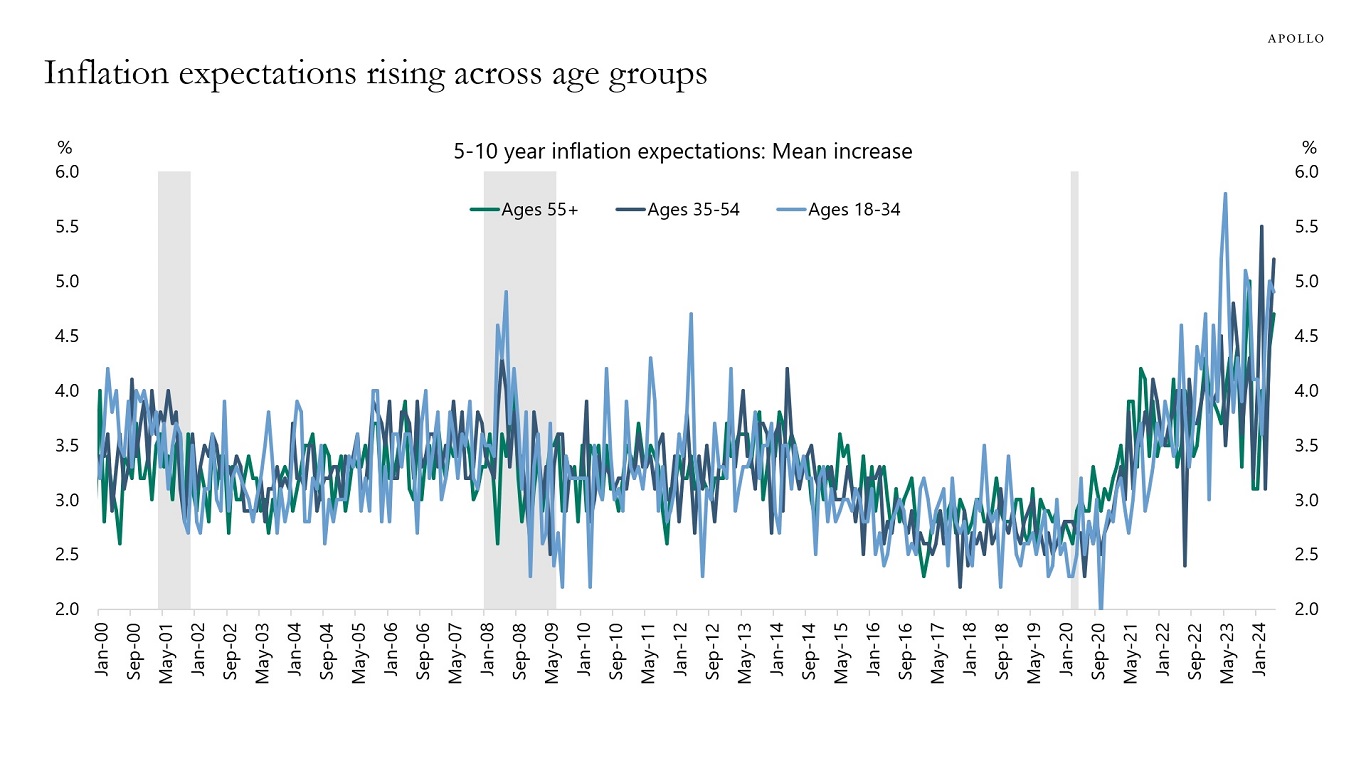
Source: University of Michigan, Haver Analytics, Apollo Chief Economist 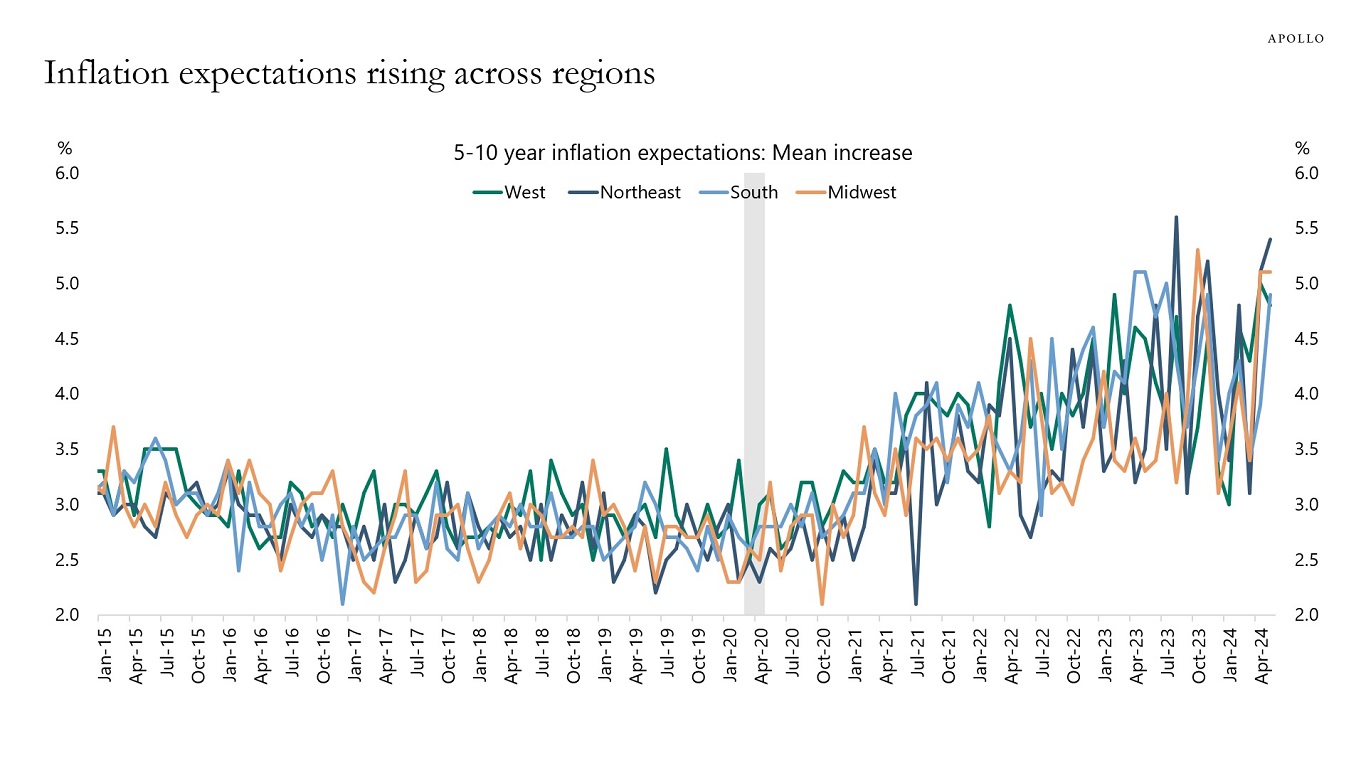
Source: University of Michigan, Haver Analytics, Apollo Chief Economist See important disclaimers at the bottom of the page.
-
Since the Fed started talking about rate cuts, households have turned more and more positive on equities, see chart below.
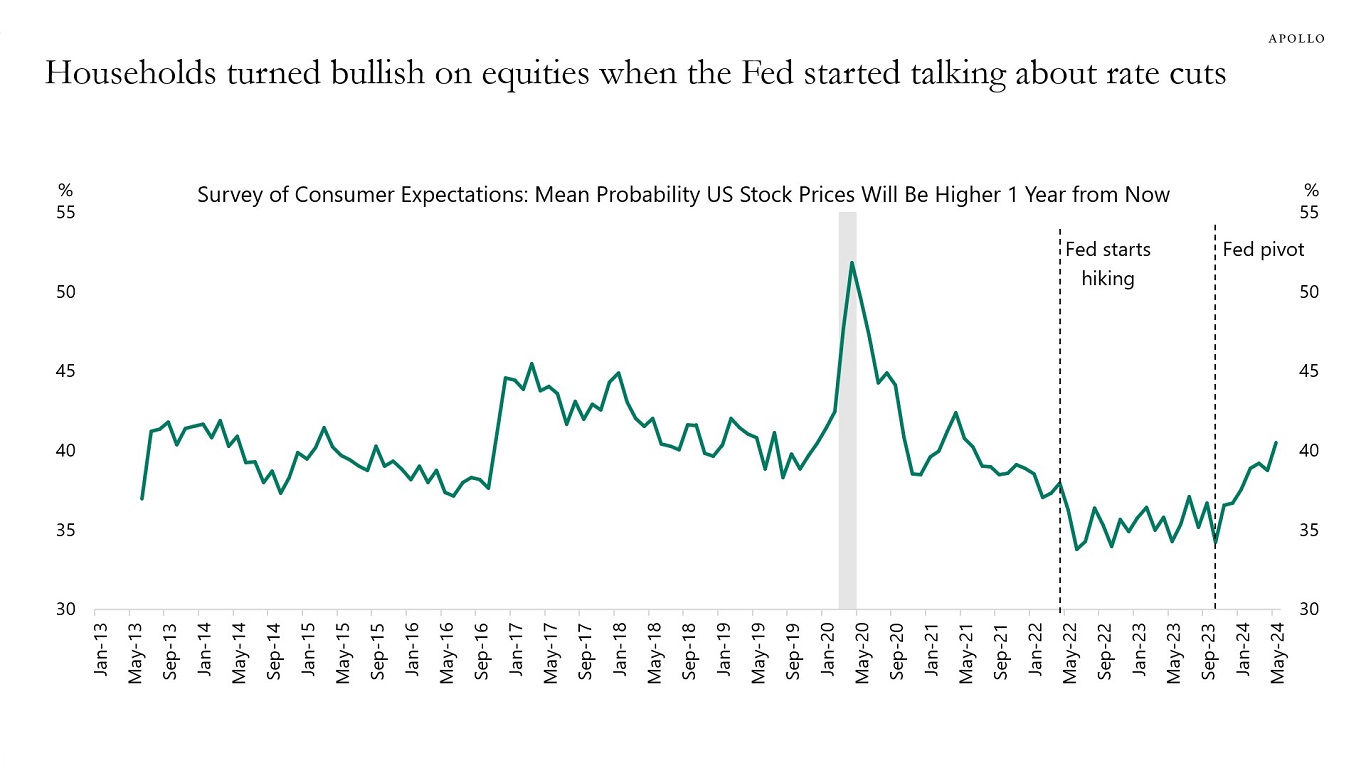
Source: Federal Reserve Bank of New York, Haver Analytics, Apollo Chief Economist See important disclaimers at the bottom of the page.
-
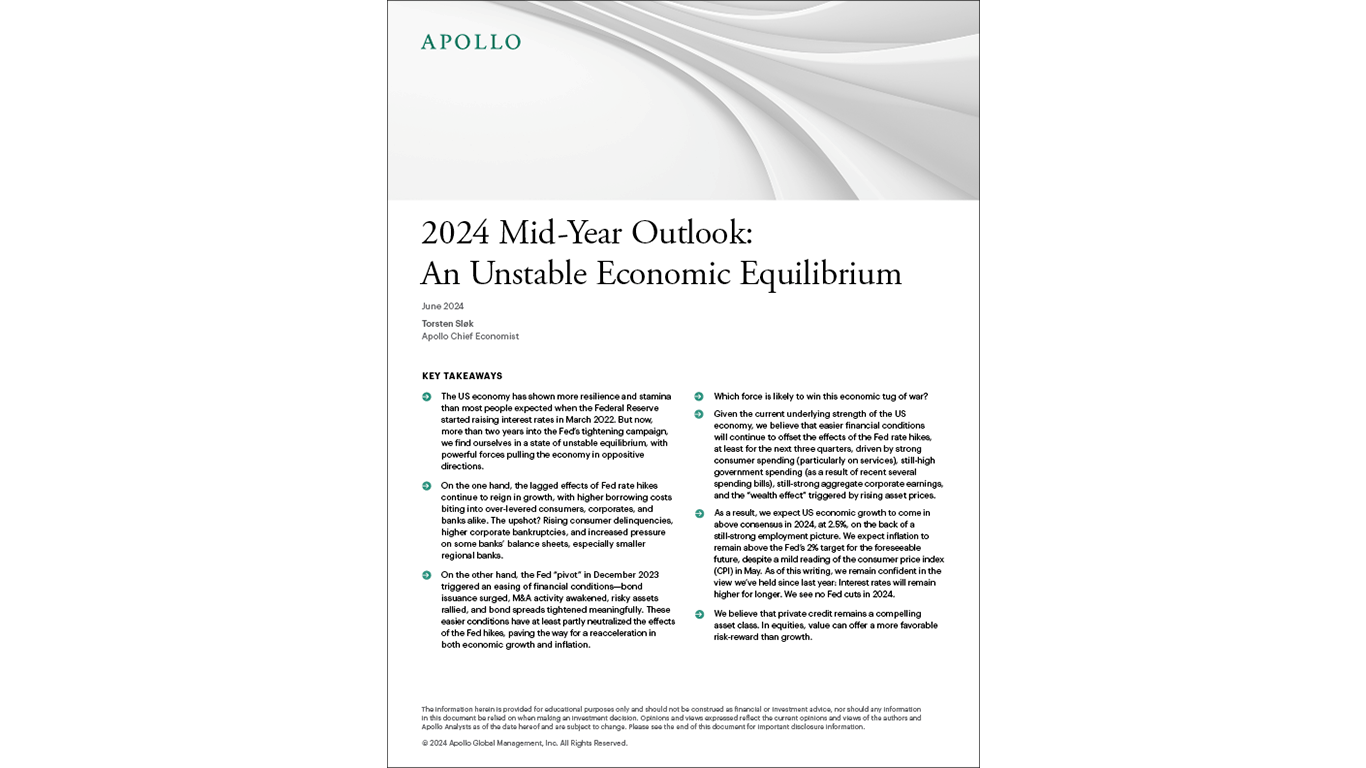
While the Fed’s rate hikes have reigned in growth, especially among over-levered consumers, corporates, and banks, the easing of financial conditions since the “Fed pivot” in December continues to offset the effect of higher rates. Through the remainder of 2024, we expect above-consensus economic growth. Inflation will remain above the Fed’s target and interest rates will remain higher for longer.
We published our consolidated views in my newest white paper, 2024 Mid-Year Outlook: An Unstable Economic Equilibrium. You can download it here.
I will also be discussing the contents of the paper and my views in detail in an Apollo Academy class today, June 20, at 11:00 ET (eligible for a CE credit). Register here.
See important disclaimers at the bottom of the page.
-
When the Fed raises interest rates, money market funds pay a higher dividend to households. The chart below shows that this effect is very significant and currently running at $500 billion, or around 2.5% of consumer spending. Put differently, Fed hikes are boosting consumer spending through higher money market fund dividends.
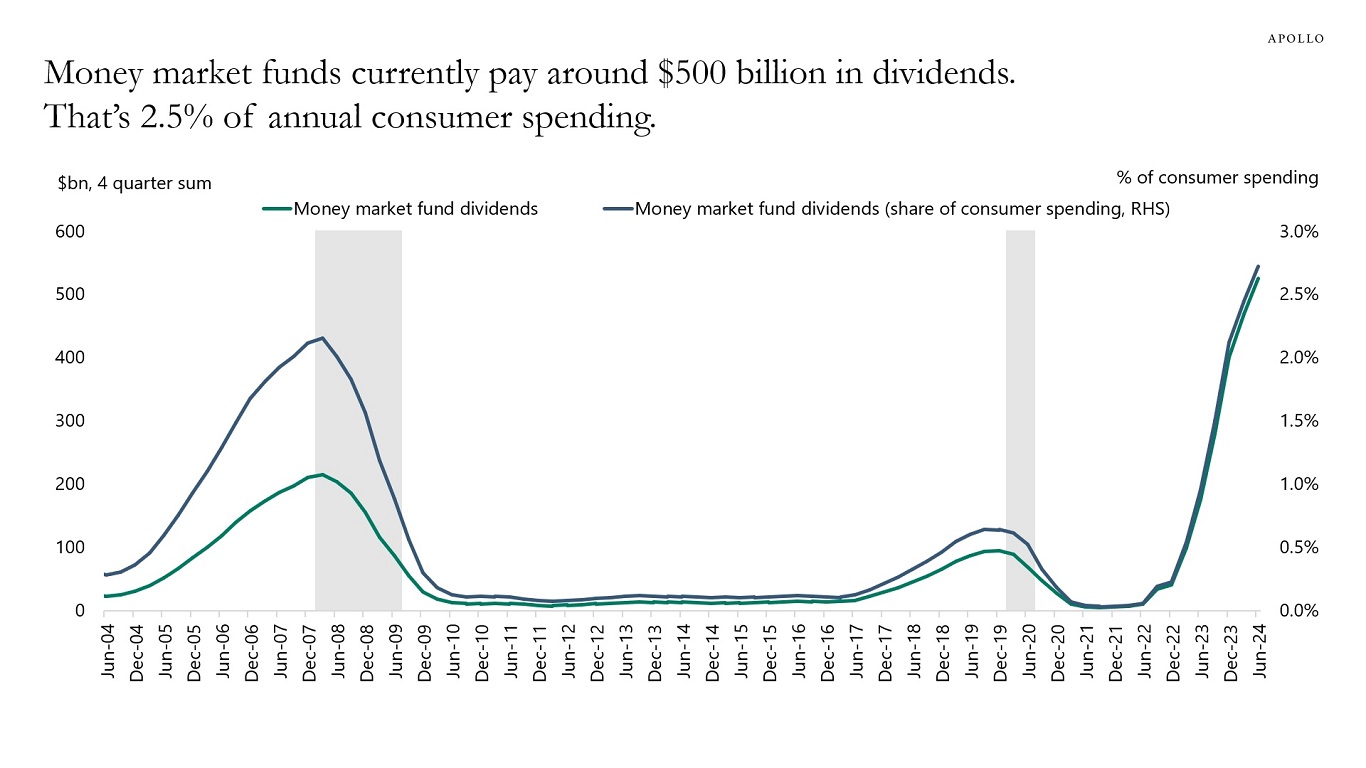
Source: BEA, ICI, Haver Analytics, Apollo Chief Economist. Note: Q1 2024 and Q2 2024 are estimates, dividends include dividends paid and dividends reinvested. Consumer spending is PCE. See important disclaimers at the bottom of the page.

This presentation may not be distributed, transmitted or otherwise communicated to others in whole or in part without the express consent of Apollo Global Management, Inc. (together with its subsidiaries, “Apollo”).
Apollo makes no representation or warranty, expressed or implied, with respect to the accuracy, reasonableness, or completeness of any of the statements made during this presentation, including, but not limited to, statements obtained from third parties. Opinions, estimates and projections constitute the current judgment of the speaker as of the date indicated. They do not necessarily reflect the views and opinions of Apollo and are subject to change at any time without notice. Apollo does not have any responsibility to update this presentation to account for such changes. There can be no assurance that any trends discussed during this presentation will continue.
Statements made throughout this presentation are not intended to provide, and should not be relied upon for, accounting, legal or tax advice and do not constitute an investment recommendation or investment advice. Investors should make an independent investigation of the information discussed during this presentation, including consulting their tax, legal, accounting or other advisors about such information. Apollo does not act for you and is not responsible for providing you with the protections afforded to its clients. This presentation does not constitute an offer to sell, or the solicitation of an offer to buy, any security, product or service, including interest in any investment product or fund or account managed or advised by Apollo.
Certain statements made throughout this presentation may be “forward-looking” in nature. Due to various risks and uncertainties, actual events or results may differ materially from those reflected or contemplated in such forward-looking information. As such, undue reliance should not be placed on such statements. Forward-looking statements may be identified by the use of terminology including, but not limited to, “may”, “will”, “should”, “expect”, “anticipate”, “target”, “project”, “estimate”, “intend”, “continue” or “believe” or the negatives thereof or other variations thereon or comparable terminology.