


Want it delivered daily to your inbox?
-
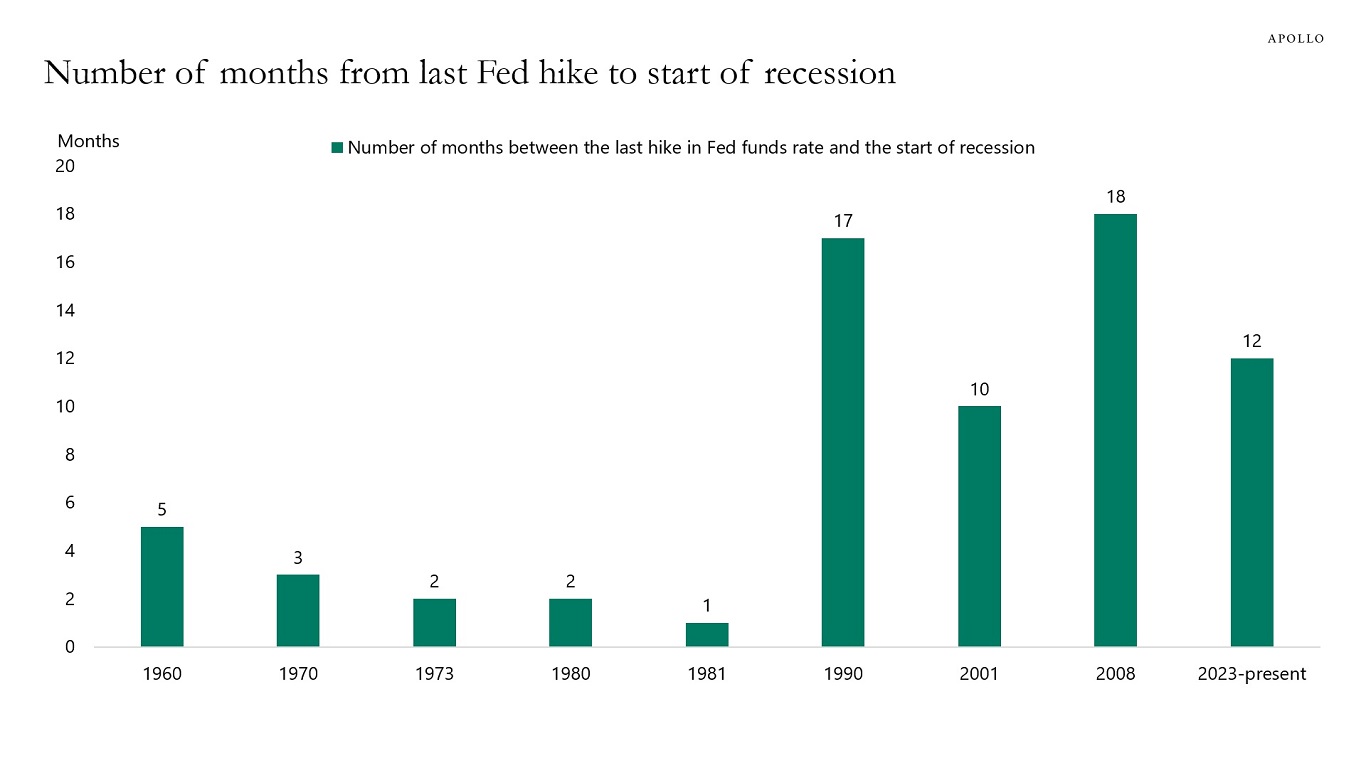
The idea behind the Fed raising interest rates is to slow the economy down in order to slow down inflation. Normally, when the Fed stops raising rates, it ultimately causes a recession within 18 months, see chart below.
The last Fed hike was in July 2023, and using this historical relationship, we should see a recession before the end of 2024.
But we are likely to break this 18-month record during this cycle because of the continued strong tailwinds to growth from easy fiscal policy and easy financial conditions.
In short, the US economy continues to power ahead, driven by easy fiscal policy, a dovish Fed, and AI investments and AI wealth gains.
Source: Federal Reserve Board, Haver Analytics, Apollo Chief Economist See important disclaimers at the bottom of the page.
-
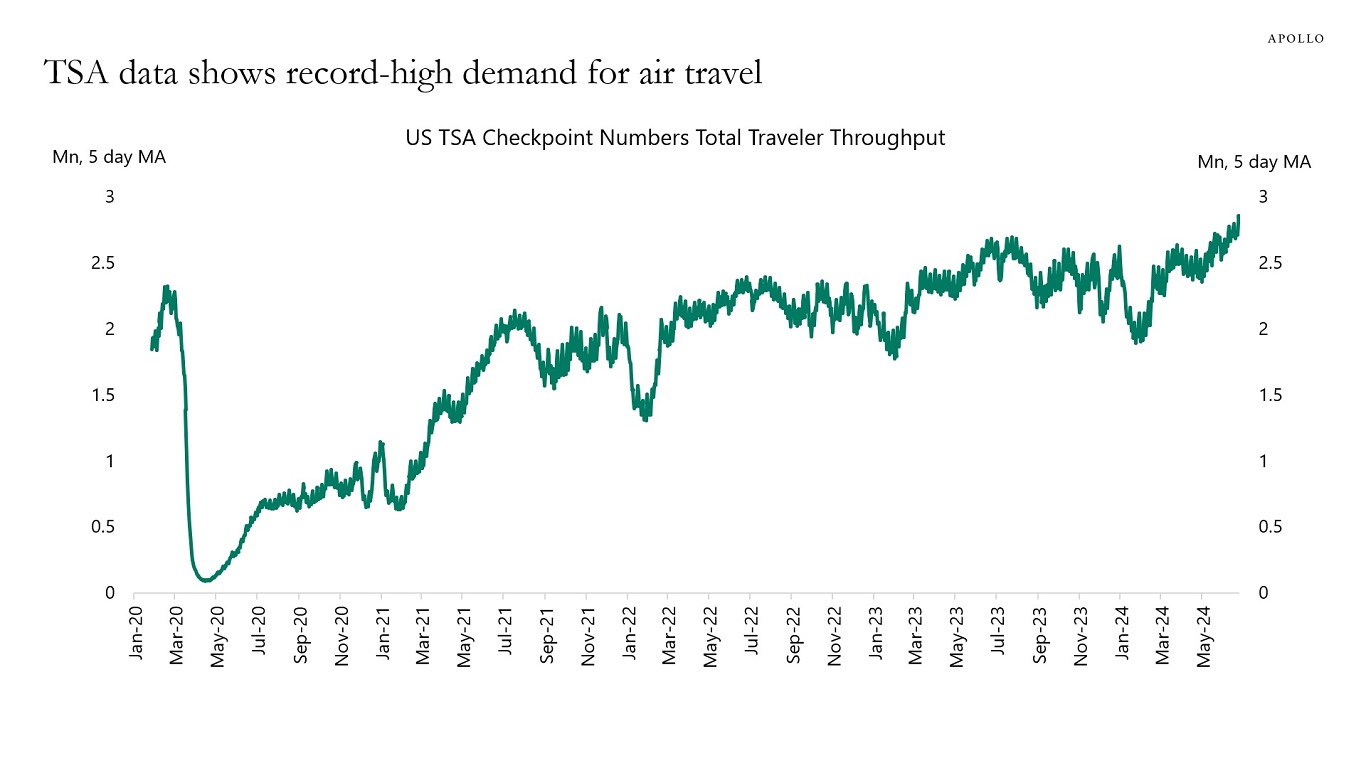
The TSA has daily data for the number of people scanning their boarding pass with a TSA agent, and it continues to show no signs of the economy slowing down, see chart below.
Source: Transportation Security Administration, Apollo Chief Economist See important disclaimers at the bottom of the page.
-
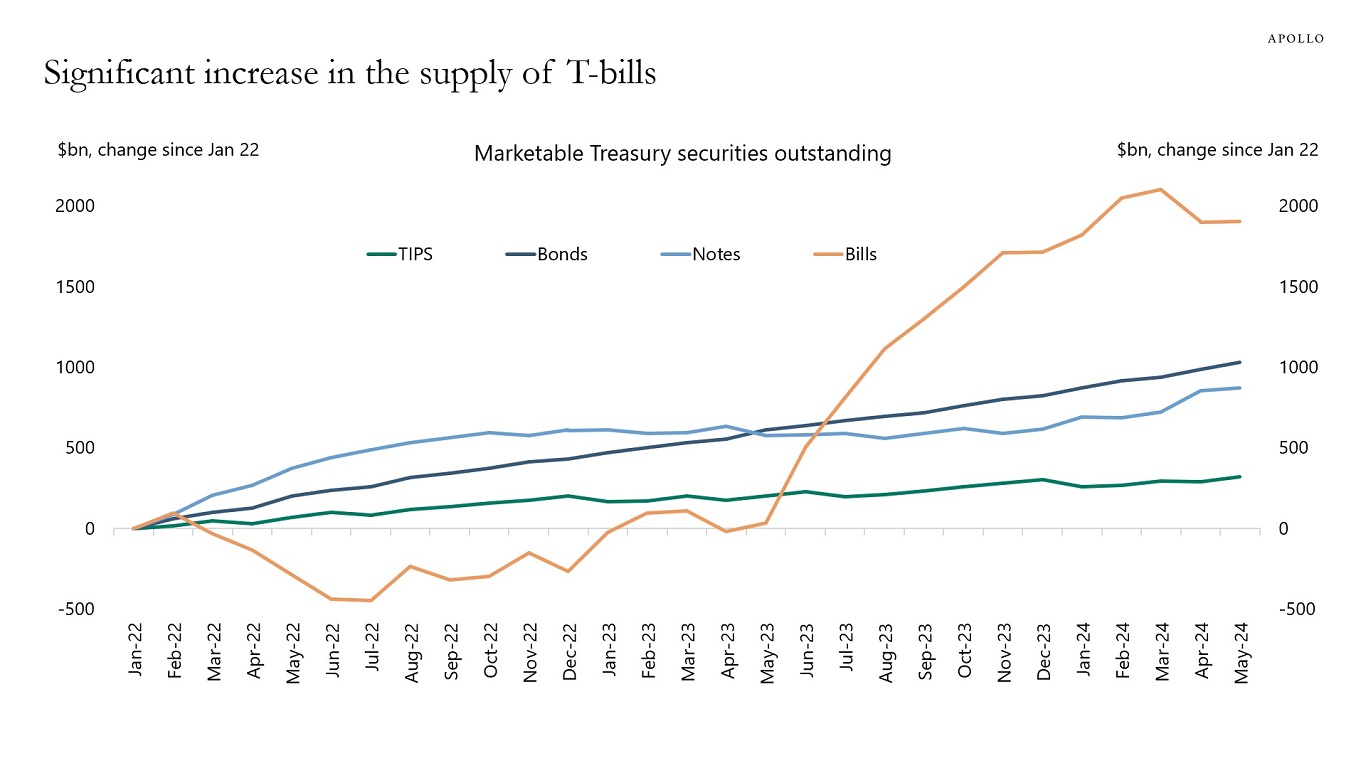
The supply of T-bills has increased by $2 trillion over the past 12 months, and the share of T-bills outstanding as a share of total debt outstanding has trended significantly higher over the same period, see charts below.
Why is the rapid growth in the supply of T-bills a problem? Because a big increase in supply requires a big increase in demand. Growing the amount of T-bills outstanding while the Fed at the same time is doing QT increases the risk of an accident in funding markets, which is what we saw in repo markets in September 2019.
In other words, the strong growth in the supply of T-bills will require a continued increase in demand from banks, money market funds, and households. If the Fed starts cutting rates, say, in September, we could see lower appetite for T-bills from households and money market funds, which ultimately would put upward pressure on short rates because of the big supply of T-bills not being met by similar strong demand.
Source: Treasury, Haver Analytics, Apollo Chief Economist 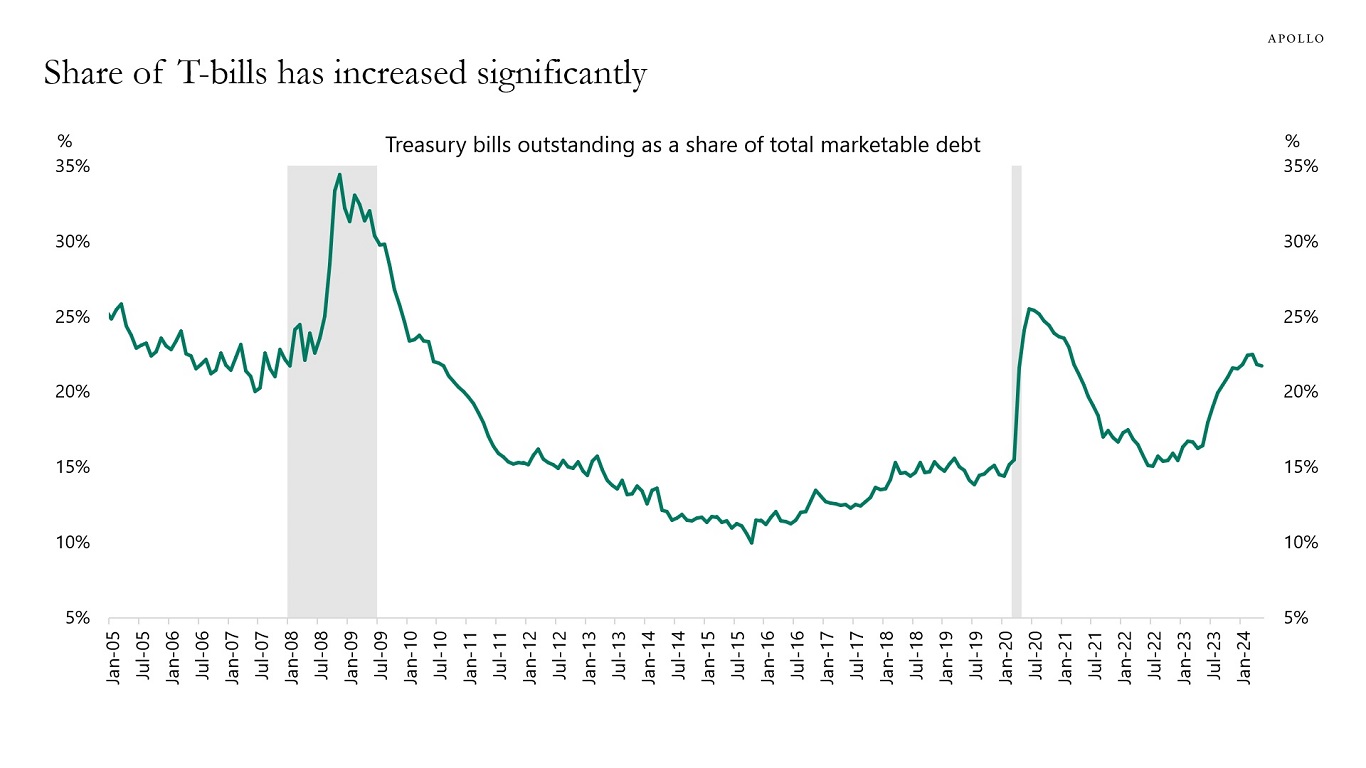
Source: Treasury, Haver Analytics, Apollo Chief Economist See important disclaimers at the bottom of the page.
-
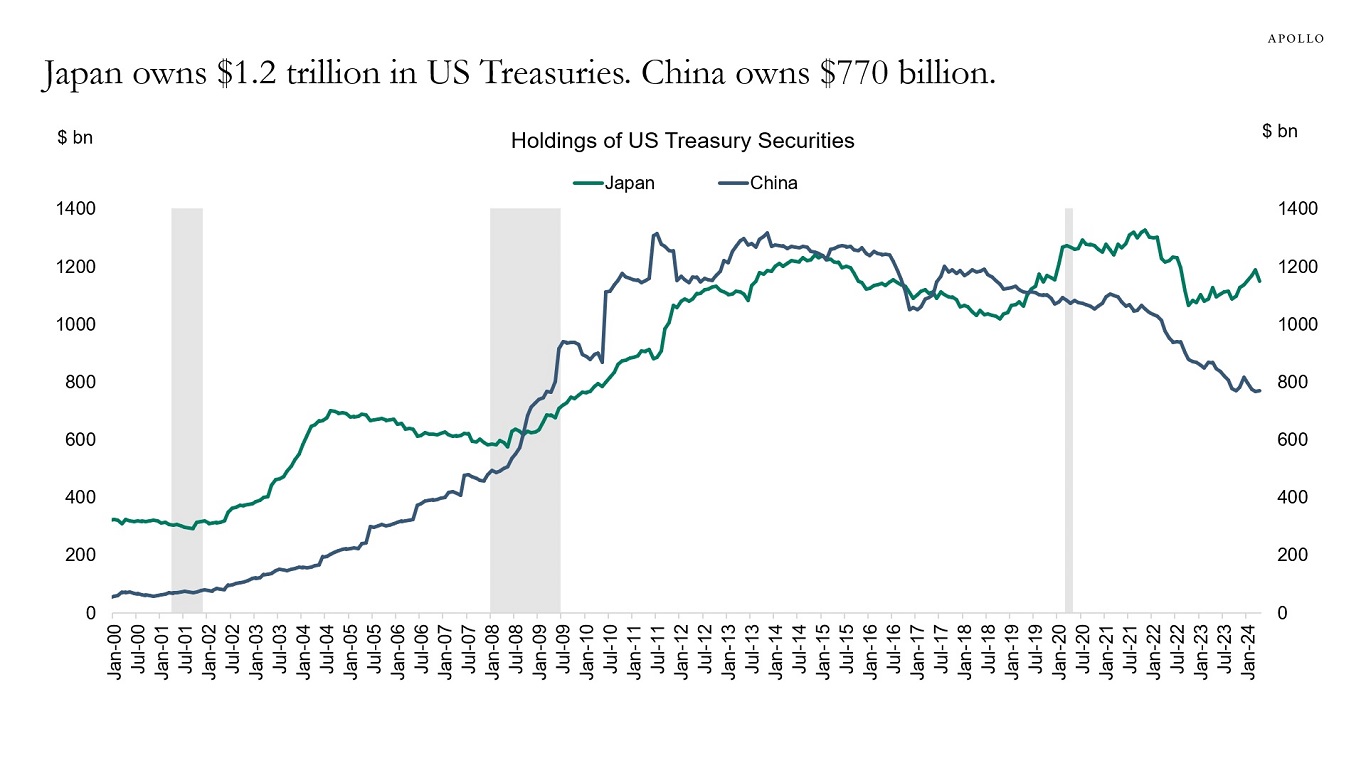
With the Japanese yen rising above 160 and 10-year JGB yields approaching 1.1%, we’ve updated our chart book looking at Japanese demand for US Treasuries.
There are five conclusions:
1) Japan is the biggest foreign holder of US Treasuries, holding $1.2 trillion. This is more than China’s $770 billion, see the first chart.
2) The three-month moving average of Japanese net purchases of US Treasuries is declining, suggesting that Japanese investors are repatriating money from abroad and taking money home to buy Japanese assets, see the second chart.
3) A simple econometric model forecasting the USD/JPY exchange rate shows that based on the current interest differential between the US and Japan, the USD/JPY exchange rate should currently be 140, see the third chart below. In other words, with Japanese yields rising relative to US yields, the yen should be appreciating, which is the opposite of what has happened.
4) Concentration is also a major challenge for the Japanese stock market, with the 30 biggest stocks in the TOPIX now making up 40% of the index, see the fourth chart.
5) The latest data shows that tourism into Japan is at record-high levels, likely driven by the cheap yen, see the fifth chart.
Source: Bloomberg, Apollo Chief Economist 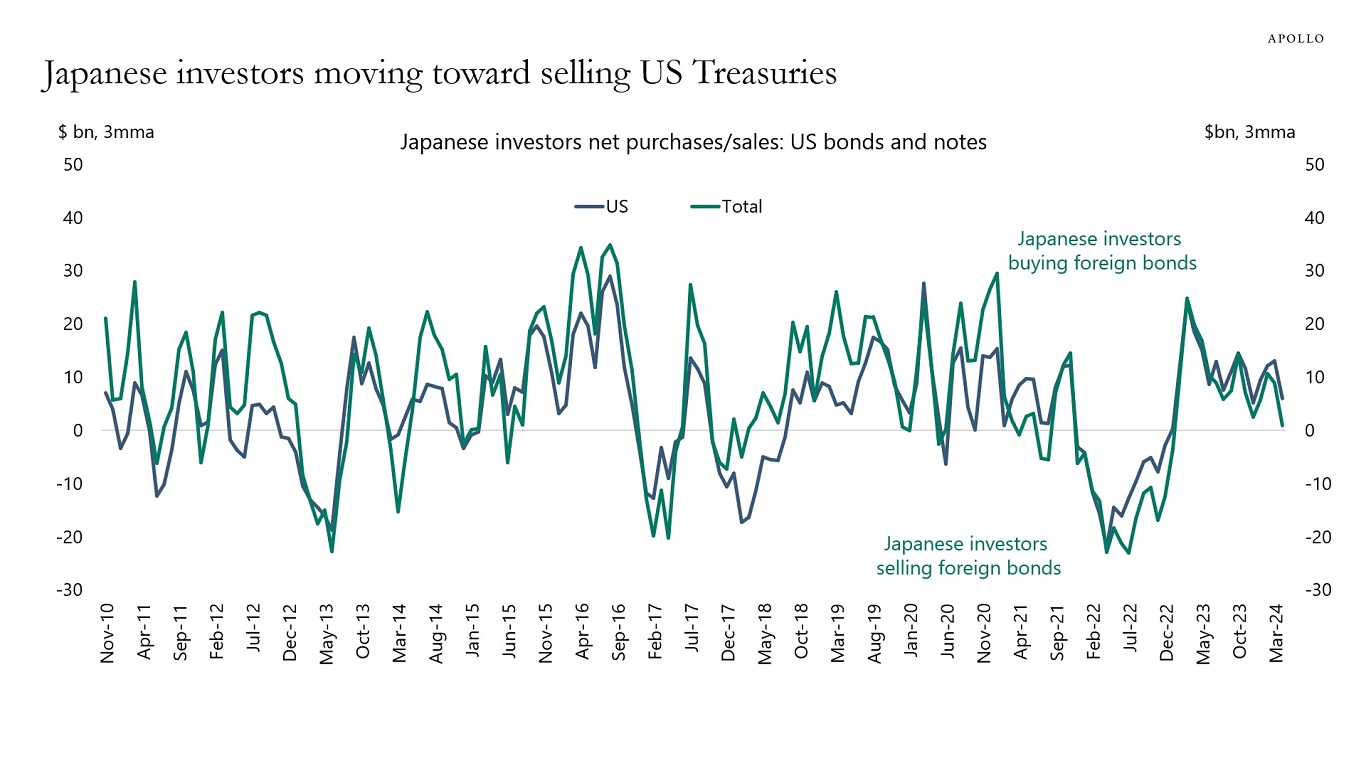
Source: Ministry of Finance Japan, Bloomberg, Apollo Chief Economist 
Source: Bloomberg, Apollo Chief Economist 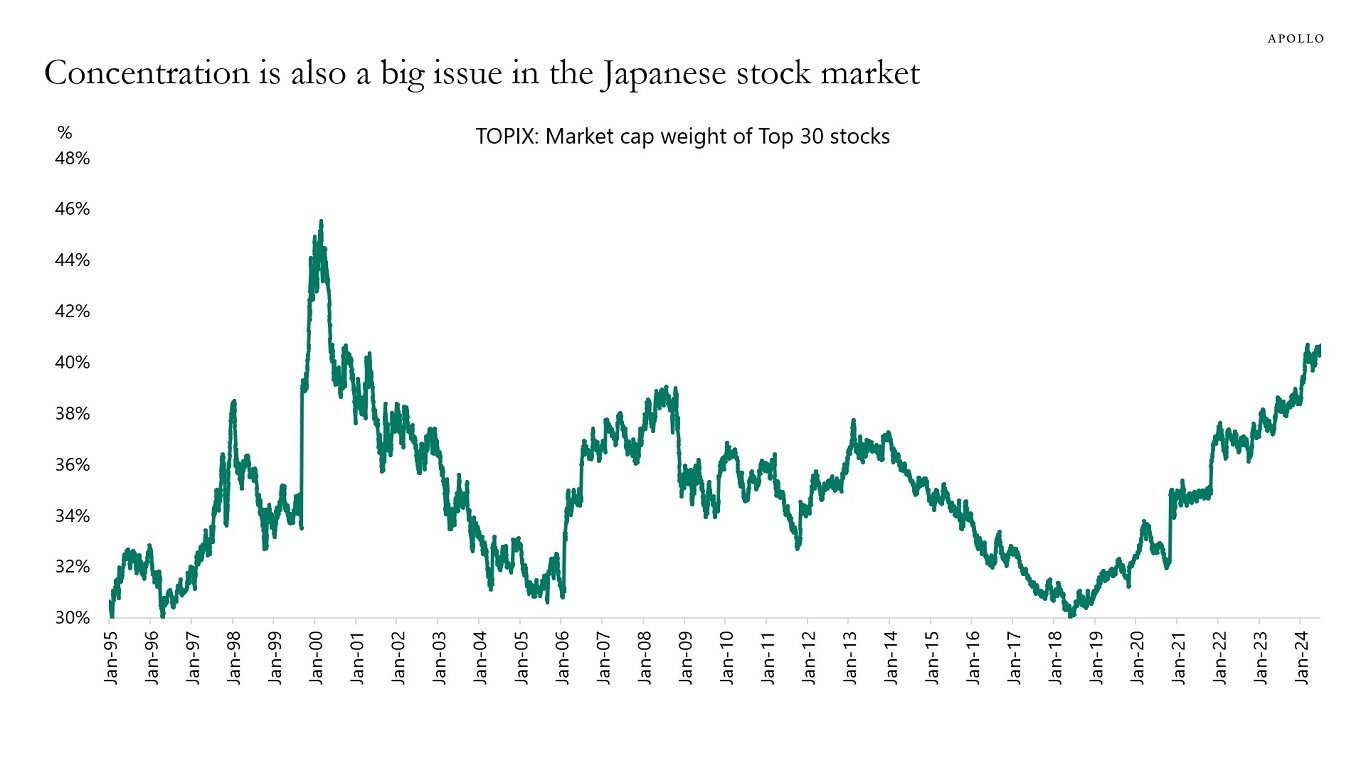
Source: Bloomberg, Apollo Chief Economist 
Source: Japan National Tourism Organization, Bloomberg, Apollo Chief Economist See important disclaimers at the bottom of the page.
-
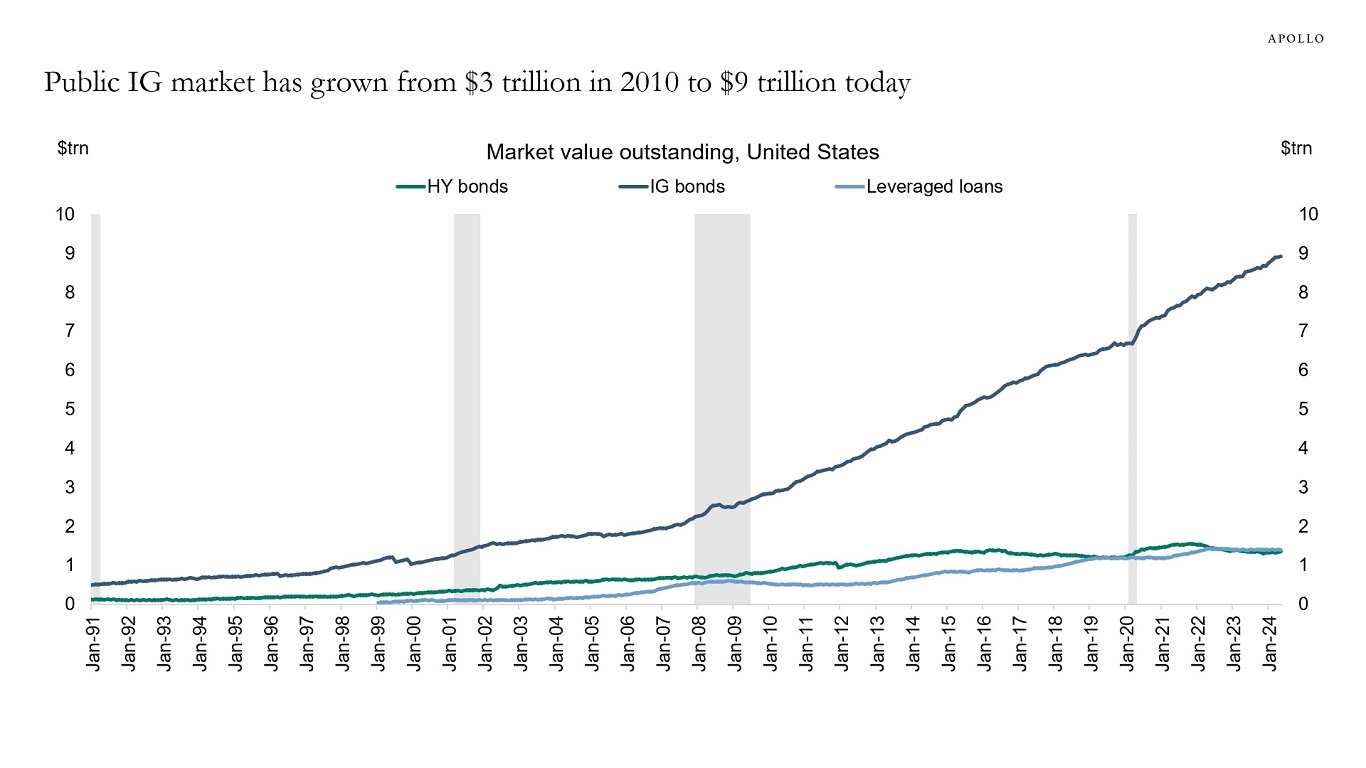
The market value of all US corporate IG bonds outstanding has increased from $3 trillion in 2010 to $9 trillion today, see the first chart.
Over the same period, the private credit market has grown by $800 billion.
The bottom line is that public IG markets have since 2010 grown eight times faster than private credit, see the second chart.
In short, when discussing growth in private credit it is important to also consider the growth in public credit over the same period.
Source: ICE BofA, Bloomberg, PitchBook LCD, Apollo Chief Economist. Note: Ticker used for HY is H0A0 Index, for IG it is C0A0 Index, and for loans it is SPBDALB Index. 
Source: ICE BofA, PitchBook, Preqin, Bloomberg, Apollo Chief Economist See important disclaimers at the bottom of the page.
-
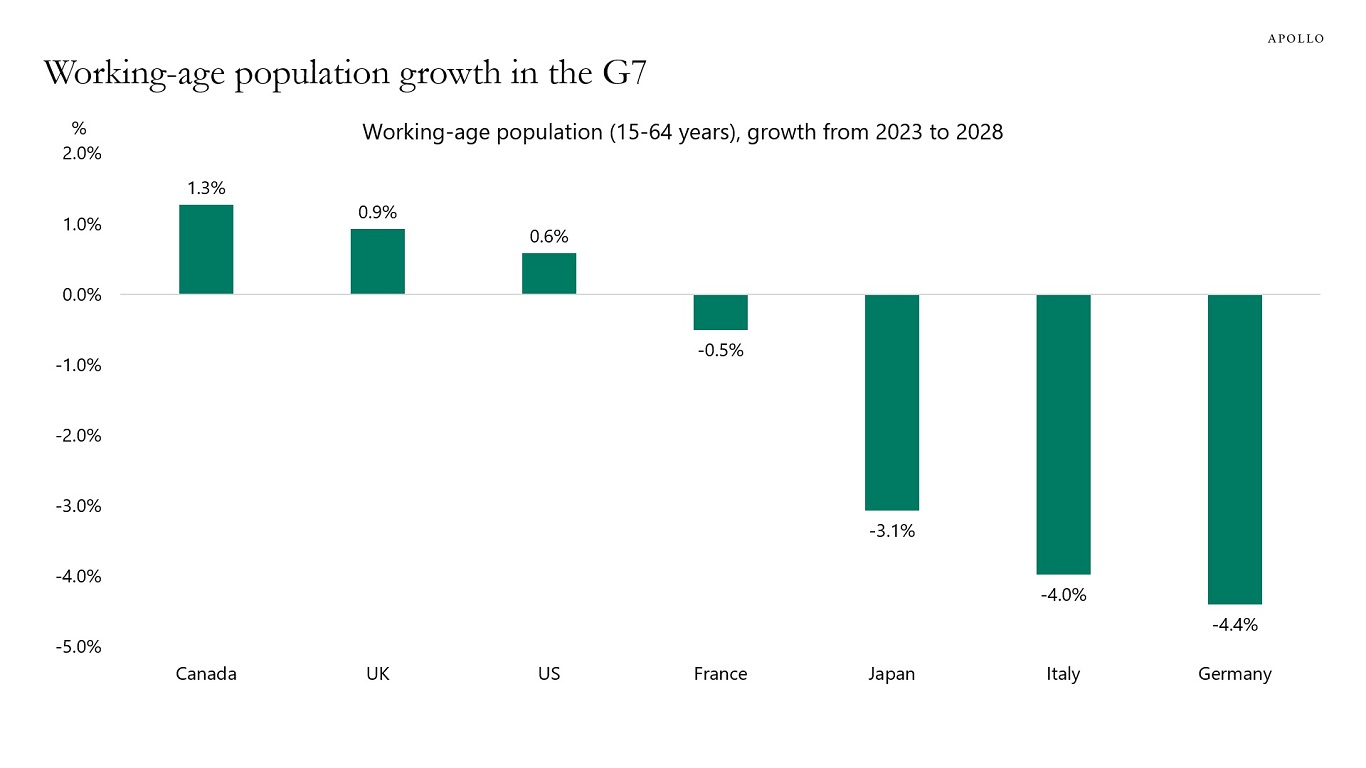
According to the UN, working-age population growth is going to shrink in Europe and Japan over the coming years and increase in the US, UK, and Canada, see chart below.
Source: UN Population Statistics, Haver Analytics, Apollo Chief Economist See important disclaimers at the bottom of the page.
-
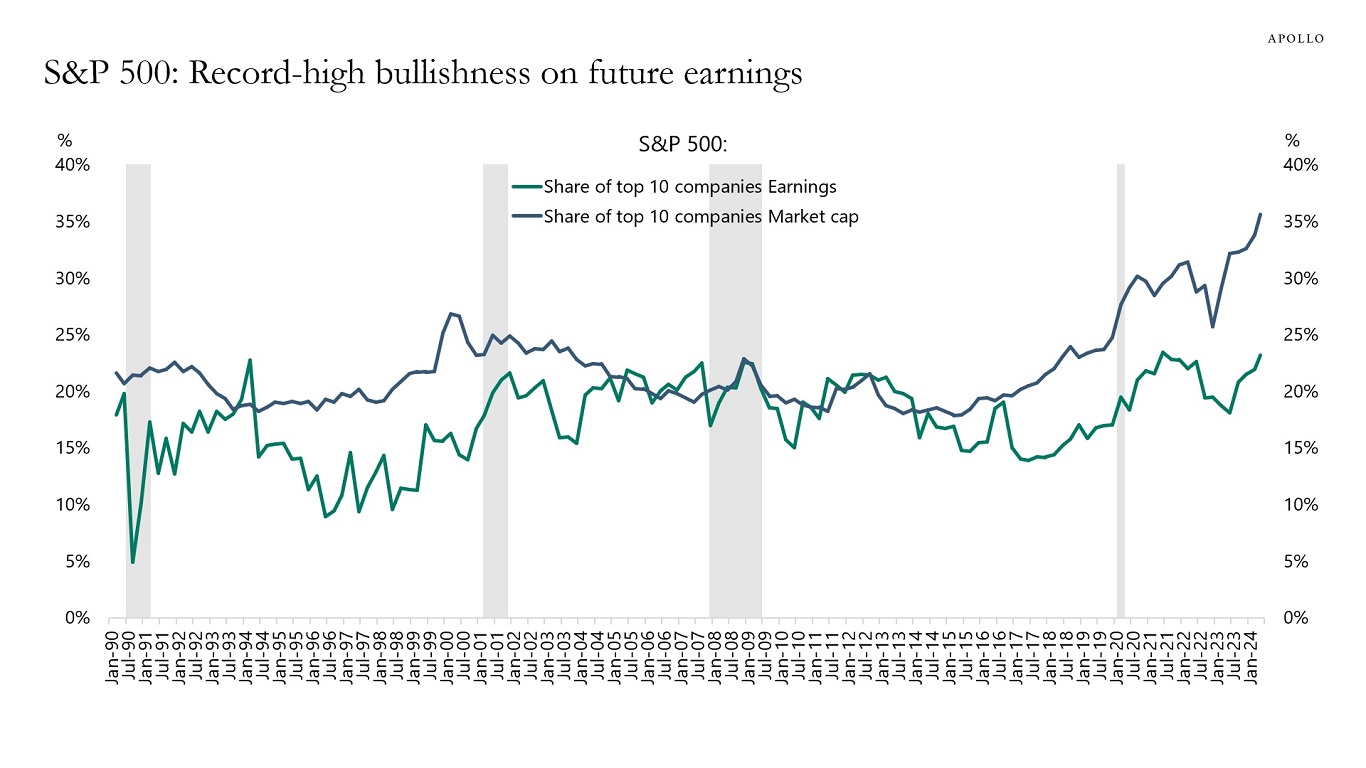
The top 10 companies in the S&P 500 make up 35% of the market cap but only 23% of earnings, see chart below.
This divergence has never been bigger, suggesting that the market is record bullish on future earnings for the top 10 companies in the index.
In other words, the problem for the S&P 500 today is not only the high concentration but also the record- high bullishness on future earnings from a small group of companies.
Source: Bloomberg, Apollo Chief Economist See important disclaimers at the bottom of the page.
-
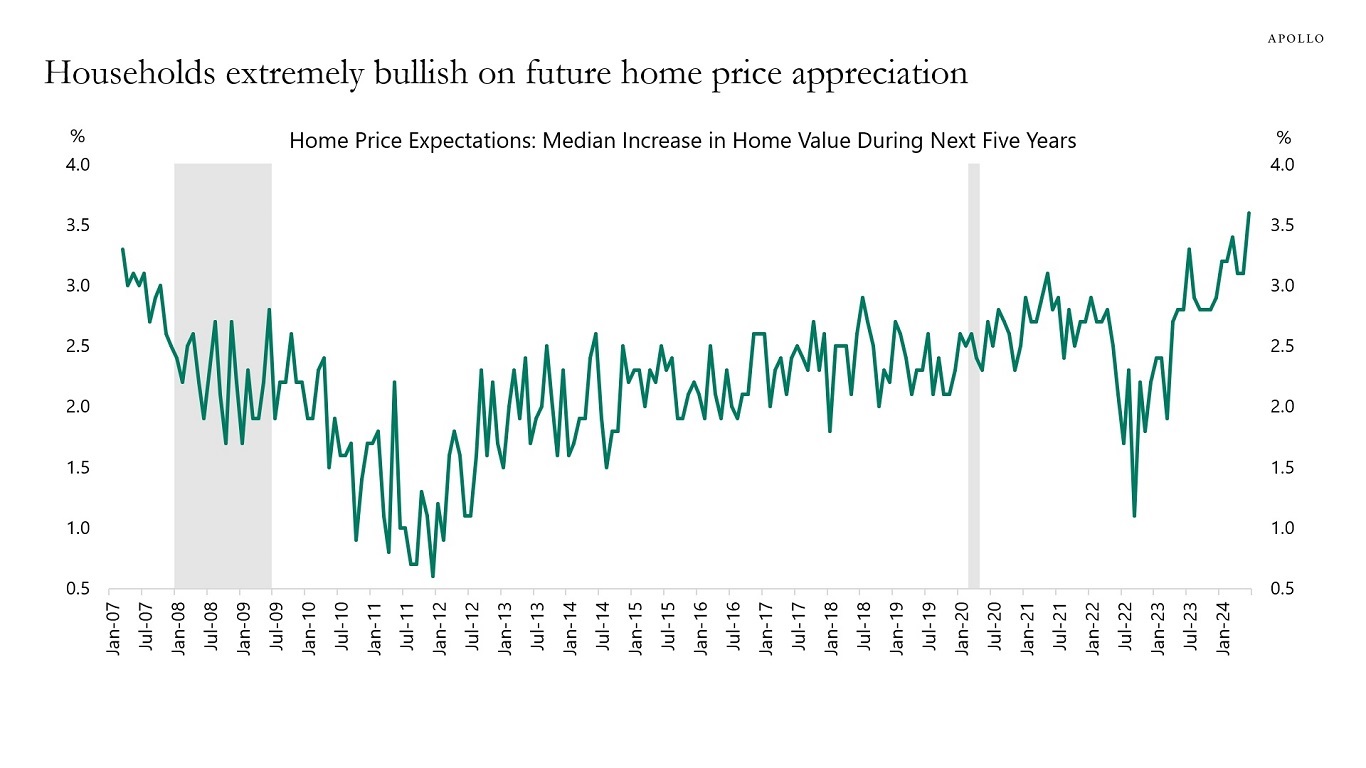
Households have record-high expectations for how much home prices will be going up over the coming five years, see chart below.
And, as discussed last week, households are also very bullish on the equity market, see here.
Looking ahead, extreme bullishness about home prices and stock prices makes the economy more vulnerable if asset price inflation stops or reverses.
Source: University of Michigan, Haver Analytics, Apollo Chief Economist See important disclaimers at the bottom of the page.
-
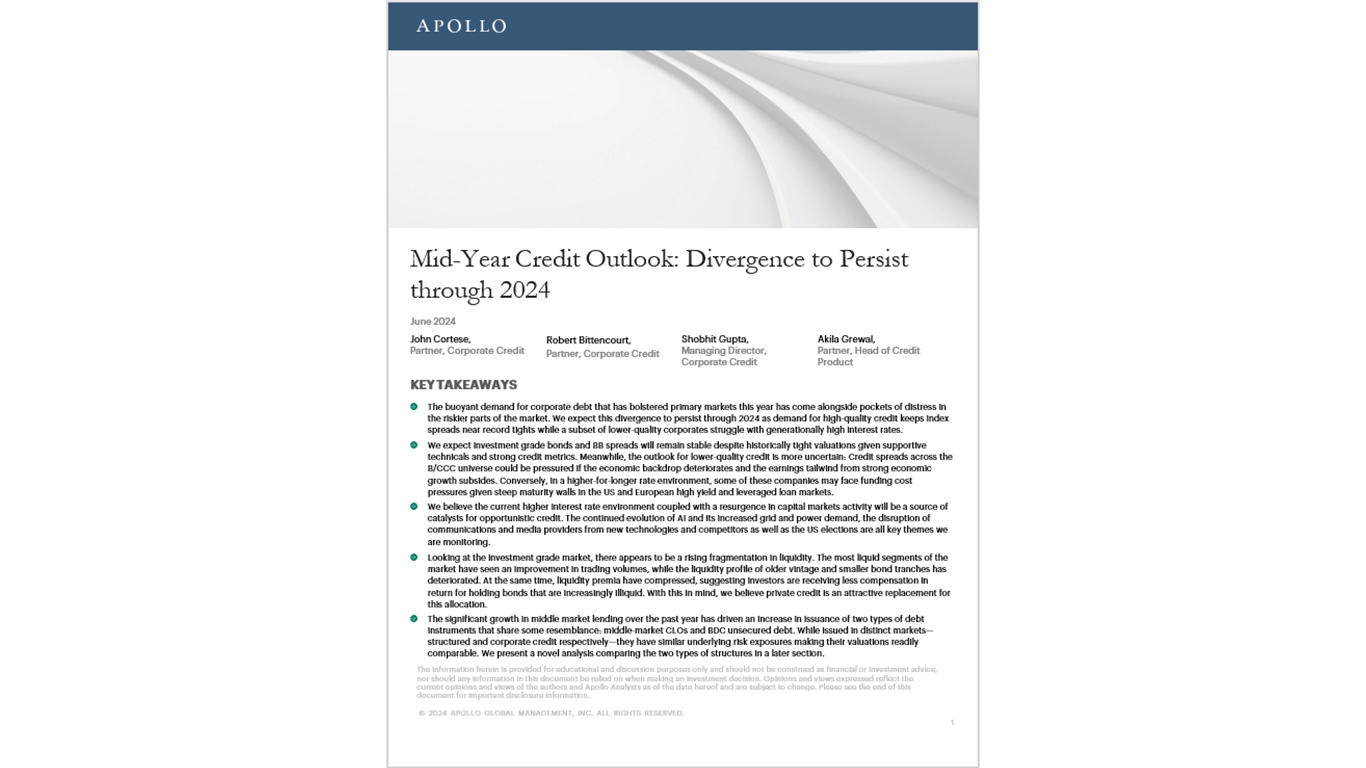
Following the recent publication of our Mid-Year Economic Outlook, our credit team published our inaugural Mid-Year Credit Outlook paper yesterday. It’s available here.
The key themes we explore in this paper are:
- The buoyant demand for corporate debt that bolstered primary markets this year came alongside pockets of distress in the riskier parts of the market. We expect this divergence to persist through 2024 as demand for high-quality credit keeps index spreads near record tights while a subset of lower-quality corporates struggle with generationally high interest rates.
- We expect investment grade bonds and BB spreads to remain stable despite tight valuations, given elevated funding costs do not pose a meaningful risk for the credit metrics of these issuers. Meanwhile, the outlook for lower-quality credit is more uncertain and credit spreads across the B/CCC universe could be pressured if the economic backdrop deteriorates or in a higher-for-longer rate environment.
- The continued evolution of AI and its increased grid and power demand, the disruption of media providers from new technologies and competitors as well as the US elections are all key themes we expect will take center stage throughout the rest of the year.
- Looking at the investment grade market, there appears to be a rising fragmentation when it comes to liquidity. The most liquid segments of the market have seen an improvement in trading volumes, while the liquidity profile of older vintage and smaller bonds has deteriorated. At the same time, given liquidity premia have compressed, we believe private credit is an attractive replacement for this allocation.
- The significant growth in middle market lending over the past year has driven an increase in issuance of two types of debt instruments that share some resemblance: middle-market CLOs and BDC unsecured debt. While issued in distinct markets, they have similar underlying risk exposures making their valuations readily comparable. We present a novel analysis comparing the two types of structures.
See important disclaimers at the bottom of the page.
-
It is difficult to be negative on the economic outlook when household net worth relative to income is near record high levels, see chart below.
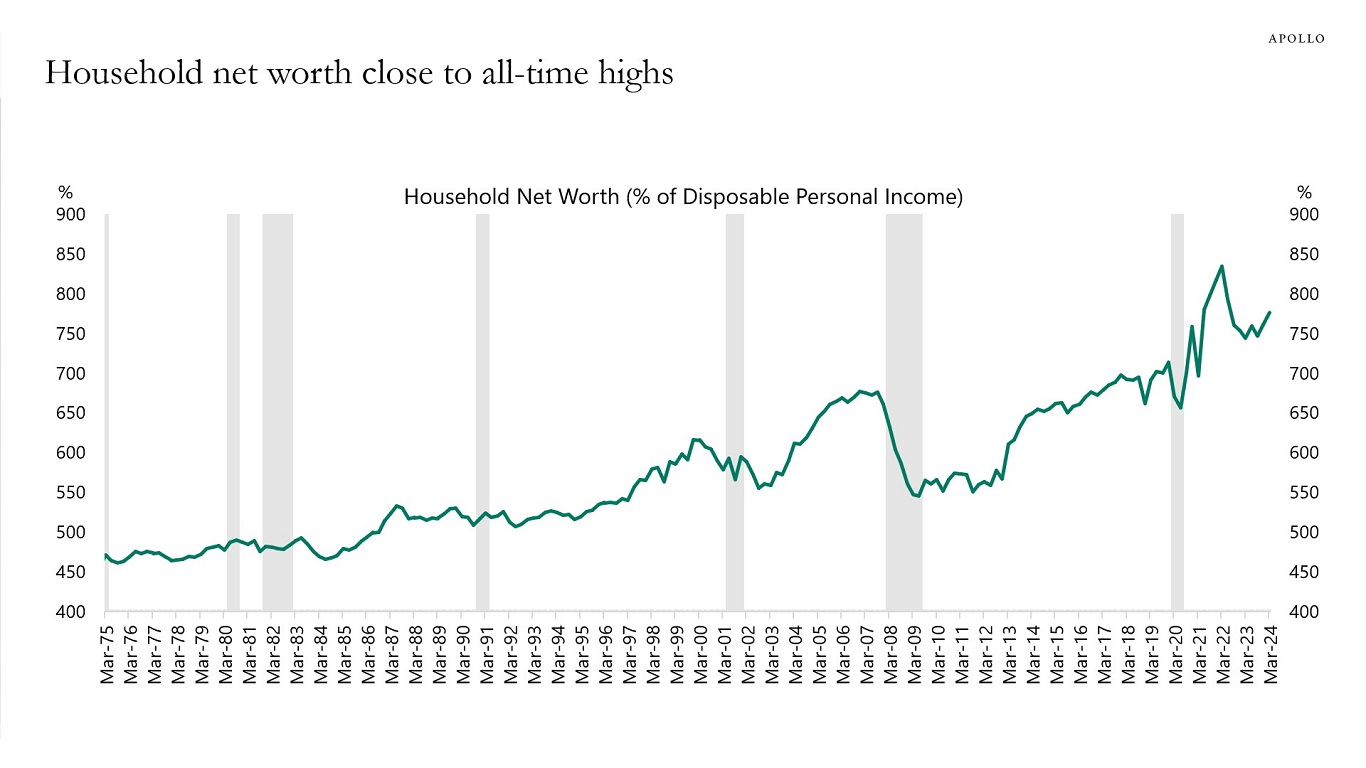
Source: FRB, Haver Analytics, Apollo Chief Economist See important disclaimers at the bottom of the page.

This presentation may not be distributed, transmitted or otherwise communicated to others in whole or in part without the express consent of Apollo Global Management, Inc. (together with its subsidiaries, “Apollo”).
Apollo makes no representation or warranty, expressed or implied, with respect to the accuracy, reasonableness, or completeness of any of the statements made during this presentation, including, but not limited to, statements obtained from third parties. Opinions, estimates and projections constitute the current judgment of the speaker as of the date indicated. They do not necessarily reflect the views and opinions of Apollo and are subject to change at any time without notice. Apollo does not have any responsibility to update this presentation to account for such changes. There can be no assurance that any trends discussed during this presentation will continue.
Statements made throughout this presentation are not intended to provide, and should not be relied upon for, accounting, legal or tax advice and do not constitute an investment recommendation or investment advice. Investors should make an independent investigation of the information discussed during this presentation, including consulting their tax, legal, accounting or other advisors about such information. Apollo does not act for you and is not responsible for providing you with the protections afforded to its clients. This presentation does not constitute an offer to sell, or the solicitation of an offer to buy, any security, product or service, including interest in any investment product or fund or account managed or advised by Apollo.
Certain statements made throughout this presentation may be “forward-looking” in nature. Due to various risks and uncertainties, actual events or results may differ materially from those reflected or contemplated in such forward-looking information. As such, undue reliance should not be placed on such statements. Forward-looking statements may be identified by the use of terminology including, but not limited to, “may”, “will”, “should”, “expect”, “anticipate”, “target”, “project”, “estimate”, “intend”, “continue” or “believe” or the negatives thereof or other variations thereon or comparable terminology.