


Want it delivered daily to your inbox?
-
E-Verify is a Department of Homeland Security website that allows businesses to determine the eligibility of their employees, both US and foreign citizens, to work in the United States. Currently, only 23 states require the use of E-Verify for at least some public and/or private employers.
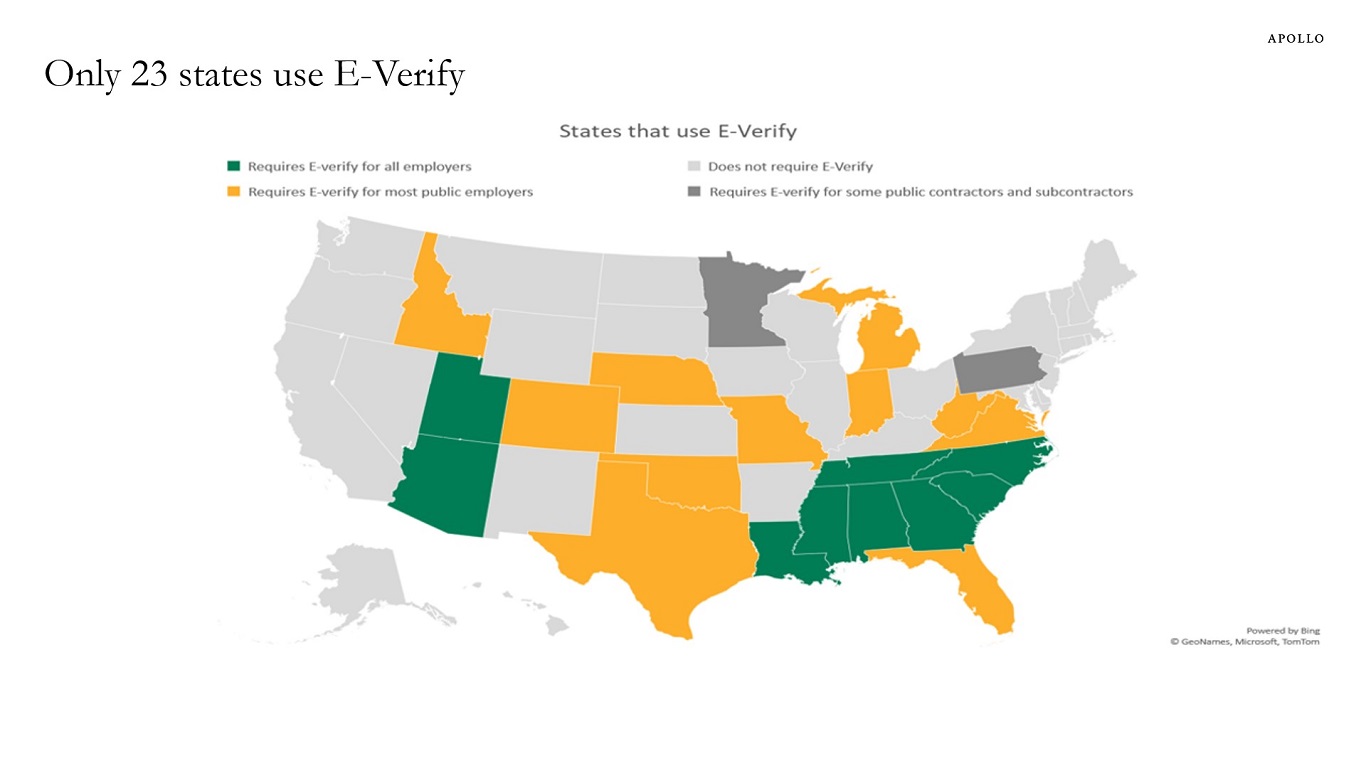
Note: E-Verify is a voluntary internet-based program to help employers verify the work authorization of all new hires. The program is administered by the US Department of Homeland Security in partnership with the Social Security Administration. Currently, 23 states require the use of E-Verify for at least some public and/or private employers. Source: NCSL, Apollo Chief Economist See important disclaimers at the bottom of the page.
-
Since the Fed started raising rates, the terminal rate has fluctuated between 2% and 4.5%, see chart below.
That’s a pretty wide range of outcomes.
The bottom line is that the market narrative at any point in time is almost always wrong.
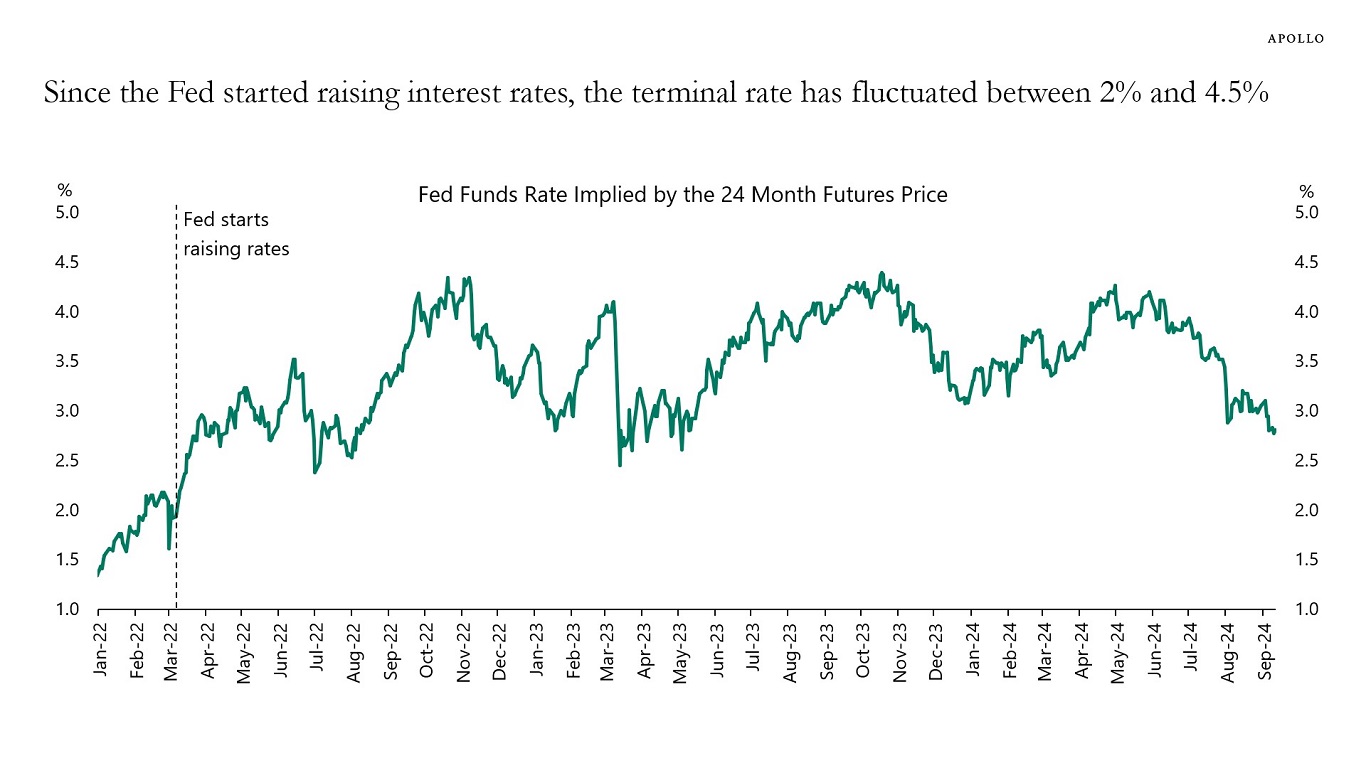
Source: CME, Haver Analytics, Apollo Chief Economist See important disclaimers at the bottom of the page.
-
Fed Chair Powell told the audience at Jackson Hole that “the time has come for policy to adjust,” acknowledging recent progress on inflation, and setting the scene for a rate cut today—the first reduction in more than four years.
While the announcement provided investors with much-needed clarity about the timing of the first rate cut, there remains a large deal of disagreement around the magnitude of rate cuts throughout the rest of the year and into 2025. It seems as though overnight investors have replaced concerns about a stubbornly high inflation with a possible recession that will force the Fed to cut rates more aggressively.
In our view, recent economic data—including the July and August payrolls reports—point to an economy that is slowing down but not heading into a recession. This was very much the outcome that the Fed was working towards given the resilience and stamina of the US economy over the past three years. While employment gains have been more moderate over the last three months, average hourly earnings have increased, and the unemployment rate declined in August. On top of that, recent economic indicators continue to point to a strong economy. Initial jobless claim applications fell to the lowest since July, US retail sales accelerated in July by the most since early 2023, and gross domestic product rose at a 3% annualized rate during the second quarter, up from the previous estimate of 2.8%. Other indicators continue to signal robust growth: Restaurant bookings, TSA travel data, hotel bookings and box office revenue remain strong.
Even if the Fed embarks on an easing cycle, we believe that interest rates will remain relatively higher for longer. If we assume the interest rate futures market is correct in pricing in at least four rate cuts in 2024—which we believe is overblown—short-term interest rates would by the end of 2024 be around 4.5%, a level that would still be the highest for overnight rates since 2007 (excluding the Fed’s current hiking cycle). Furthermore, if we take in the expectations for additional ~five rate cuts in 2025, rates will reach 3% by the end of next year, which is nearly double the average 1.8% rate over the past decade.
A soft landing remains our base case, driving our broadly constructive view on direct lending. Our expectation remains that it will take longer for inflation to come down to the central bank’s 2% target range, and as a result the curve will continue to steepen, meaning long rates are going to decline less than short rates. The combination of a strong economic backdrop along with elevated yields further out the curve is favorable for high-quality private credit. With private credit spreads of 5%-6% and Original Issue Discounts of 2% factored in, investors should still be able to command solid returns over the coming years. We continue to believe that the opportunity set to lend to bigger businesses on a first lien, senior secured basis at elevated yields remains attractive.
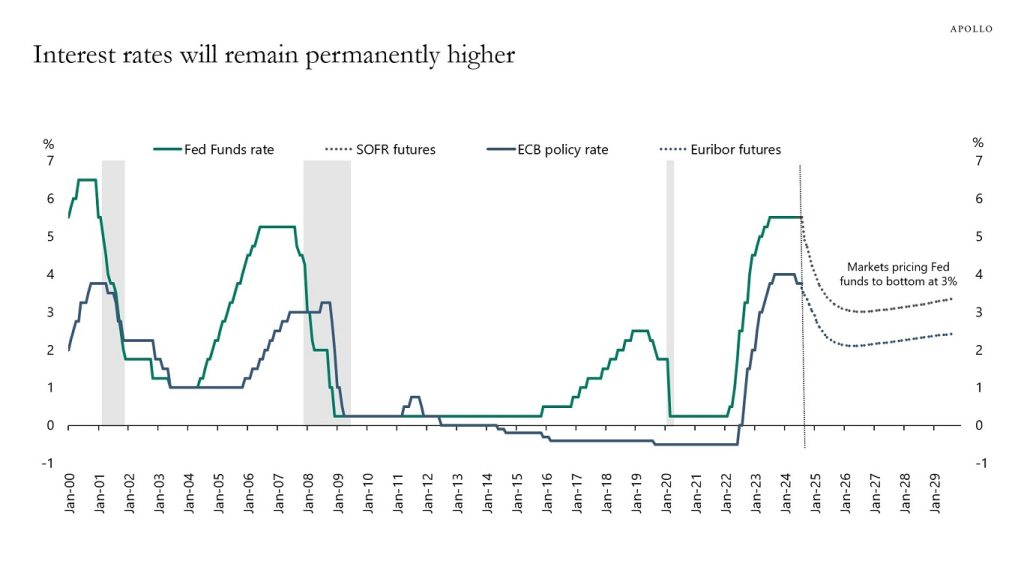
Source: Bloomberg, Apollo Chief Economist See important disclaimers at the bottom of the page.
-
Despite surveys showing that the consensus is expecting a soft landing, rates markets are pricing in a full-blown recession, see chart below.
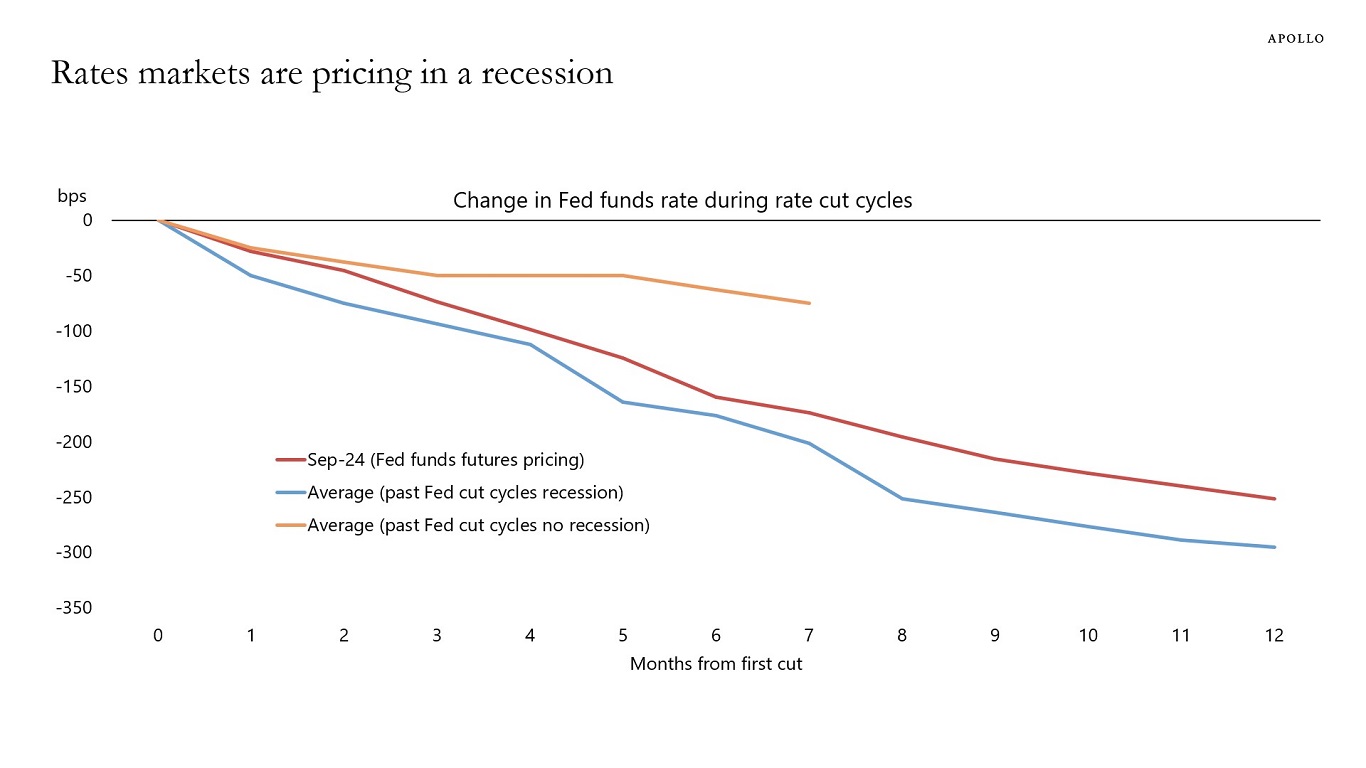
Source: FRB, Haver Analytics, Bloomberg, Apollo Chief Economist See important disclaimers at the bottom of the page.
-
Manufacturing wages in China are now 20% of manufacturing wages in the US, and manufacturing wages in India are 3% of US wages, see chart below.
For comparison, GDP per capita in the US is $76,000, in China it is $13,000, and in India $2,000.
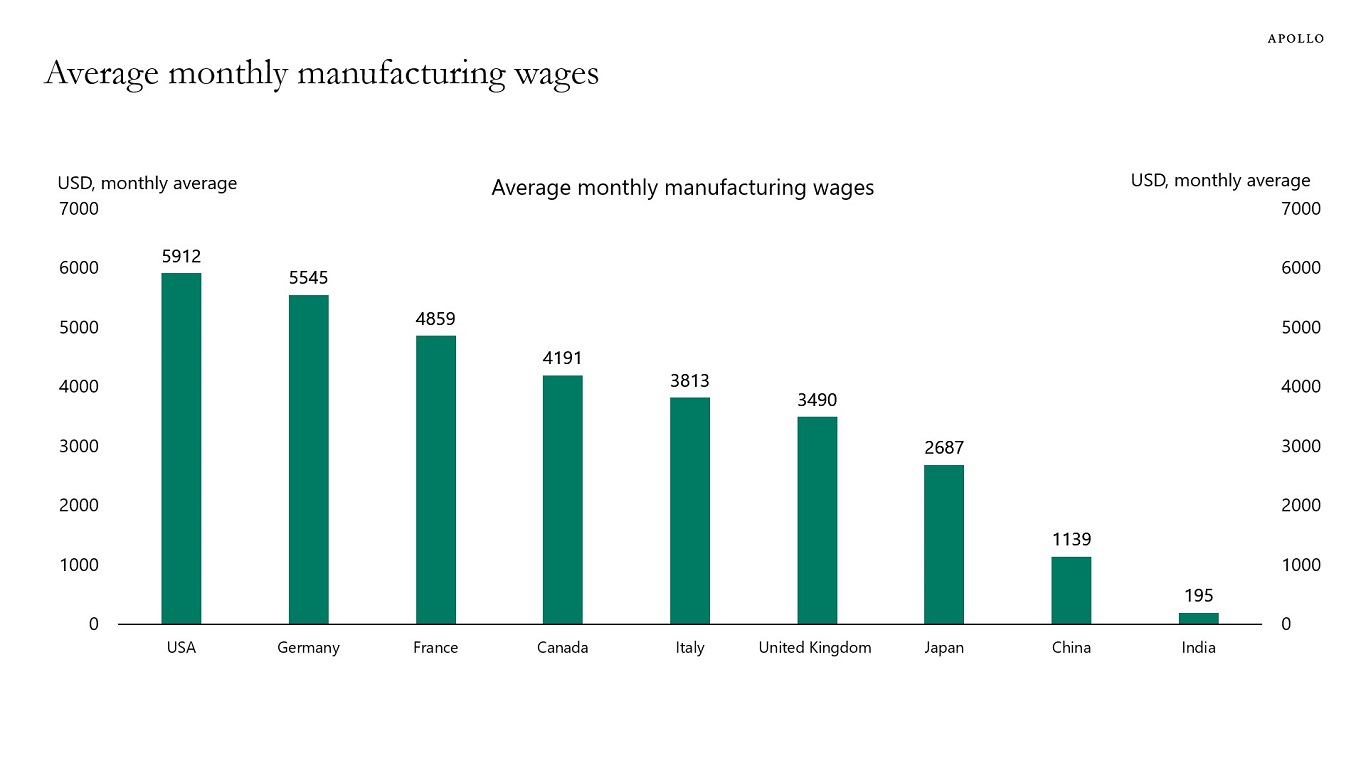
Note: Canada, United Kingdom, United States of America and India data is for 2023. Germany, France, Italy and China data is for 2022. Japan data is for 2021. Source: ILO, National Bureau of Statistics of China, Apollo Chief Economist See important disclaimers at the bottom of the page.
-
There are 10 million participants in defined benefit plans and 90 million in defined contribution plans such as the 401(k), see chart below.
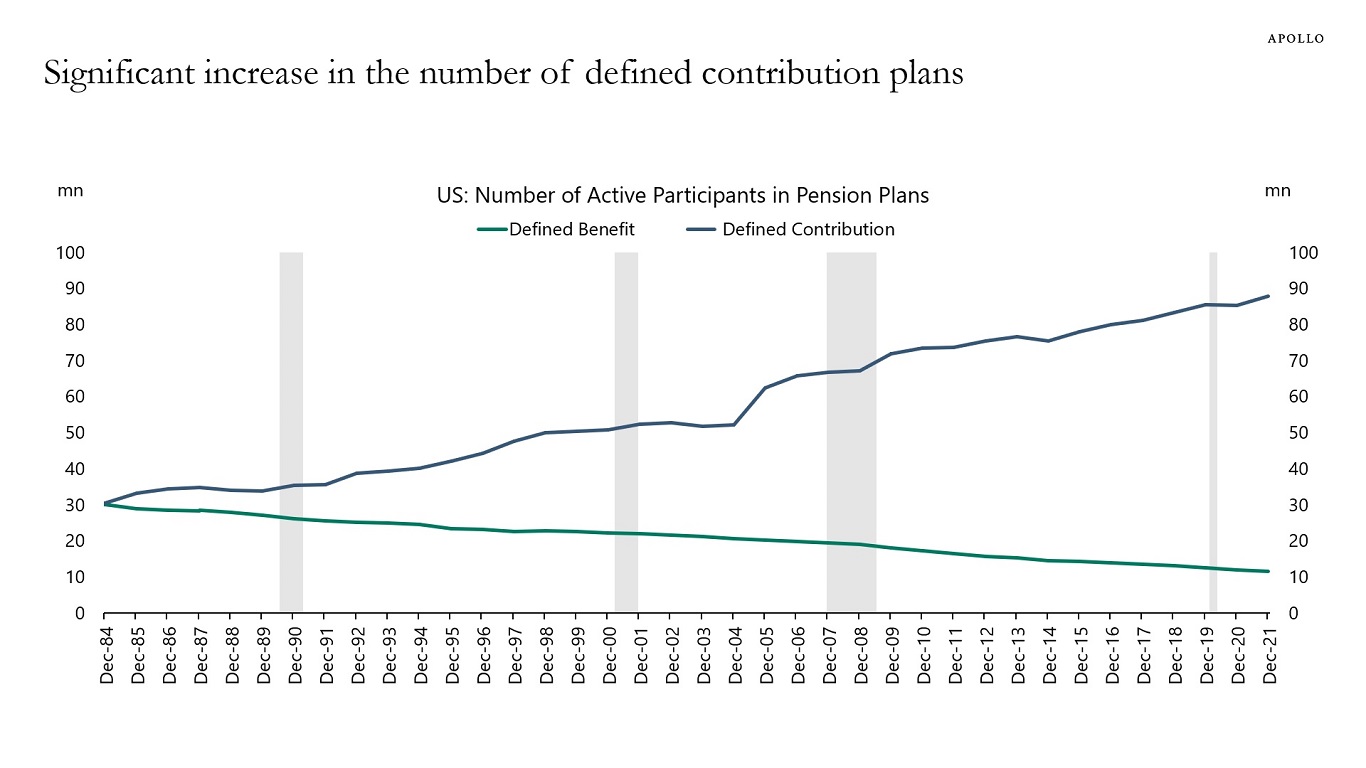
Source: Department of Labor, Apollo Chief Economist See important disclaimers at the bottom of the page.
-
Many FOMC members argue that the Fed funds rate at 5.5% is very restrictive because the Fed’s r-star model says that neutral monetary policy would mean a Fed funds rate at 3%.
But maybe this r-star estimate of the terminal Fed funds rate is wrong. At least that is what the incoming data suggests.
If monetary policy is very restrictive, why are default rates going down, see the first chart?
If monetary policy is very restrictive, why is the Atlanta Fed GDP Now estimate for third quarter GDP at 2.5%, well above the CBO’s estimate of long-run growth at 2%, see the second chart?
If monetary policy is very restrictive, why is weekly data for consumer spending still strong, see the third chart?
The bottom line is that the Fed funds rate at 5.5% does not seem very restrictive.
Our latest chart book with daily and weekly indicators is available here.
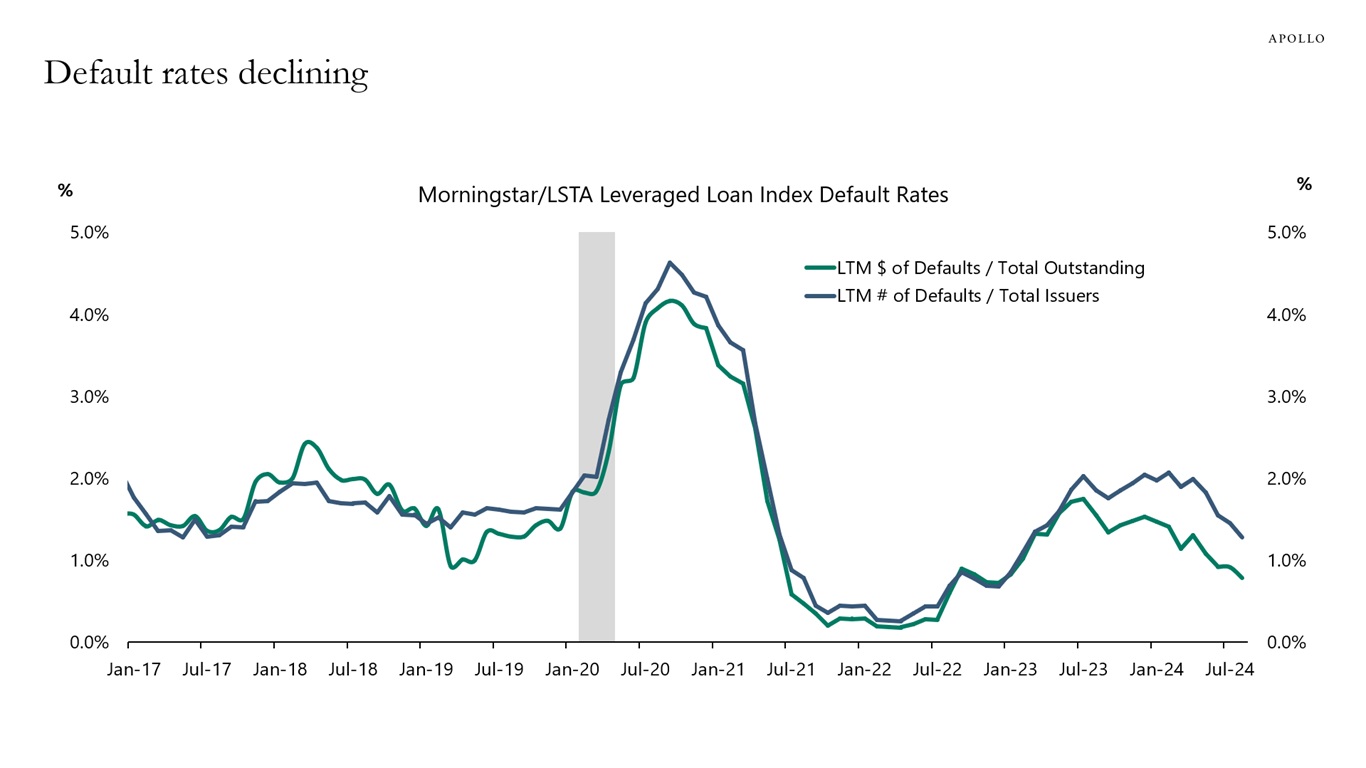
Source: PitchBook LCD, Apollo Chief Economist 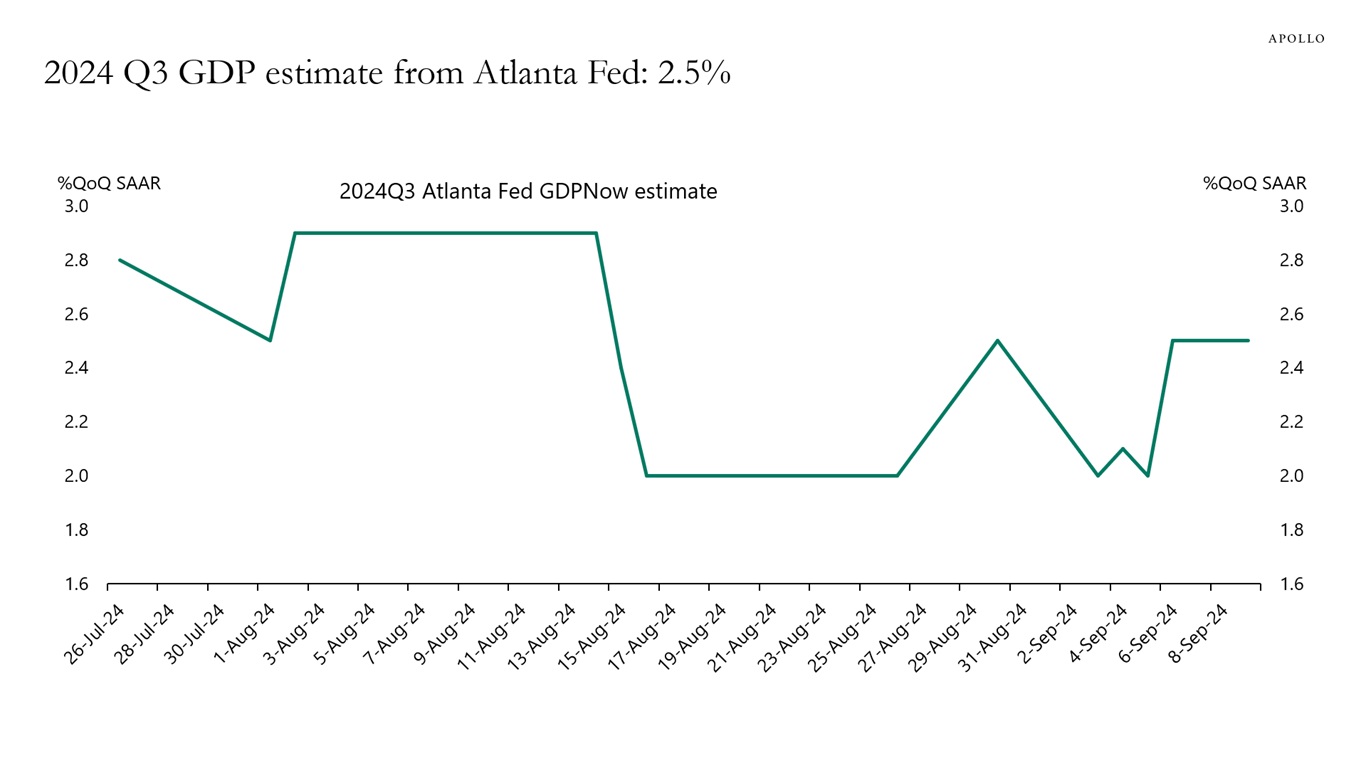
Source: Federal Reserve Bank of Atlanta, Haver Analytics, Apollo Chief Economist 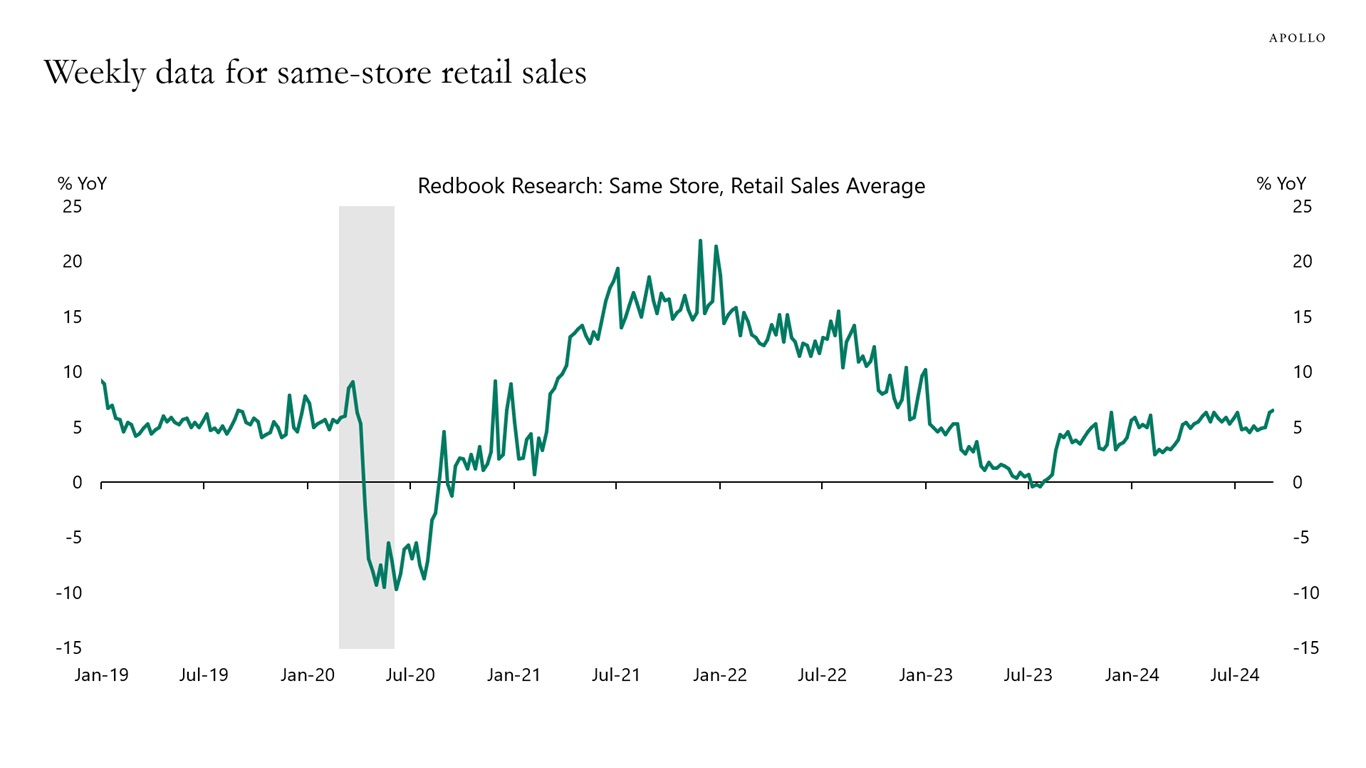
Source: Redbook, Haver Analytics, Apollo Chief Economist See important disclaimers at the bottom of the page.
-
Foreign demand for US credit is near all-time highs, see chart below.

Source: US Treasury, Haver Analytics, Apollo Chief Economist See important disclaimers at the bottom of the page.
-
Visits to the Statue of Liberty and Ellis Island are back at pre-pandemic levels, see chart below and here.
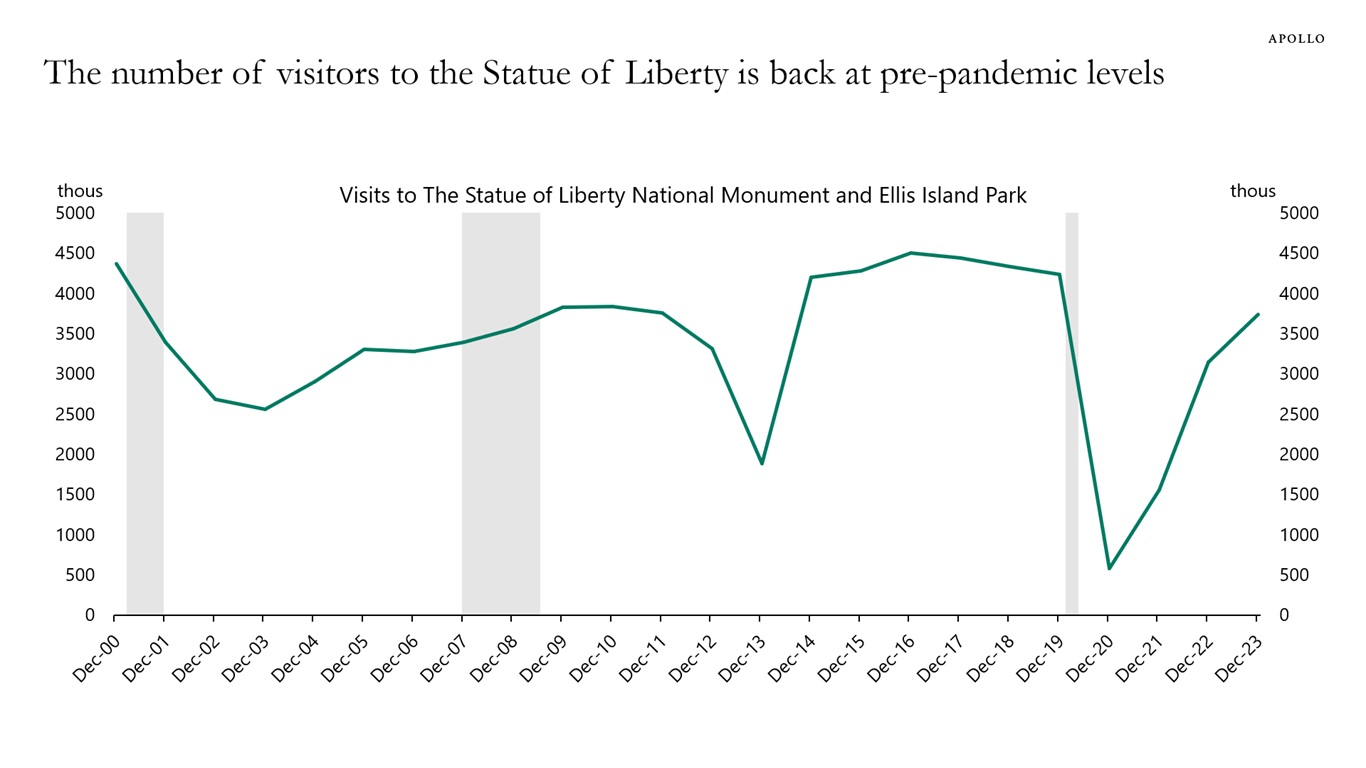
Source: National Park Service, Apollo Chief Economist See important disclaimers at the bottom of the page.
-
The yield curve is no longer inverted, and the recession probability is declining, see charts below.
To understand if a recession is coming, it is a better idea to look at the incoming data than to look at the yield curve because long rates are not only a reflection of the business cycle but also foreign demand, fiscal policy, and the term premium. And the incoming data continues to look just fine, see also here.
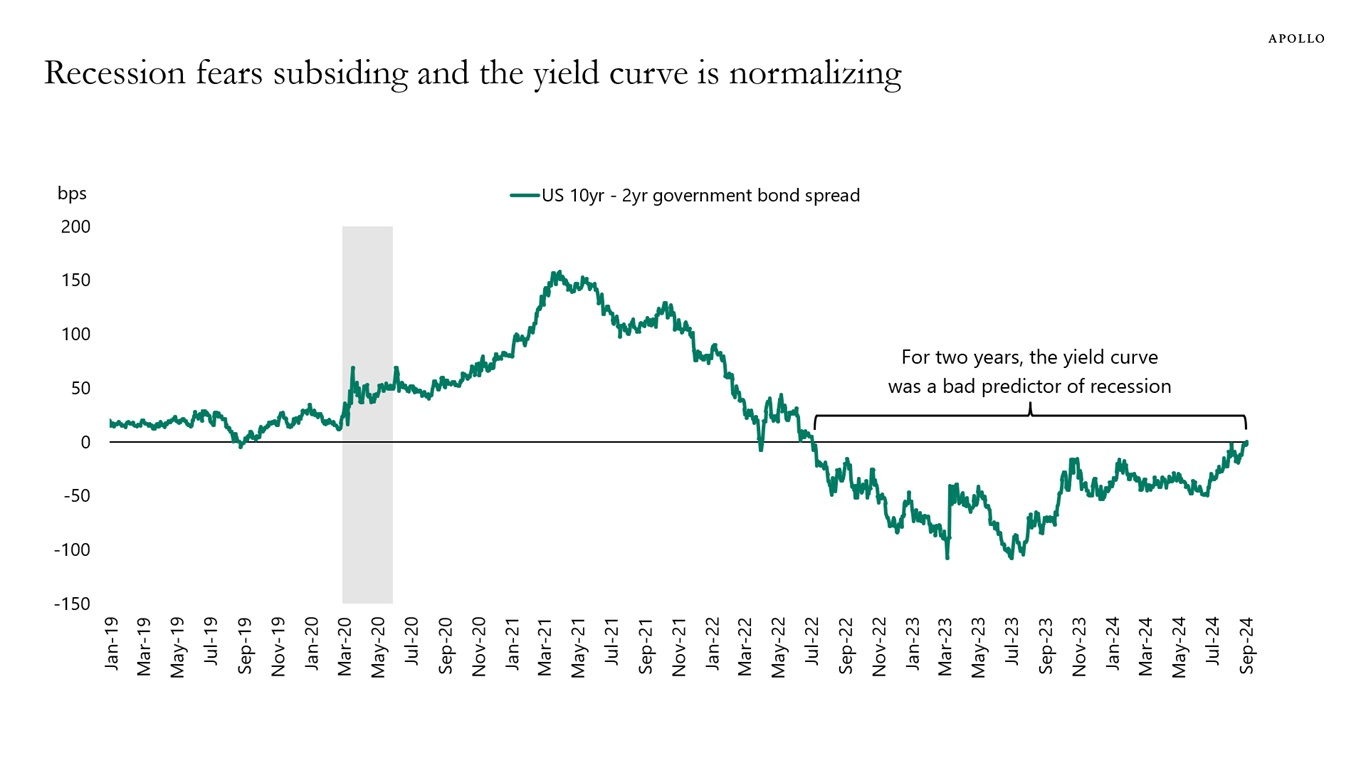
Source: Board of Governors of the Federal Reserve System, Bloomberg, Apollo Chief Economist 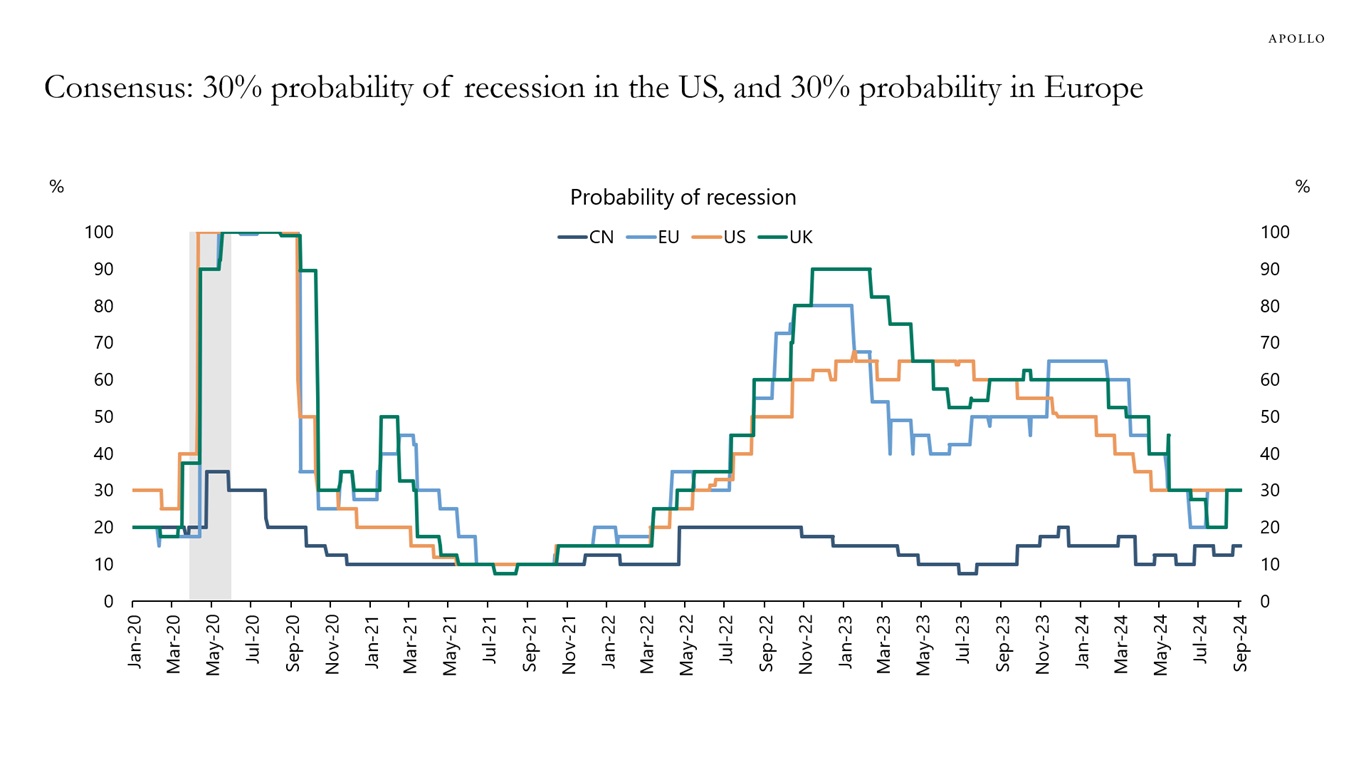
Source: Bloomberg, Apollo Chief Economist See important disclaimers at the bottom of the page.

This presentation may not be distributed, transmitted or otherwise communicated to others in whole or in part without the express consent of Apollo Global Management, Inc. (together with its subsidiaries, “Apollo”).
Apollo makes no representation or warranty, expressed or implied, with respect to the accuracy, reasonableness, or completeness of any of the statements made during this presentation, including, but not limited to, statements obtained from third parties. Opinions, estimates and projections constitute the current judgment of the speaker as of the date indicated. They do not necessarily reflect the views and opinions of Apollo and are subject to change at any time without notice. Apollo does not have any responsibility to update this presentation to account for such changes. There can be no assurance that any trends discussed during this presentation will continue.
Statements made throughout this presentation are not intended to provide, and should not be relied upon for, accounting, legal or tax advice and do not constitute an investment recommendation or investment advice. Investors should make an independent investigation of the information discussed during this presentation, including consulting their tax, legal, accounting or other advisors about such information. Apollo does not act for you and is not responsible for providing you with the protections afforded to its clients. This presentation does not constitute an offer to sell, or the solicitation of an offer to buy, any security, product or service, including interest in any investment product or fund or account managed or advised by Apollo.
Certain statements made throughout this presentation may be “forward-looking” in nature. Due to various risks and uncertainties, actual events or results may differ materially from those reflected or contemplated in such forward-looking information. As such, undue reliance should not be placed on such statements. Forward-looking statements may be identified by the use of terminology including, but not limited to, “may”, “will”, “should”, “expect”, “anticipate”, “target”, “project”, “estimate”, “intend”, “continue” or “believe” or the negatives thereof or other variations thereon or comparable terminology.