


Want it delivered daily to your inbox?
-
All supply chain indicators are now back near 2019 levels, see charts below and in this chart book.
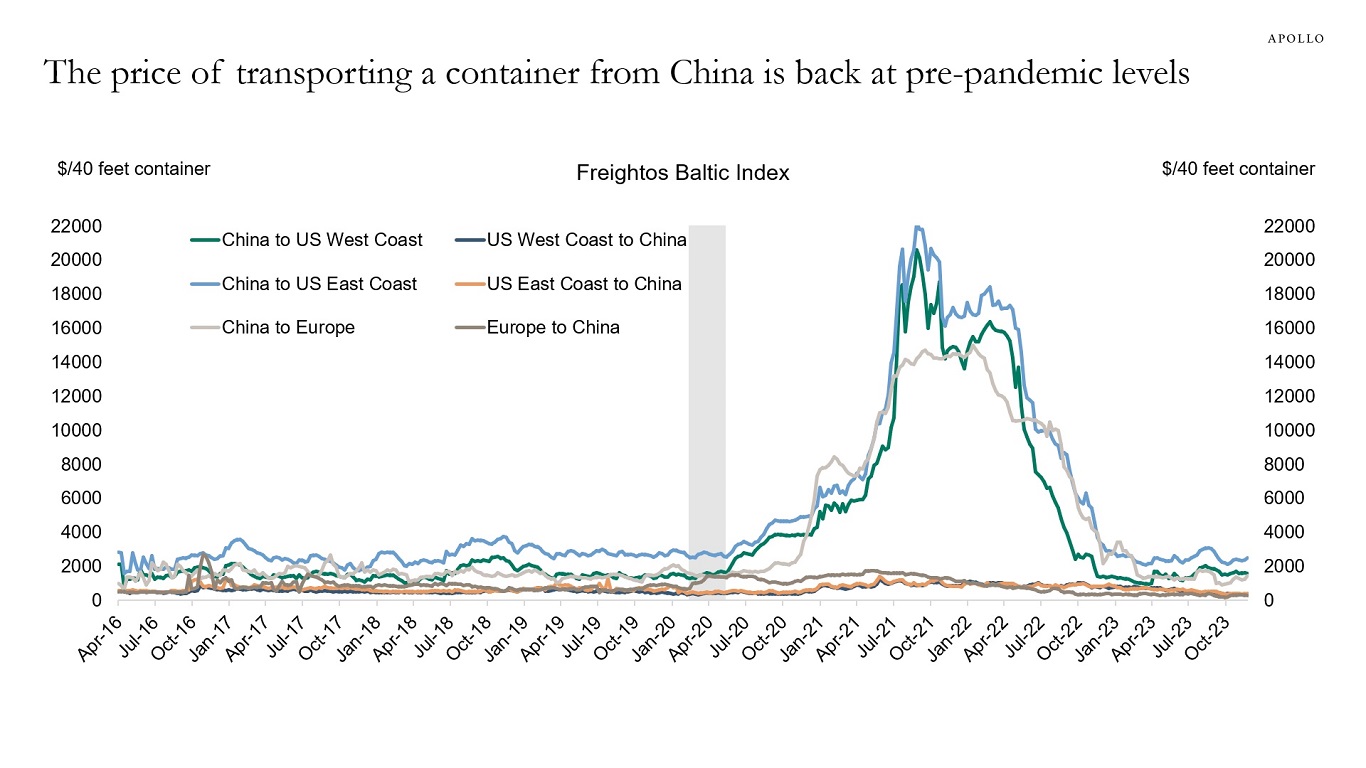
Source: Freightos, Bloomberg, Apollo Chief Economist 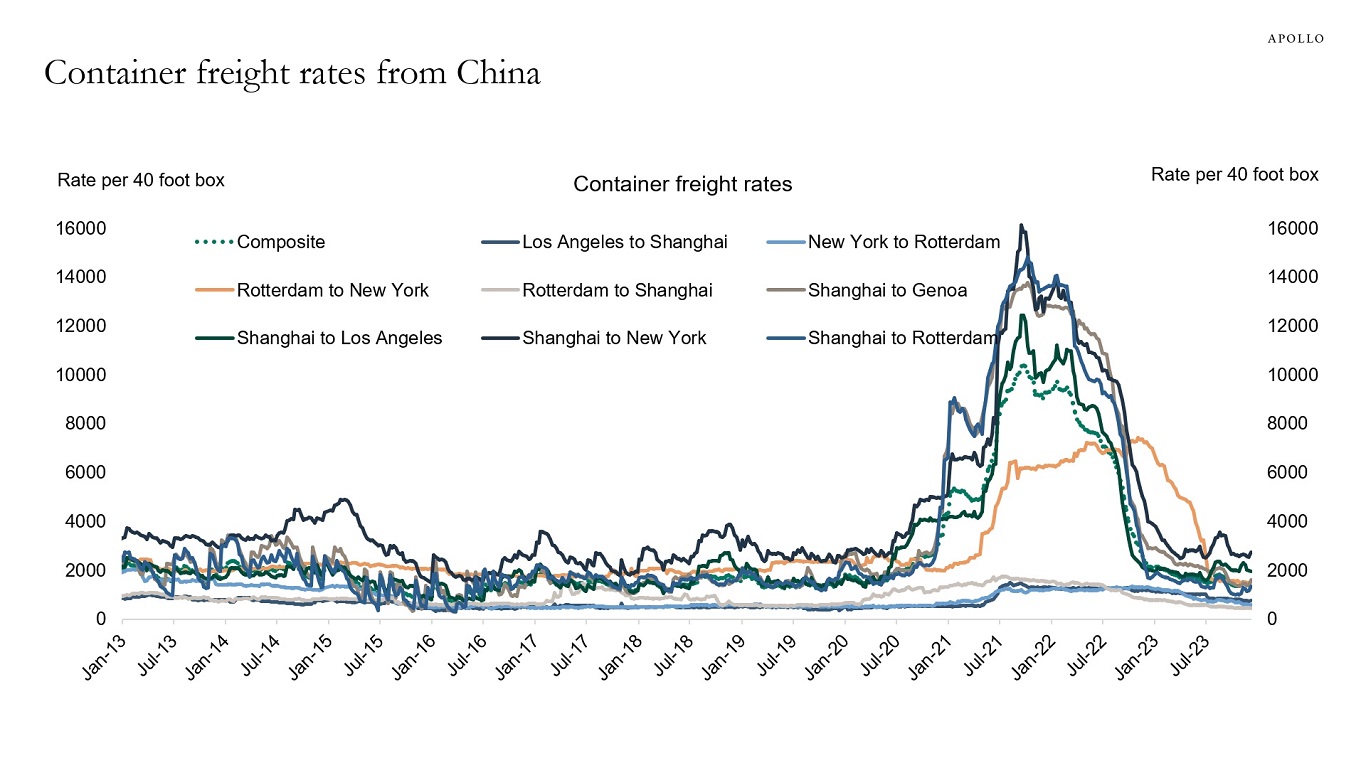
Source: WCI, Bloomberg, Apollo Chief Economist 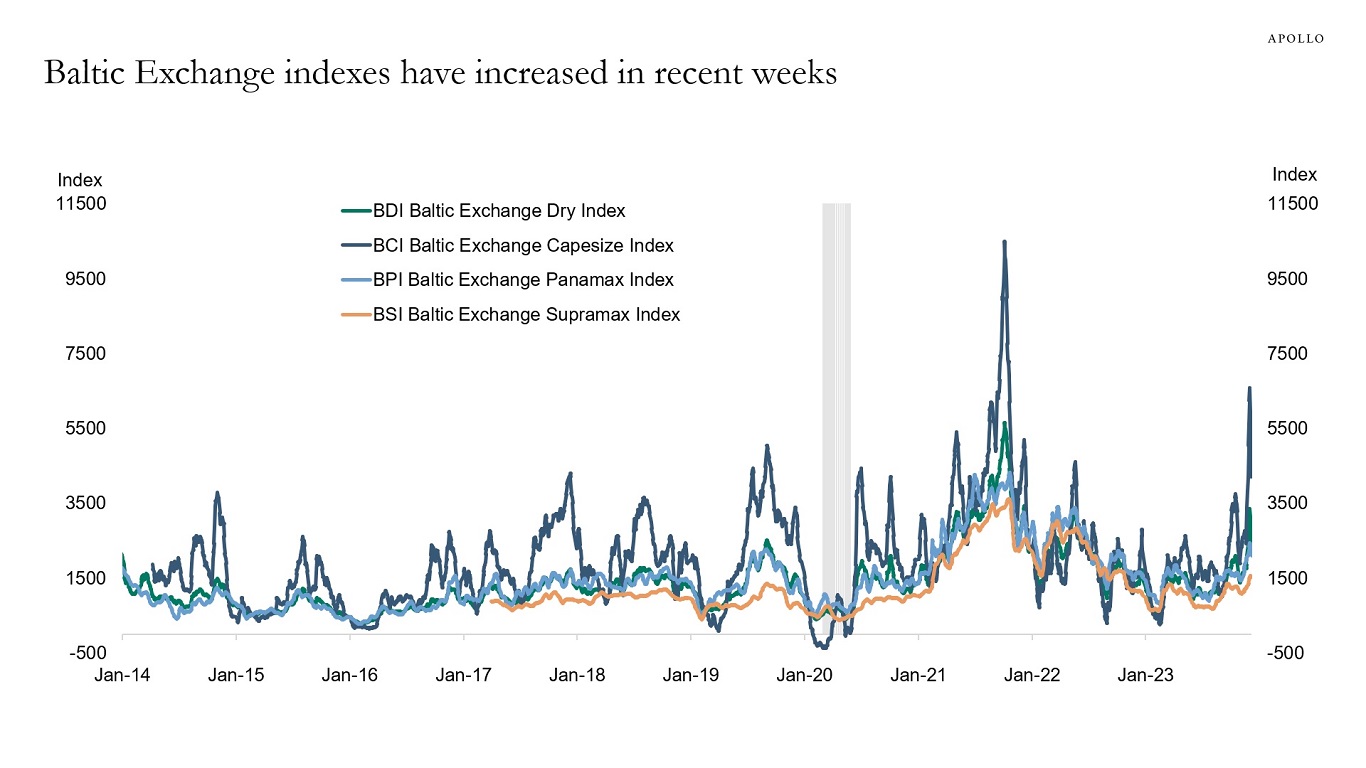
Source: Bloomberg, Apollo Chief Economist 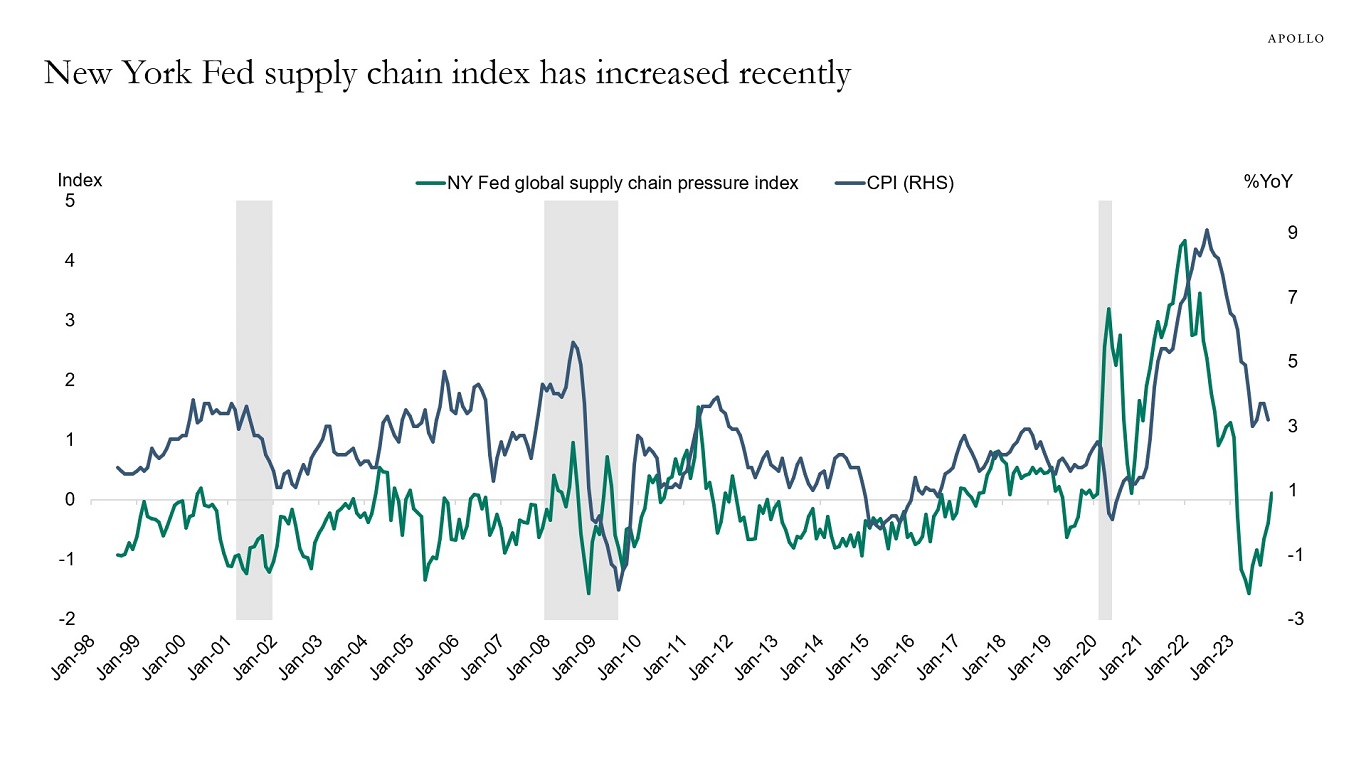
Source: NY Fed, BLS, Haver Analytics, Apollo Chief Economist See important disclaimers at the bottom of the page.
-
FOMC members have since 2021 steadily been revising up their forecasts for where they think the Fed funds rate will be by the end of 2024, see chart below. This changed at their meeting earlier this week, where the Fed signaled that they now see interest rates in 2024 lower than they thought in September.
This pivot in communication, however, does not suggest that the inflation problem has been solved. Looking into 2024, there are upside risks to inflation (from a recovering housing market and easier financial conditions) and downside risks to growth (from the lagged effects of Fed hikes on consumers, firms, and banks).
The bottom line is that they may have pivoted their communication, but the Fed is not yet out of the woods, and the upside risks to inflation and downside risks to growth remain significant.
I will discuss the Fed pivot and our outlook for markets in 2024 in detail in an Apollo Academy class on Wednesday, December 20 at 11 am (eligible for 1 CE credit). Register today.
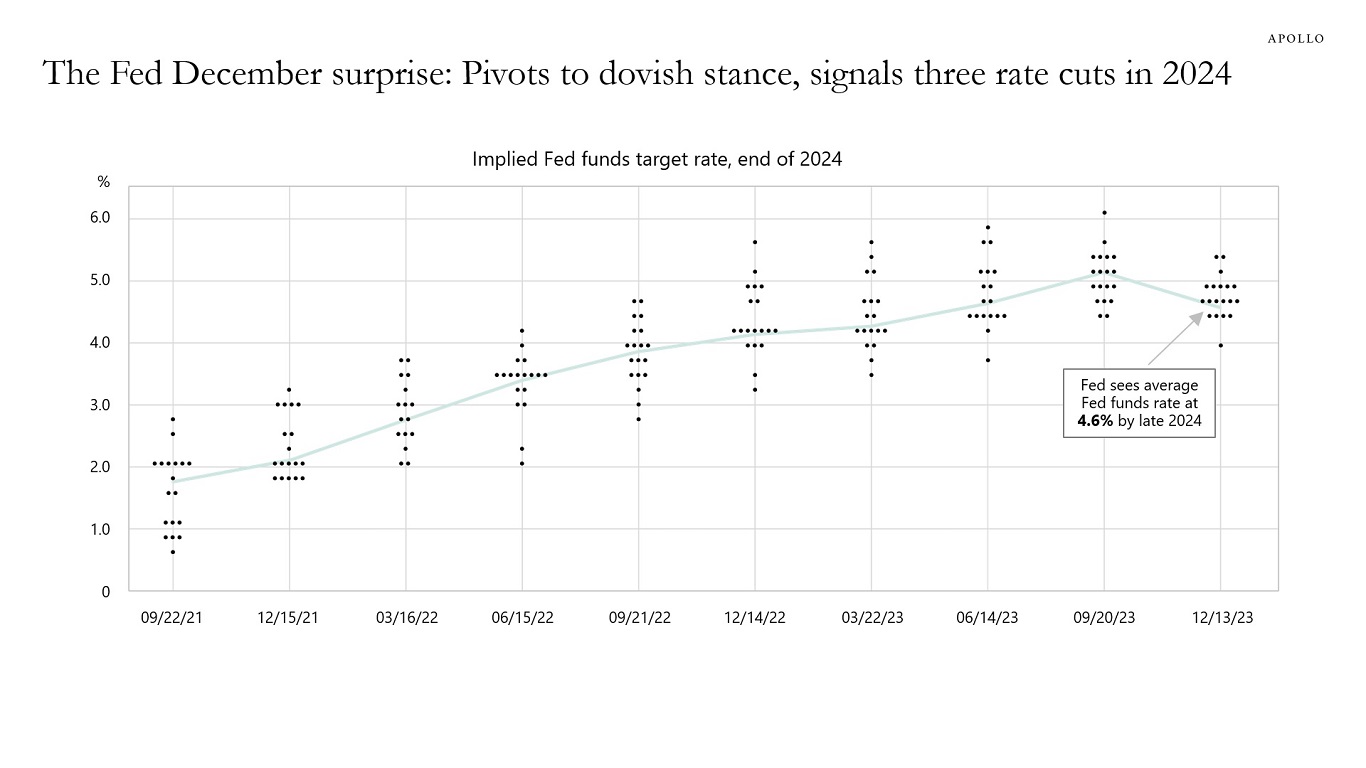
Source: Bloomberg, Federal Reserve Board. Data as of December 14, 2023. See important disclaimers at the bottom of the page.
-
Data from the ECB shows that ECB rate hikes have had a very uneven impact on euro area countries with interest rates for firms increasing much more in periphery countries than in core countries.
For example, interest rates on outstanding loans to non-financial corporations in Ireland and Portugal are currently around 5.6% versus 3.3% in Germany and France, see chart below.
The bottom line is that ECB rate hikes negatively impact the periphery more than the core.
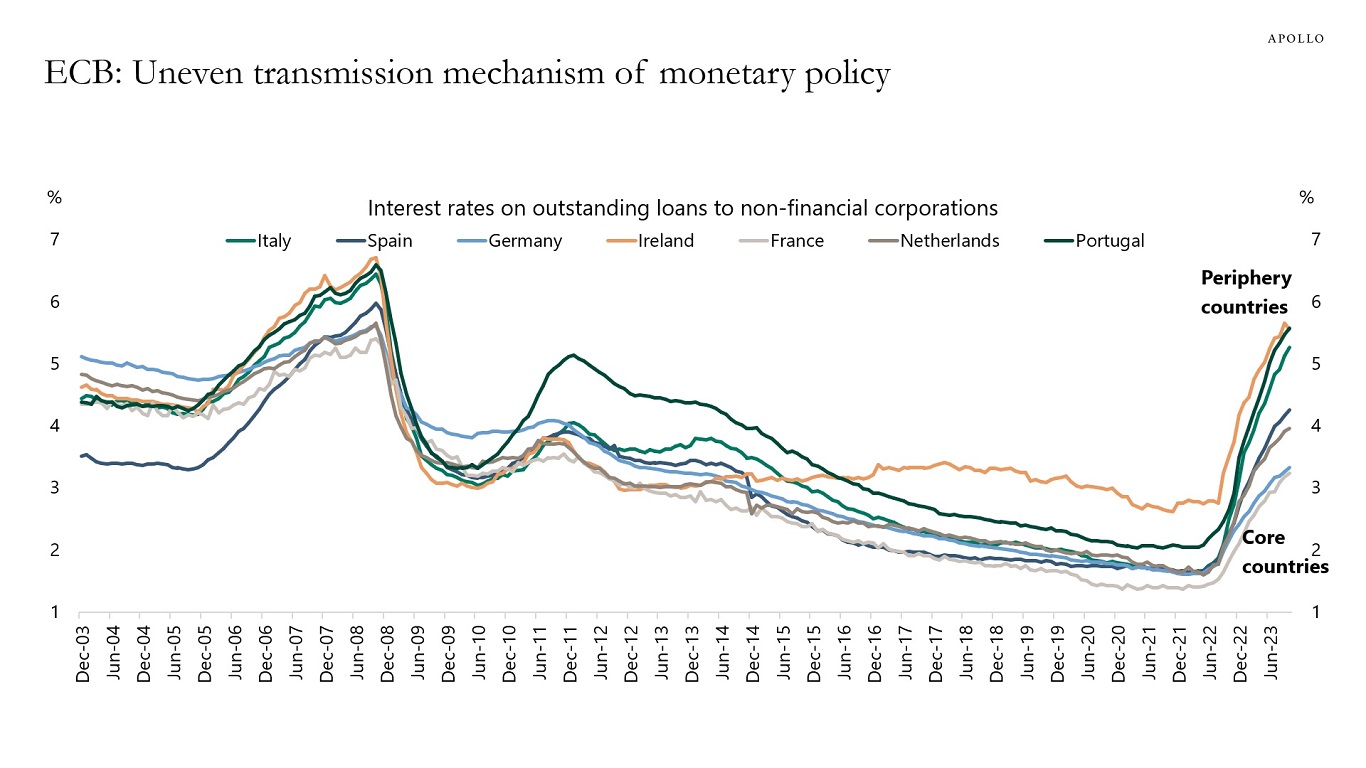
Source: ECB, Bloomberg, Apollo Chief Economist See important disclaimers at the bottom of the page.
-
Trading volume in investment grade bonds was at post-Covid highs in November and significantly above 2019 levels, see chart below.
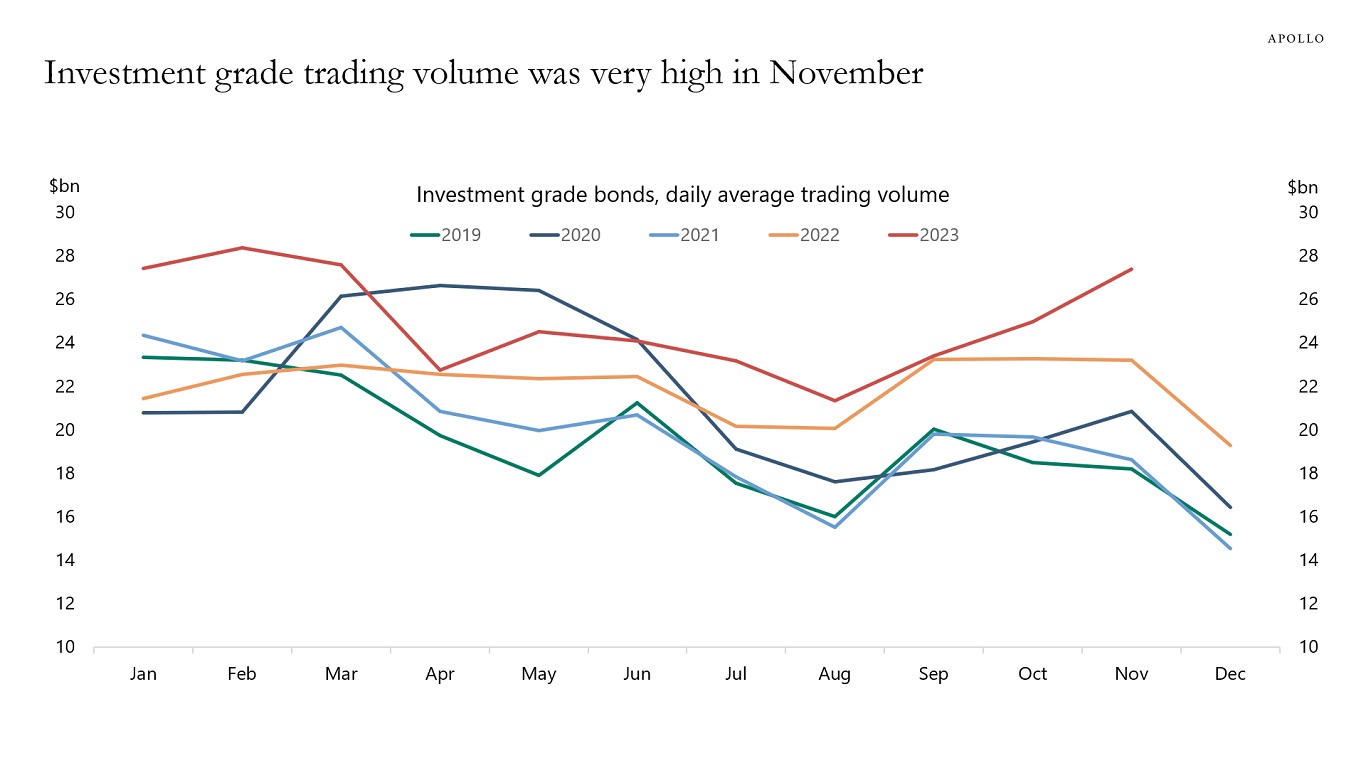
Source: FINRA TRACE, Haver Analytics, Apollo Chief Economist See important disclaimers at the bottom of the page.
-
In recent months, we have seen a significant increase in the number of men age 55 to 64 joining the workforce, see chart below.
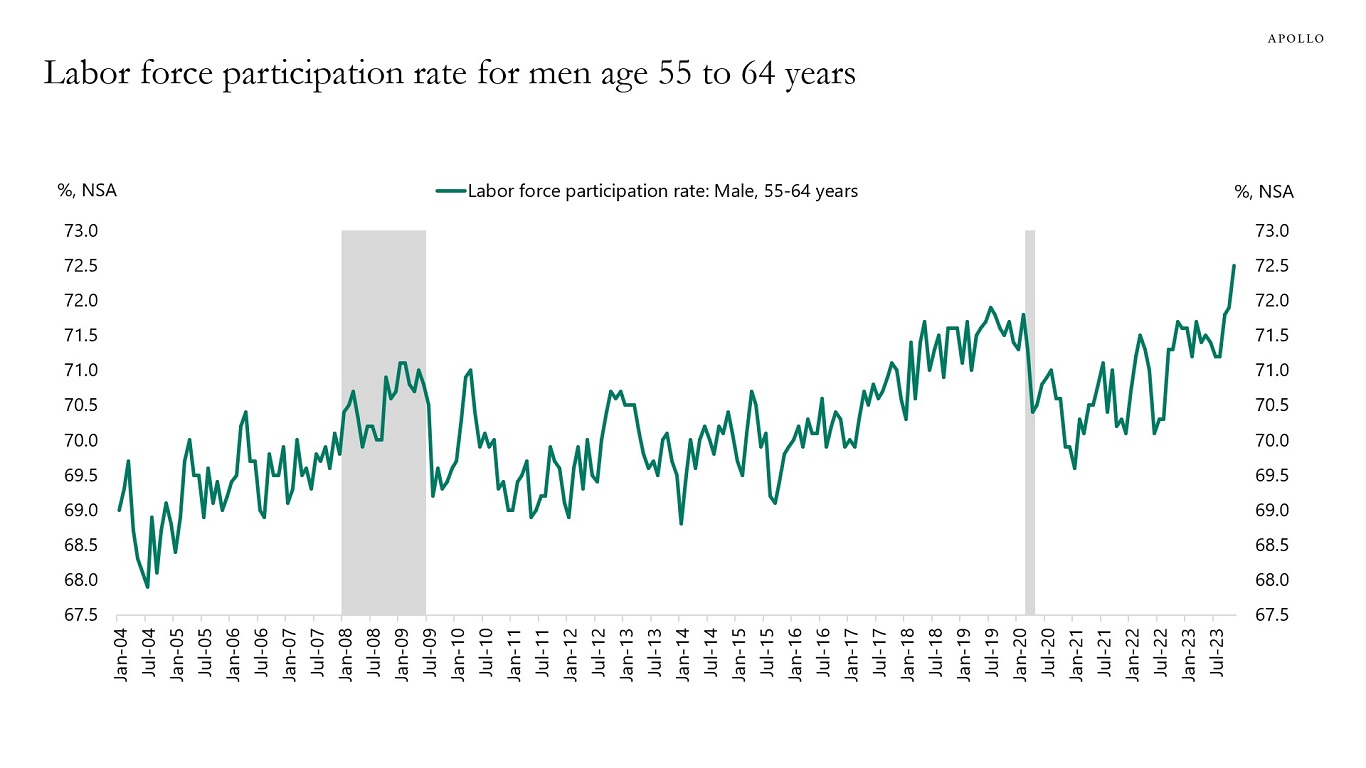
Source: BLS, Haver Analytics, Apollo Chief Economist See important disclaimers at the bottom of the page.
-
There are more Chapter 11 bankruptcy filings in Texas, New Jersey, Delaware, and New York than in other states, see map below.
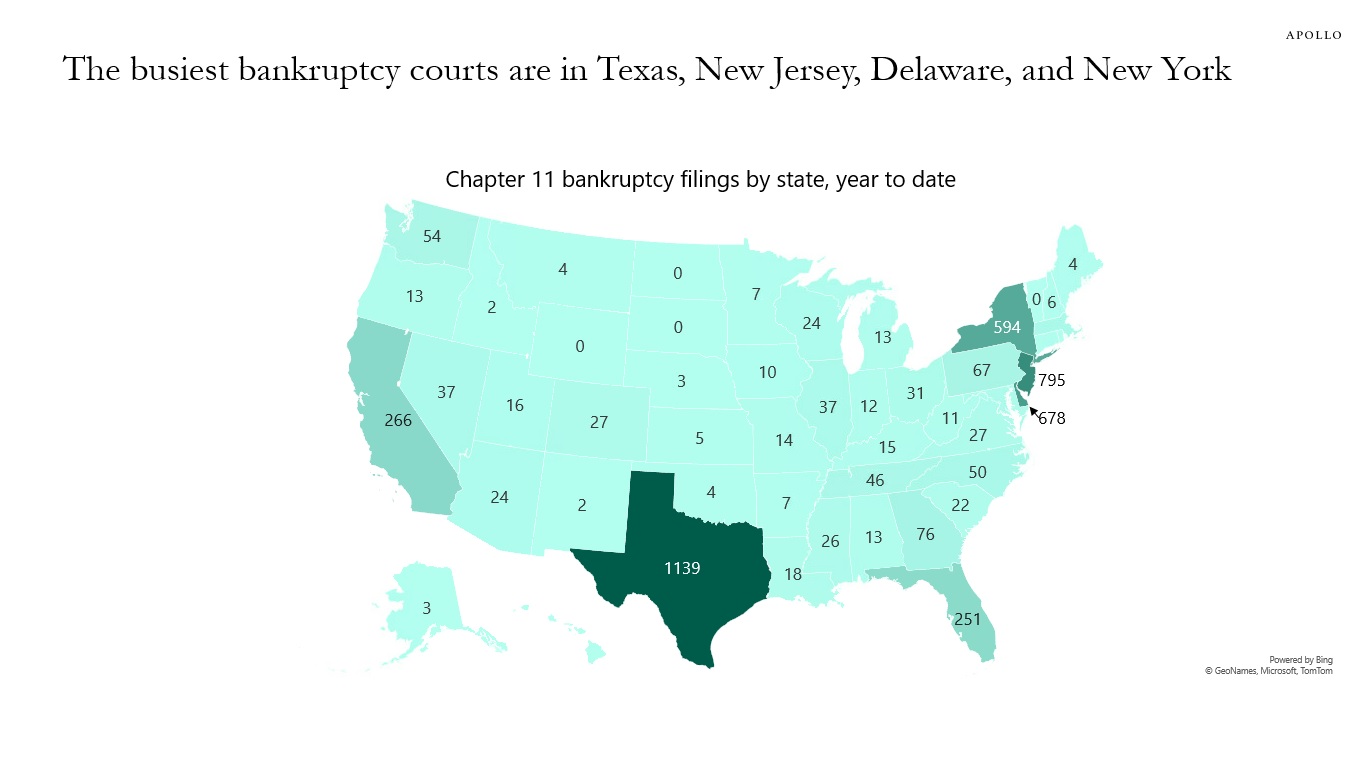
Source: Epiq bankruptcy, Apollo Chief Economist. Data from January 1, 2023 to December 8, 2023. See important disclaimers at the bottom of the page.
-
Data for November shows that Chapter 11 bankruptcy filings are trending higher, and Fed hikes continue to bite harder and harder on highly leveraged firms with little or no cash flows in tech, growth, and venture capital, see chart below.
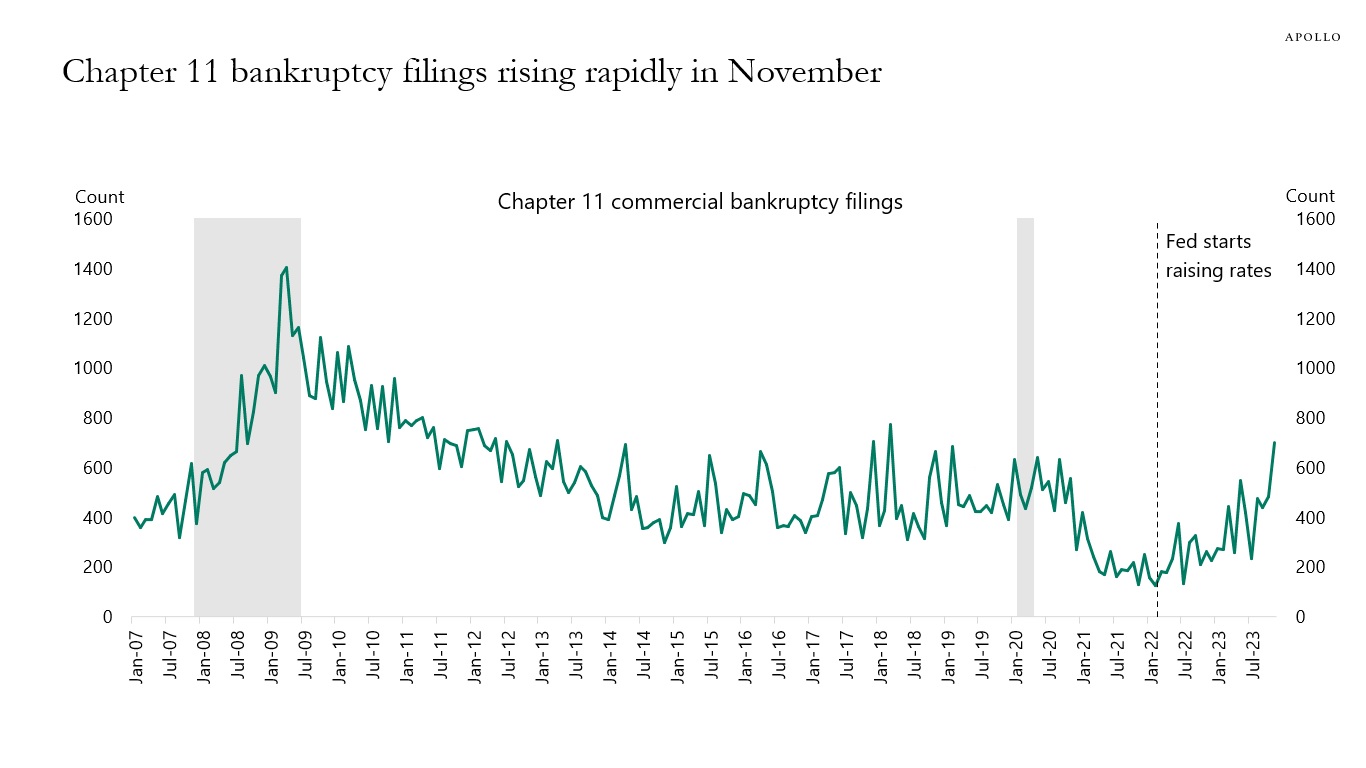
Source: Epiq bankruptcy, Apollo Chief Economist See important disclaimers at the bottom of the page.
-
This chart book looks at recent developments in private equity, PE deal activity, private credit, real assets, secondaries, middle markets, and venture capital.
See important disclaimers at the bottom of the page.
-
The concentration in the S&P500 continues to increase, and the ten largest stocks now make up 35% of the index, the highest level since the last tech bubble in 2000, see chart below.
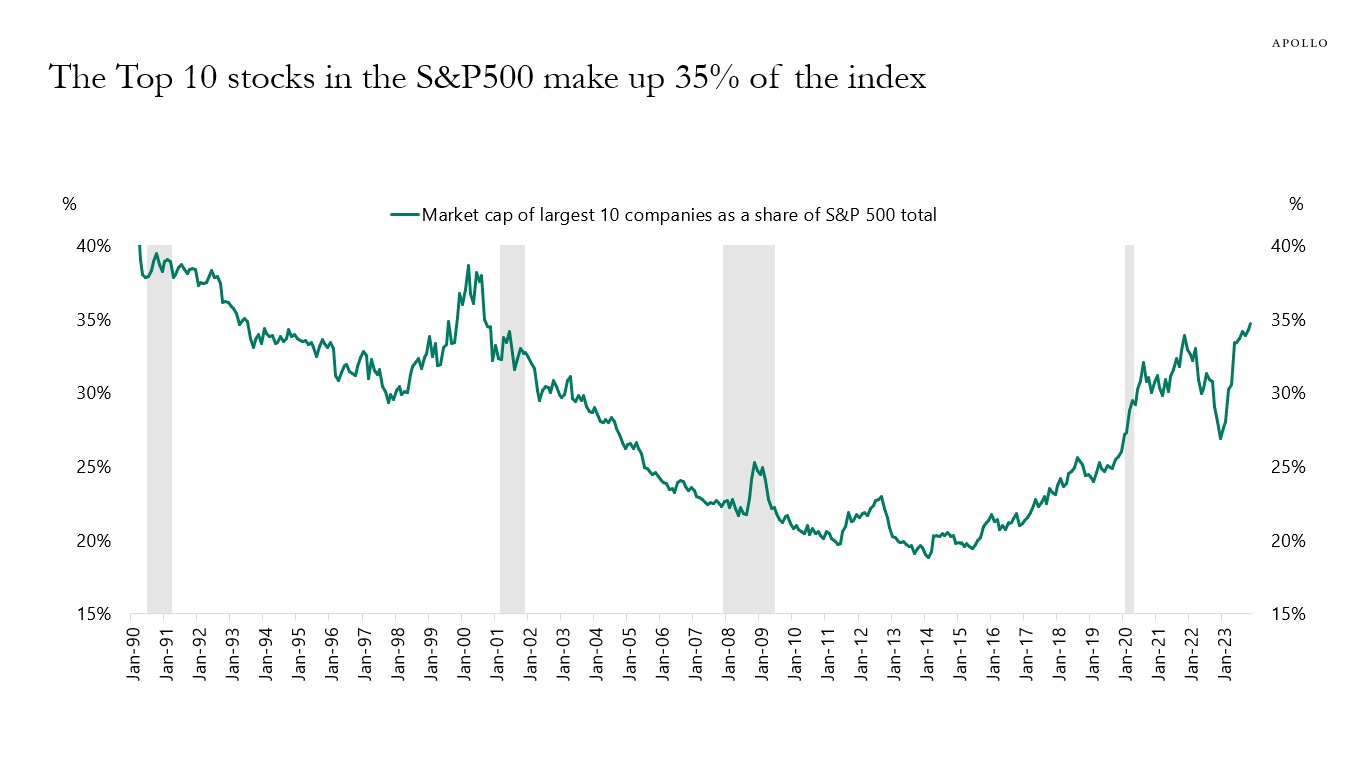
Source: Bloomberg, Apollo Chief Economist See important disclaimers at the bottom of the page.
-
With long rates falling in recent weeks, Treasury supply has seemingly become less important as a driver of long rates.
But the fiscal challenges have not disappeared.
Next week, we have a 10-year auction on Monday and a 30-year auction on Tuesday. And looking into 2024, Treasury auction sizes will be, on average, 23% higher than in 2023.
Because of the constant rise in government debt levels, investors need to monitor not only Treasury auctions but also rating agencies and the term premium.
In this short presentation is a collection of relevant data for thinking about the US fiscal situation and the likely transmission channels to financial markets.
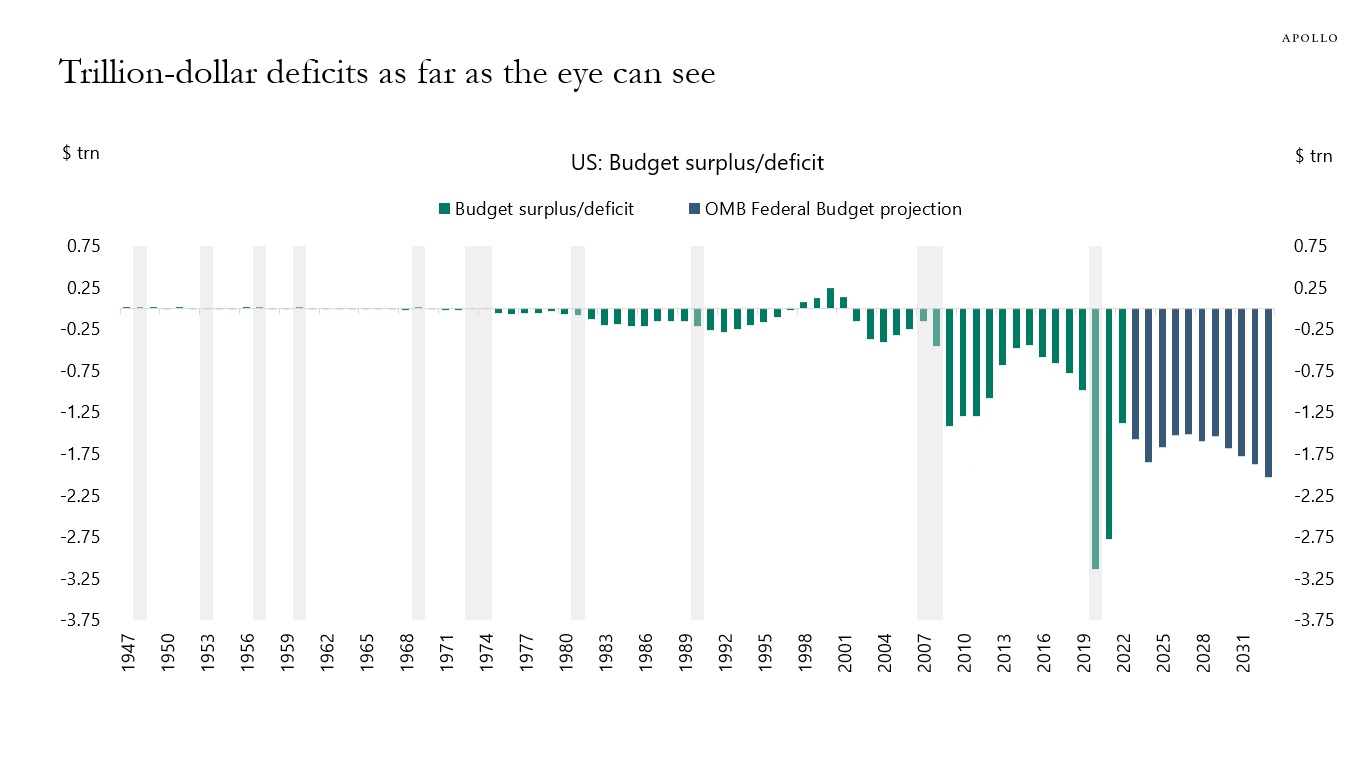
Source: OMB, Haver Analytics, Apollo Chief Economist 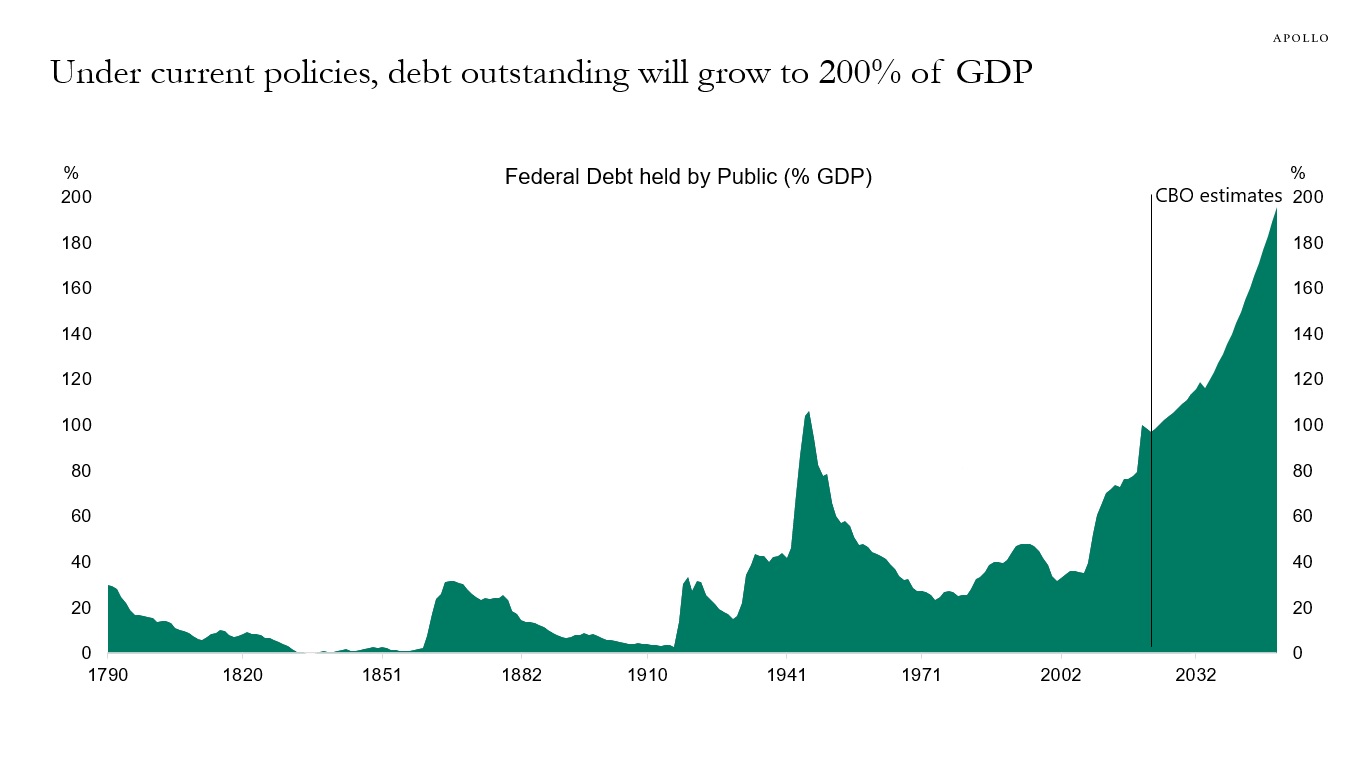
Source: CBO, Haver Analytics, Apollo Chief Economist 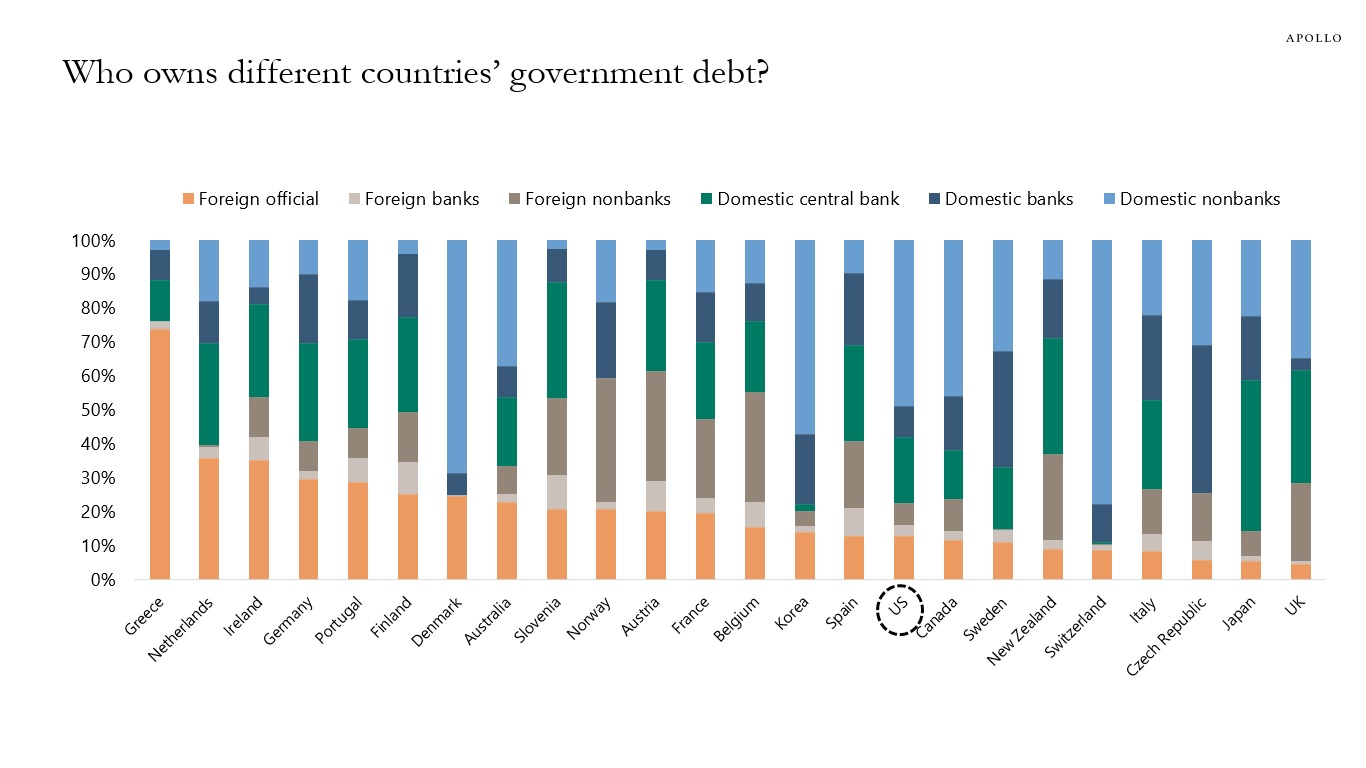
Source: The IMF, Apollo Chief Economist. Note: Data as of year-end 2022. See important disclaimers at the bottom of the page.

This presentation may not be distributed, transmitted or otherwise communicated to others in whole or in part without the express consent of Apollo Global Management, Inc. (together with its subsidiaries, “Apollo”).
Apollo makes no representation or warranty, expressed or implied, with respect to the accuracy, reasonableness, or completeness of any of the statements made during this presentation, including, but not limited to, statements obtained from third parties. Opinions, estimates and projections constitute the current judgment of the speaker as of the date indicated. They do not necessarily reflect the views and opinions of Apollo and are subject to change at any time without notice. Apollo does not have any responsibility to update this presentation to account for such changes. There can be no assurance that any trends discussed during this presentation will continue.
Statements made throughout this presentation are not intended to provide, and should not be relied upon for, accounting, legal or tax advice and do not constitute an investment recommendation or investment advice. Investors should make an independent investigation of the information discussed during this presentation, including consulting their tax, legal, accounting or other advisors about such information. Apollo does not act for you and is not responsible for providing you with the protections afforded to its clients. This presentation does not constitute an offer to sell, or the solicitation of an offer to buy, any security, product or service, including interest in any investment product or fund or account managed or advised by Apollo.
Certain statements made throughout this presentation may be “forward-looking” in nature. Due to various risks and uncertainties, actual events or results may differ materially from those reflected or contemplated in such forward-looking information. As such, undue reliance should not be placed on such statements. Forward-looking statements may be identified by the use of terminology including, but not limited to, “may”, “will”, “should”, “expect”, “anticipate”, “target”, “project”, “estimate”, “intend”, “continue” or “believe” or the negatives thereof or other variations thereon or comparable terminology.