


Want it delivered daily to your inbox?
-
The sources of yen depreciation are the Fed keeping rates higher for longer, the BoJ keeping rates lower for longer, and worries about what higher Japanese interest rates mean for fiscal sustainability.
For more, see also our chart book available here.
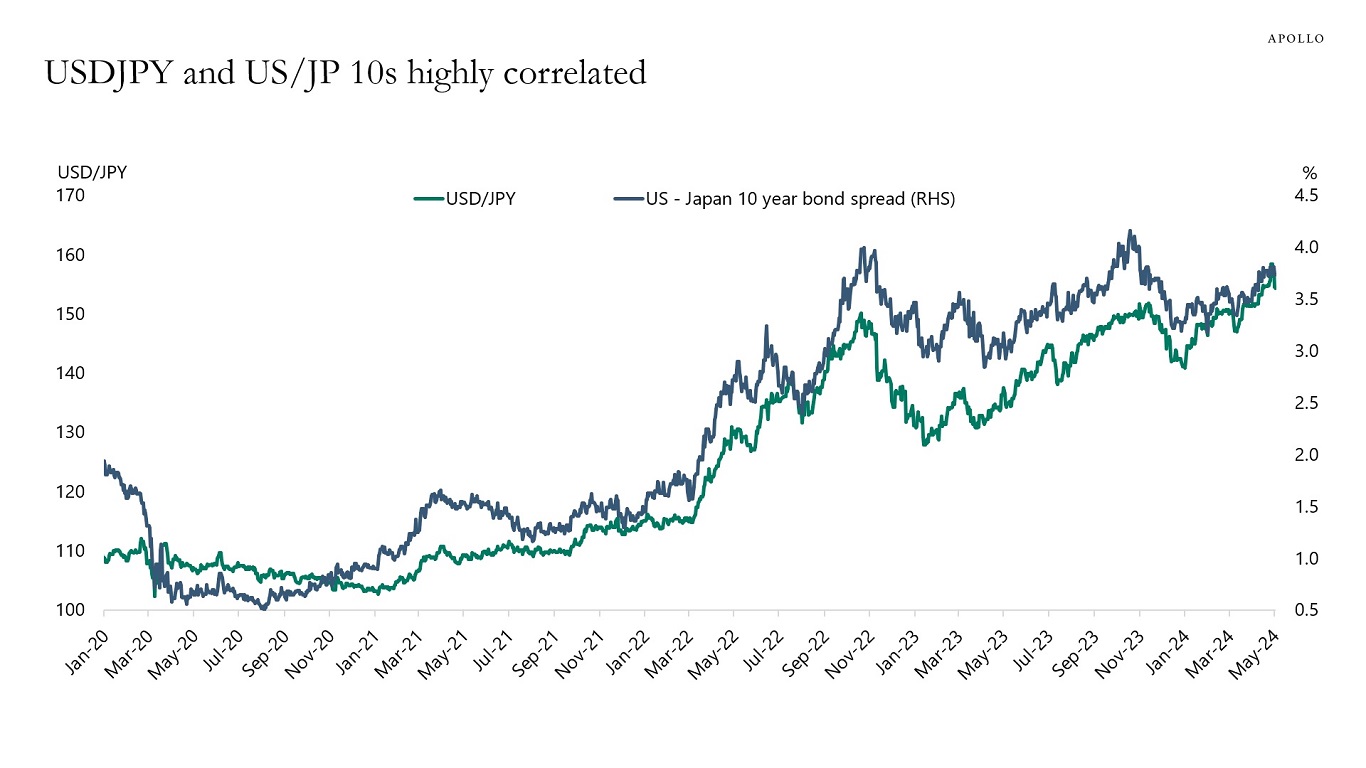
Source: Bloomberg, Apollo Chief Economist 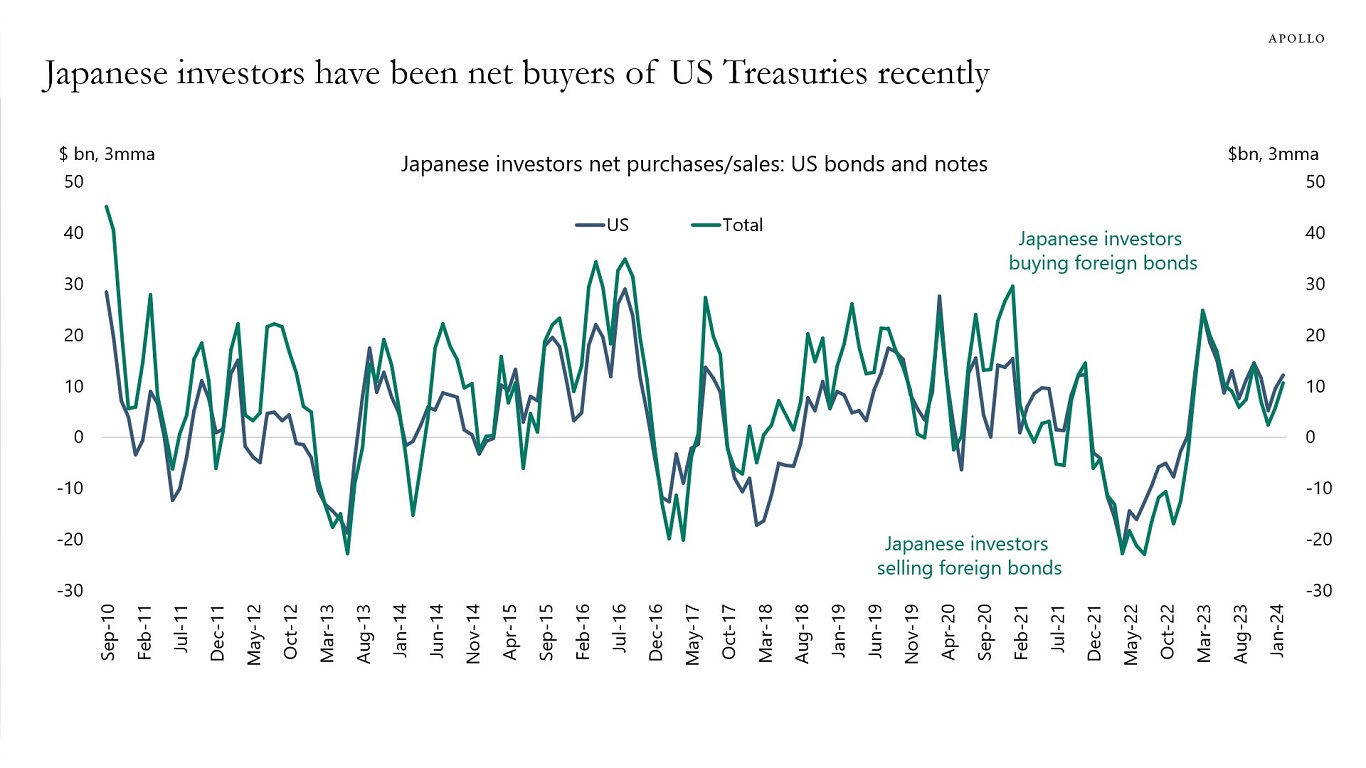
Source: Ministry of Finance Japan, Bloomberg, Apollo Chief Economist 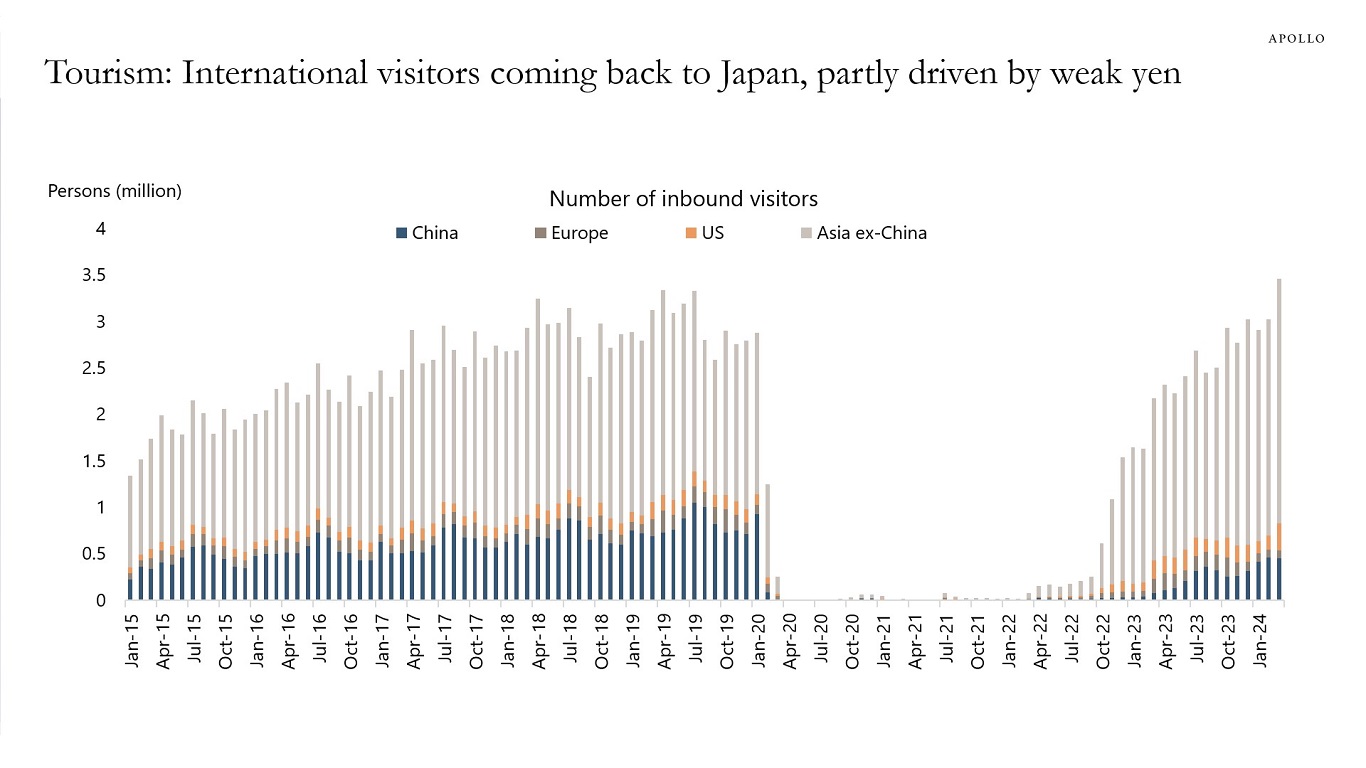
Source: Japan National Tourism Organization, Bloomberg, Apollo Chief Economist See important disclaimers at the bottom of the page.
-
Why is the economy still so strong?
There are two reasons, lower interest-rate sensitivity and strong demand tailwinds.
Specifically:
A) Lower interest-rate sensitivity:
1) 40% of homeowners don’t have a mortgage, and 95% of mortgages are 30-year fixed that are not sensitive to the Fed raising interest rates.
2) During Covid, most firms termed out their debt at very low levels, and with the IG market having grown from $3 trillion in 2009 to $9 trillion today, see the second chart, the interest-rate sensitivity of corporate America has declined.
3) A growing share of capex spending is intangibles (R&D and software), which generally is less sensitive to Fed hikes.
B) Strong cyclical and structural demand tailwinds:
1) Fiscal spending, including the CHIPS Act, Inflation Reduction Act, and Infrastructure Act, is still a strong tailwind to growth.
2) Excess savings have recently started to rise again for higher income households, see the third chart.
3) Immigration has been unusually strong, supporting overall employment growth.
4) The Fed turning dovish in December 2023 has eased financial conditions significantly, which continues to boost consumer spending and capex spending.
5) Higher interest rates give higher cash flow to households that own fixed-income assets.
6) After 14 years of very low interest rates from 2008 to 2022, the demand for higher all-in yields remains extremely strong from insurance companies, pension funds, and retail investors, which has contributed to easy financial conditions that have been offsetting Fed hikes. The AI story has also boosted household wealth and eased financial conditions.
7) Corporates that got into trouble once the Fed started hiking have not been liquidating their assets but instead doing reorganizations and distressed exchanges, and this has kept many firms alive that would otherwise have gone out of business, see the fourth and fifth charts.
In summary, the economy is strong for two reasons:
A) Consumers and firms locked in low interest rates during Covid, which made the economy less sensitive to higher interest rates (i.e., bullet points No. 1 to 3 above), and
B) Strong demand tailwinds coming from fiscal, excess savings, immigration, and easy financial conditions (i.e., bullet points No. 1 to 7 above).
With this backdrop, it is not surprising that inflation and labor costs remain high, and these 10 forces will keep the economy strong for at least several more quarters.
Eventually, the Fed will get inflation back to 2%, but it is increasingly clear that it will require a meaningful slowdown in the labor market and the housing market.
In short, GDP and earnings should remain strong for the rest of 2024.
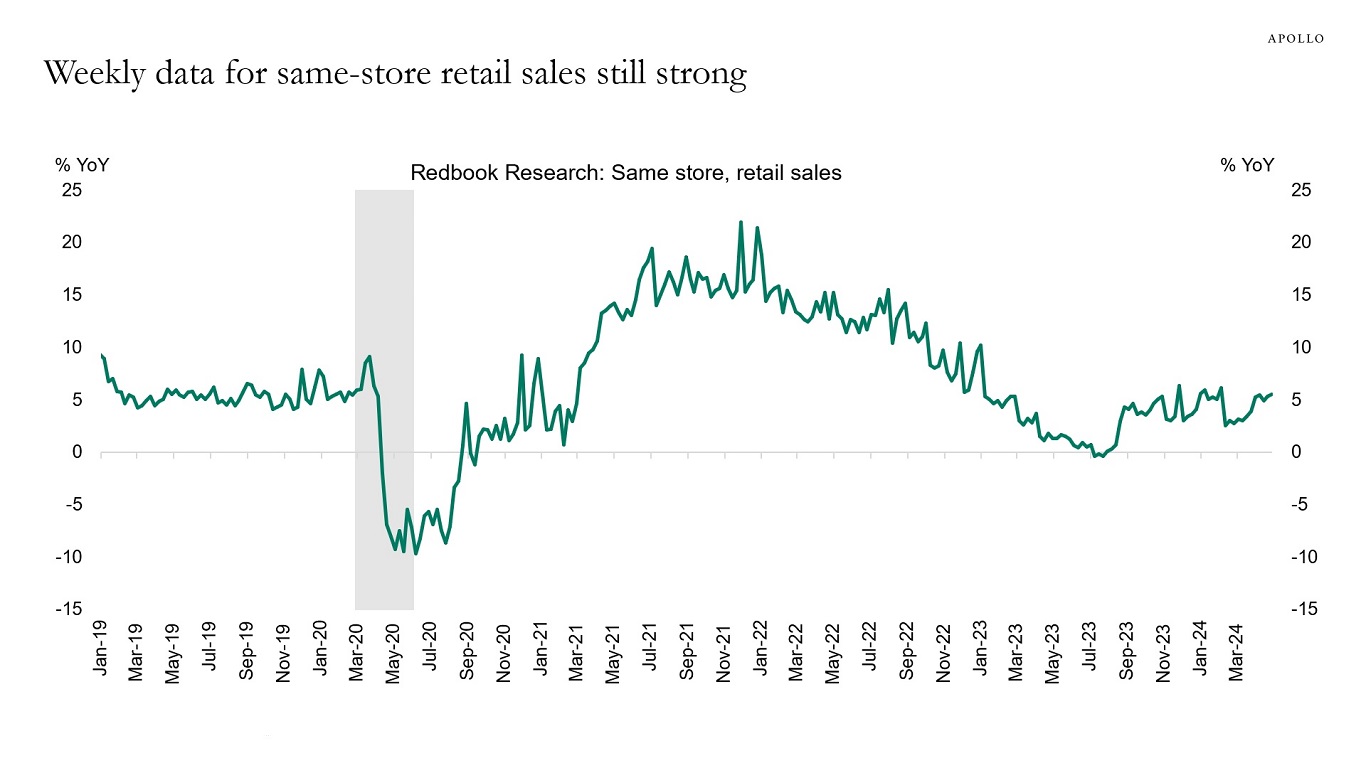
Source: Redbook, Bloomberg, Apollo Chief Economist 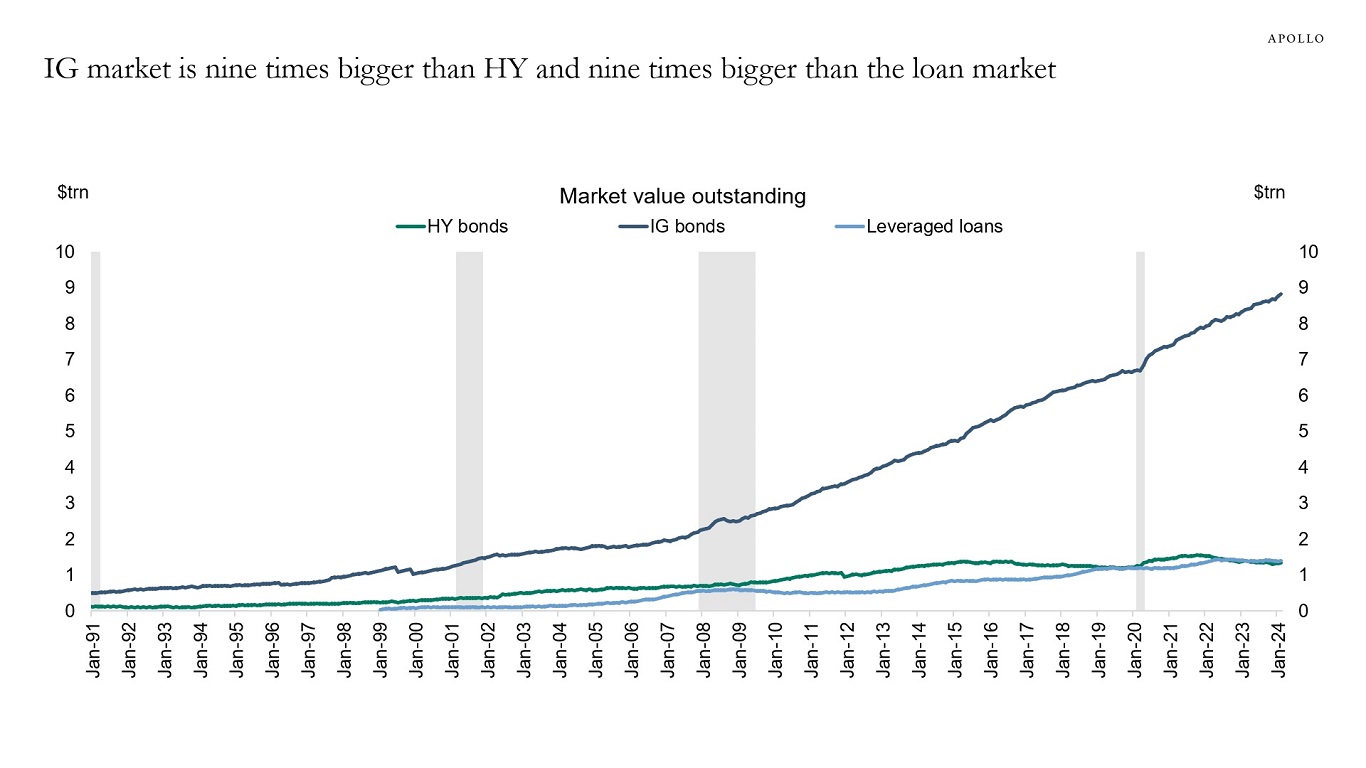
Source: ICE BofA, Bloomberg, Pitchbook LCD, Apollo Chief Economist. Note: Ticker used for HY is H0A0 Index and for IG it is C0A0 Index, and for Loans it is SPBDALB Index. 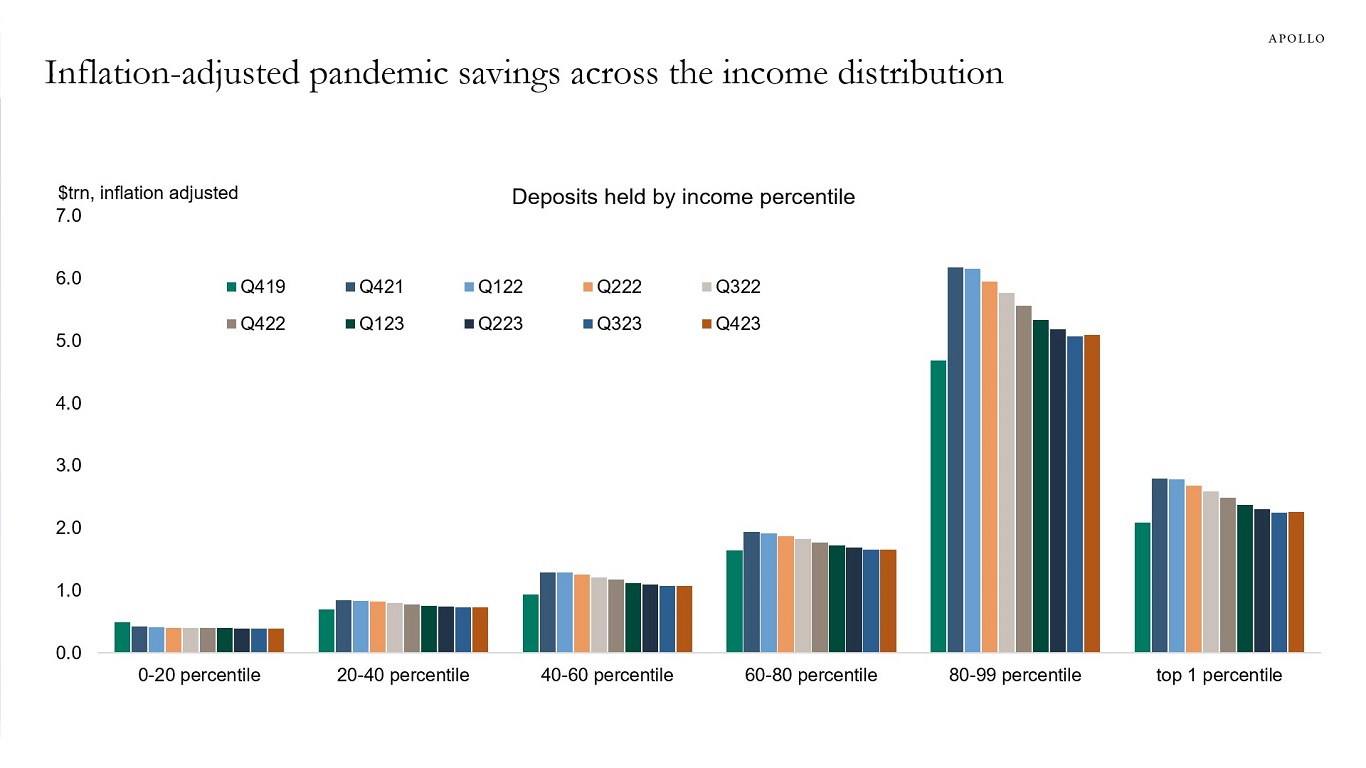
Source: FRB, Haver Analytics, Apollo Chief Economist 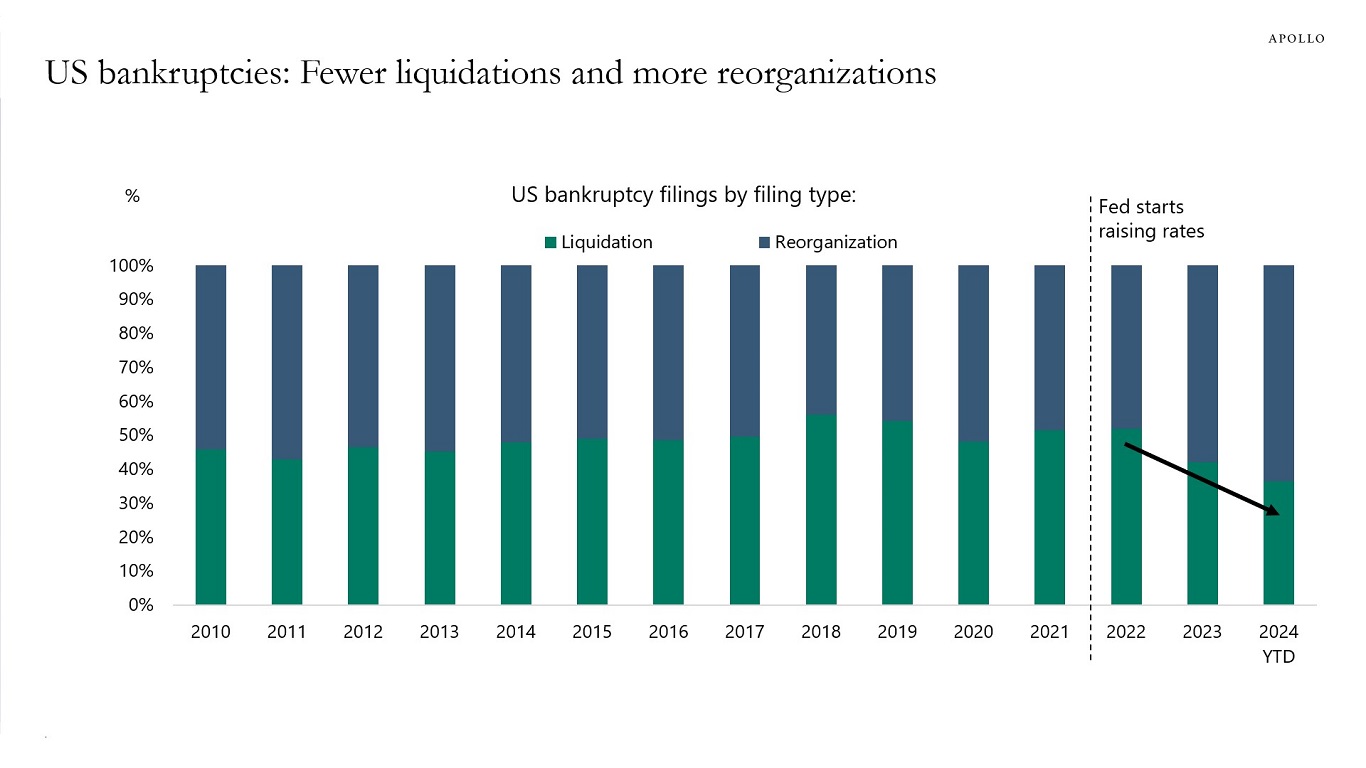
Source: S&P Capital IQ, Apollo Chief Economist. Note: Data till March 14, 2024. Bankruptcy figures include public companies or private companies with public debt with a minimum of $2 million in assets or liabilities at the time of filing, in addition to private companies with at least $10 million in assets or liabilities. Chapter 11 liquidation and Chapter 7 bankruptcy filings are categorized as liquidation, and other Chapter 11 bankruptcy filings as reorganization. 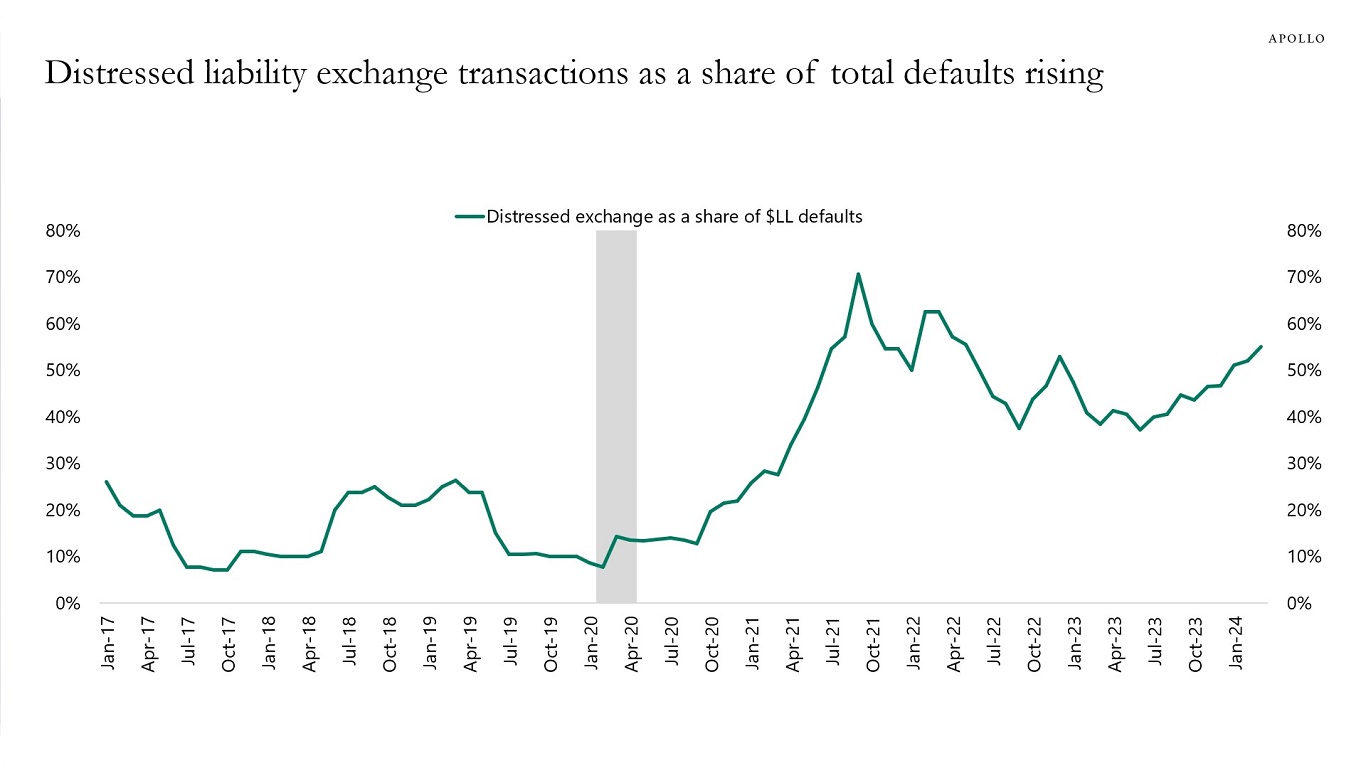
Source: S&P, LCD Pitchbook, Apollo Chief Economist See important disclaimers at the bottom of the page.
-
CEO confidence continues to rebound, and there are no signs of Fed hikes weighing on how CEOs view current conditions, future business conditions, and expectations to the economy, see chart below.
In short, CEOs are becoming increasingly bullish on the outlook for their businesses and the economy. This suggests that r-star may be higher than the Fed currently thinks.
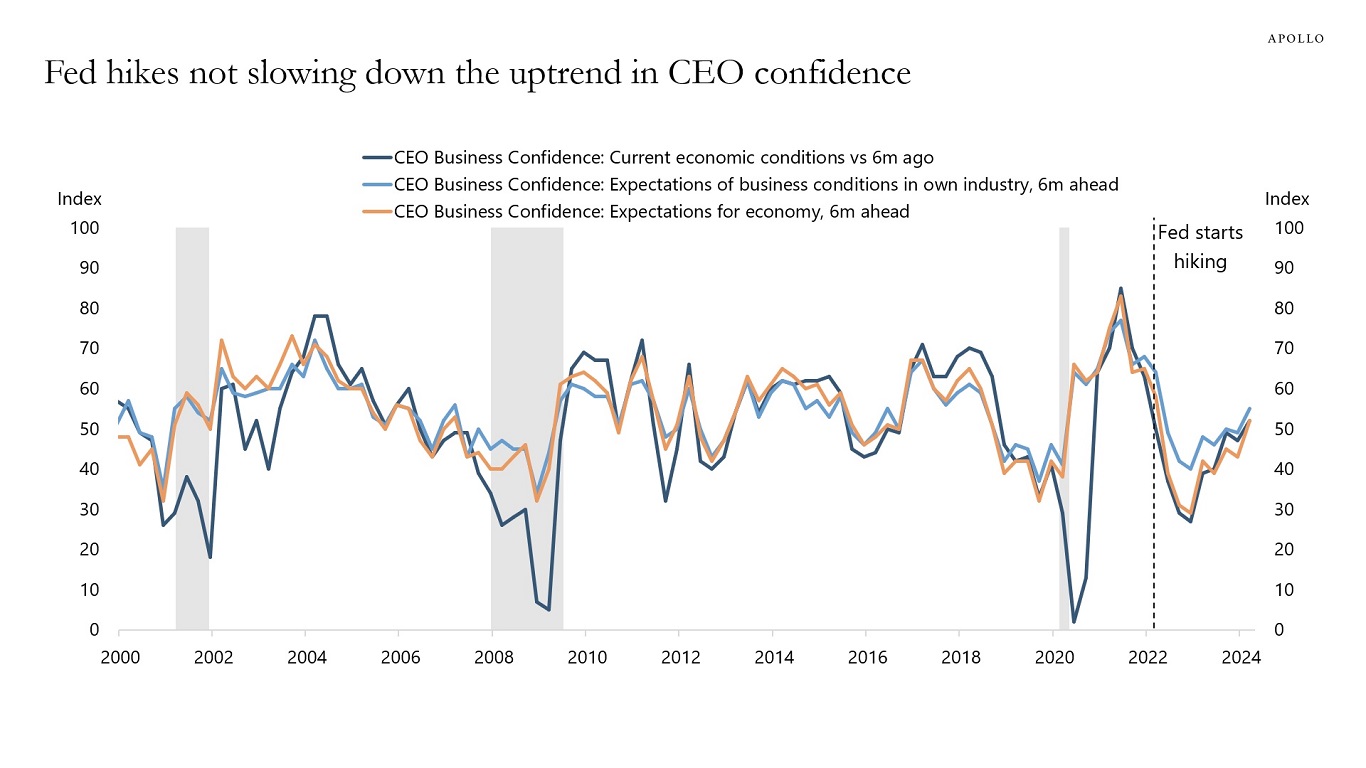
Source: Conference Board, Haver Analytics, Apollo Chief Economist See important disclaimers at the bottom of the page.
-
The top 5% of healthcare spenders account for 51% of total healthcare spending, see chart below. The bottom 50% account for 3% and their average annual healthcare costs are $385. People with health spending in the top 1% have annual average costs of $166,980.
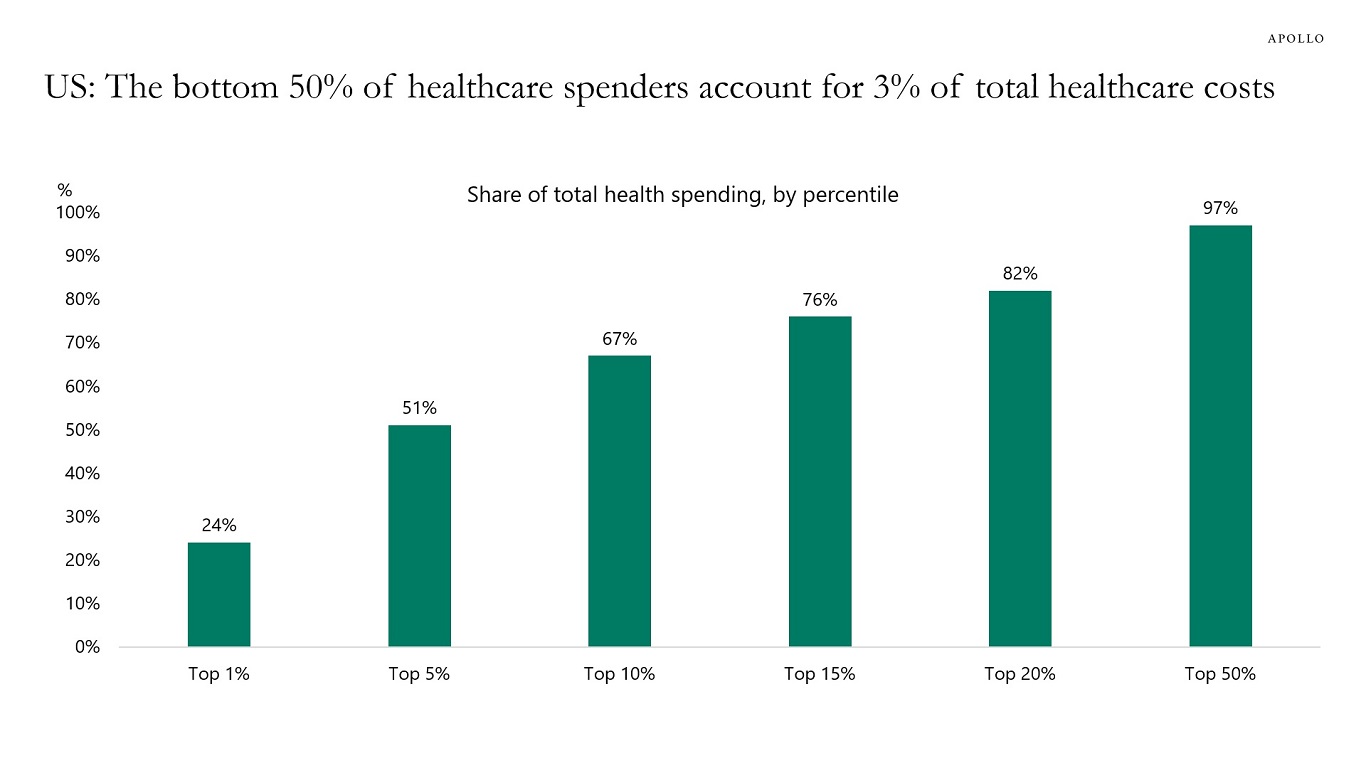
Source: Peterson-KFF Health System Tracker, KFF analysis of 2021 Medical Expenditure Panel Survey data, Apollo Chief Economist. Note: Data for 2021. See important disclaimers at the bottom of the page.
-
The US growth outlook is decoupling from the European growth outlook driven by more expansive US fiscal policy and easier financial conditions triggered by the November 1 Fed pivot, where the central bank started talking about cuts instead of hikes, see chart below. As a result, the Treasury-Bund spread will likely continue to widen, and the dollar will likely continue to increase, both against the euro and the yen.

Source: Bloomberg, Apollo Chief Economist See important disclaimers at the bottom of the page.
-
Our chart book that looks at why gold prices are going up is available here.
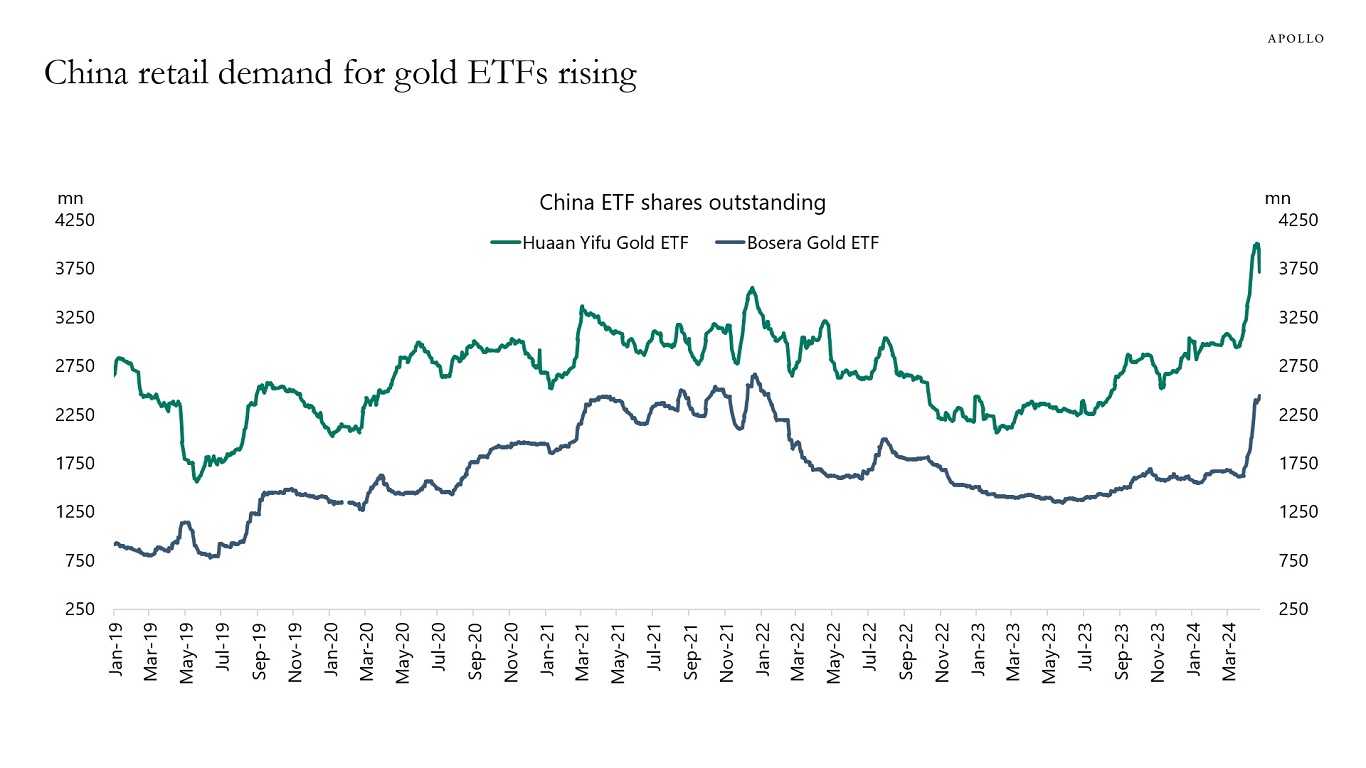
Source: Bloomberg, Apollo Chief Economist 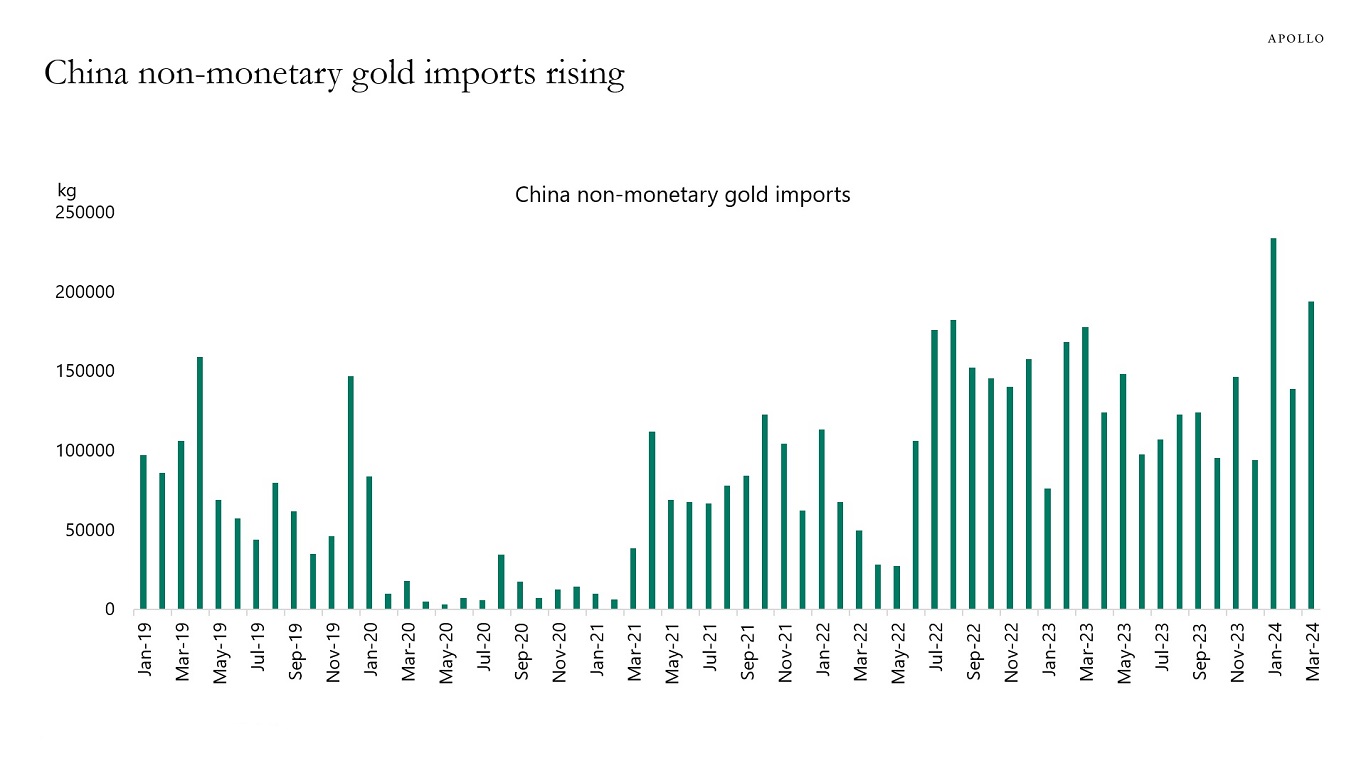
Source: China customs, Bloomberg, Apollo Chief Economist 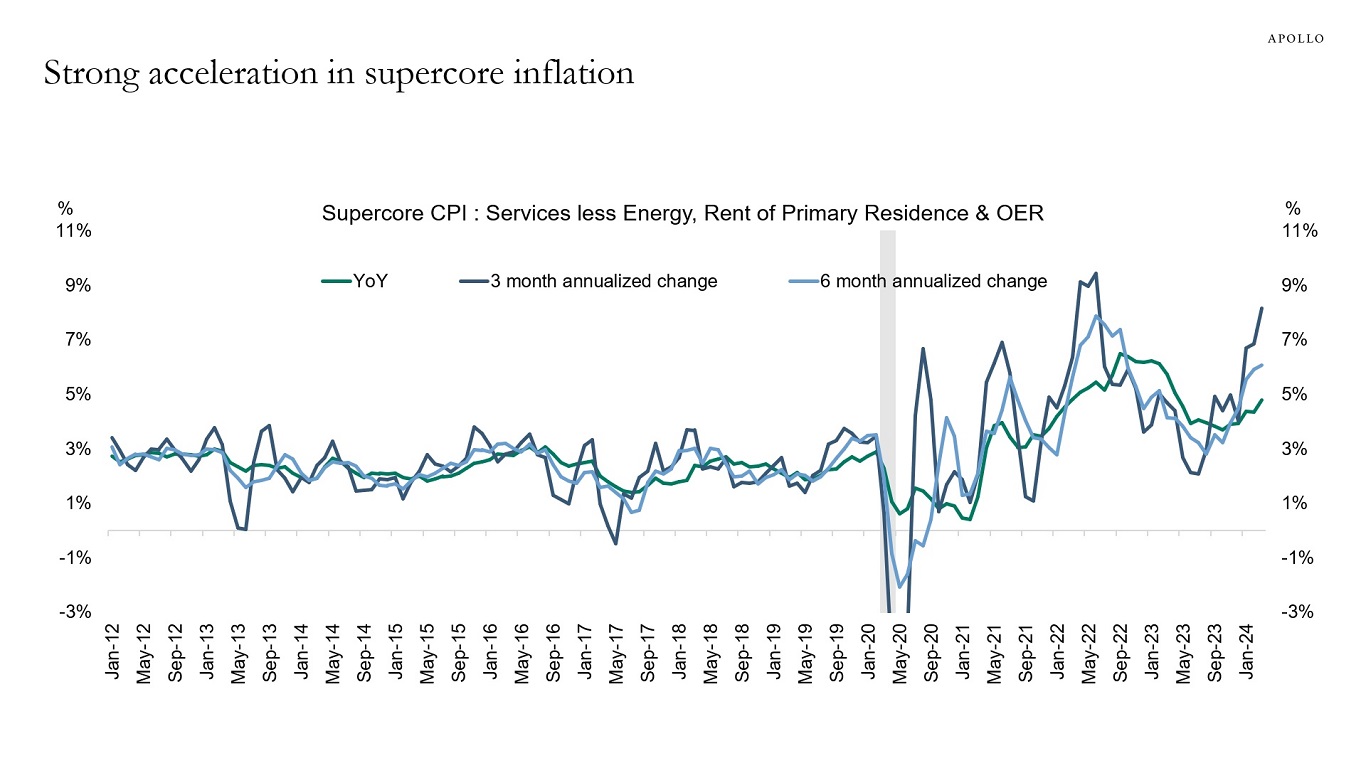
Source: BLS, Haver Analytics, Apollo Chief Economist. OER stands for owners’ equivalent rent of residences. 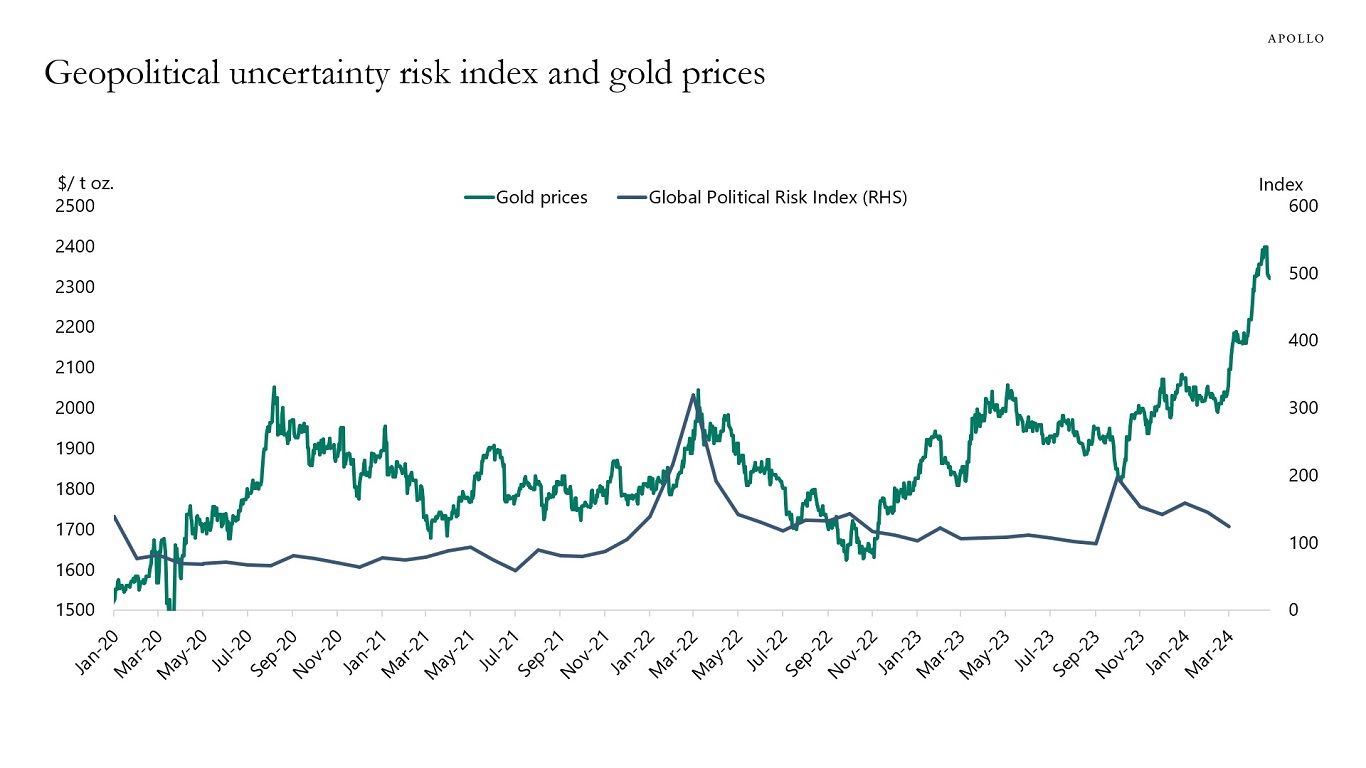
Source: Bloomberg, policyuncertainty.com, Apollo Chief Economist See important disclaimers at the bottom of the page.
-
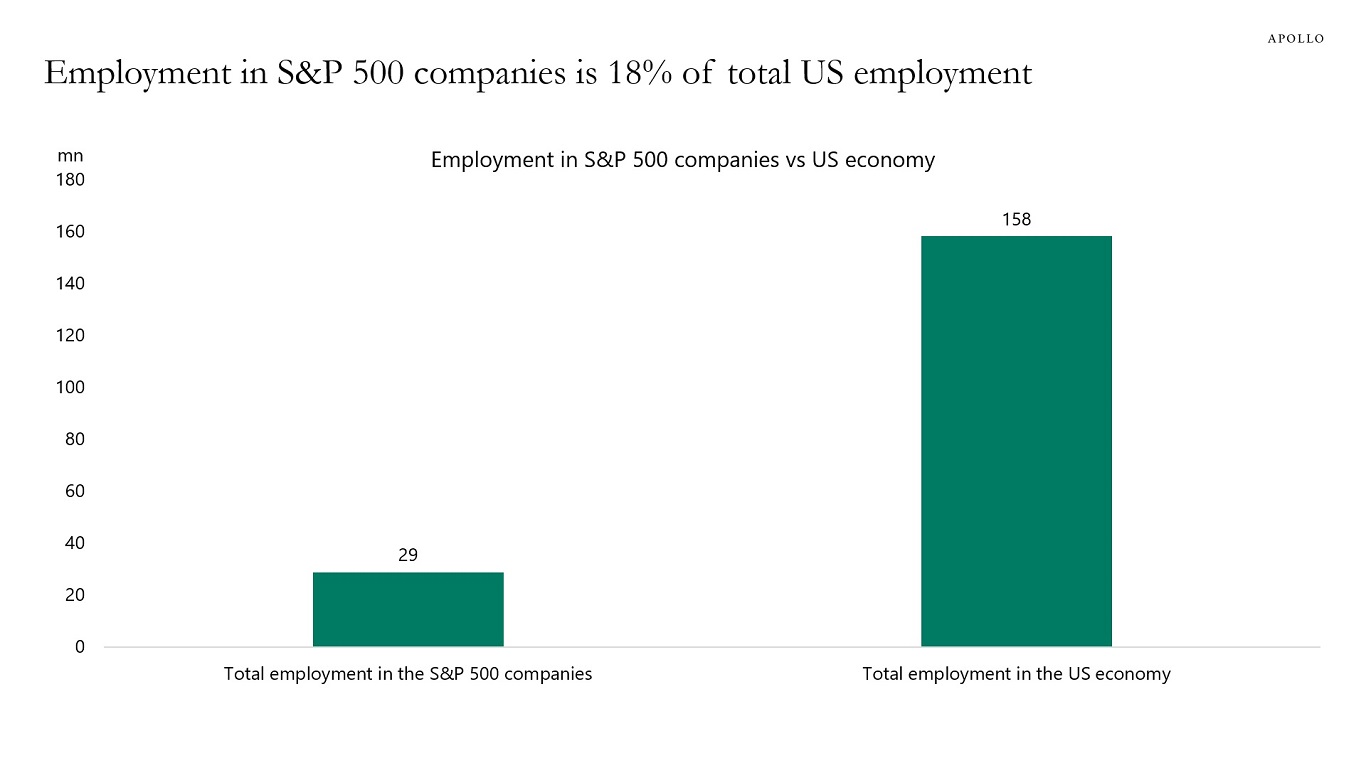
Most of the time in financial markets goes with talking about the S&P 500.
But public markets and public companies are only a small part of the economy.
Total global employment in the S&P 500 companies is 29 million, and total employment in the US economy is 158 million, see chart below.
Put differently, more than 80% of total employment in the US economy is outside the S&P 500 companies.
This is consistent with our recent Daily Spark, in which we showed that 87% of firms in the US with revenue greater than $100 million are private.
The bottom line is that the vast majority of the US economy is in private markets.
Source: BLS, Bloomberg, Apollo Chief Economist See important disclaimers at the bottom of the page.
-
Rising energy prices combined with the ongoing rebound in the manufacturing sector increase the likelihood that we could see an increase in goods inflation over the coming months, see chart below.
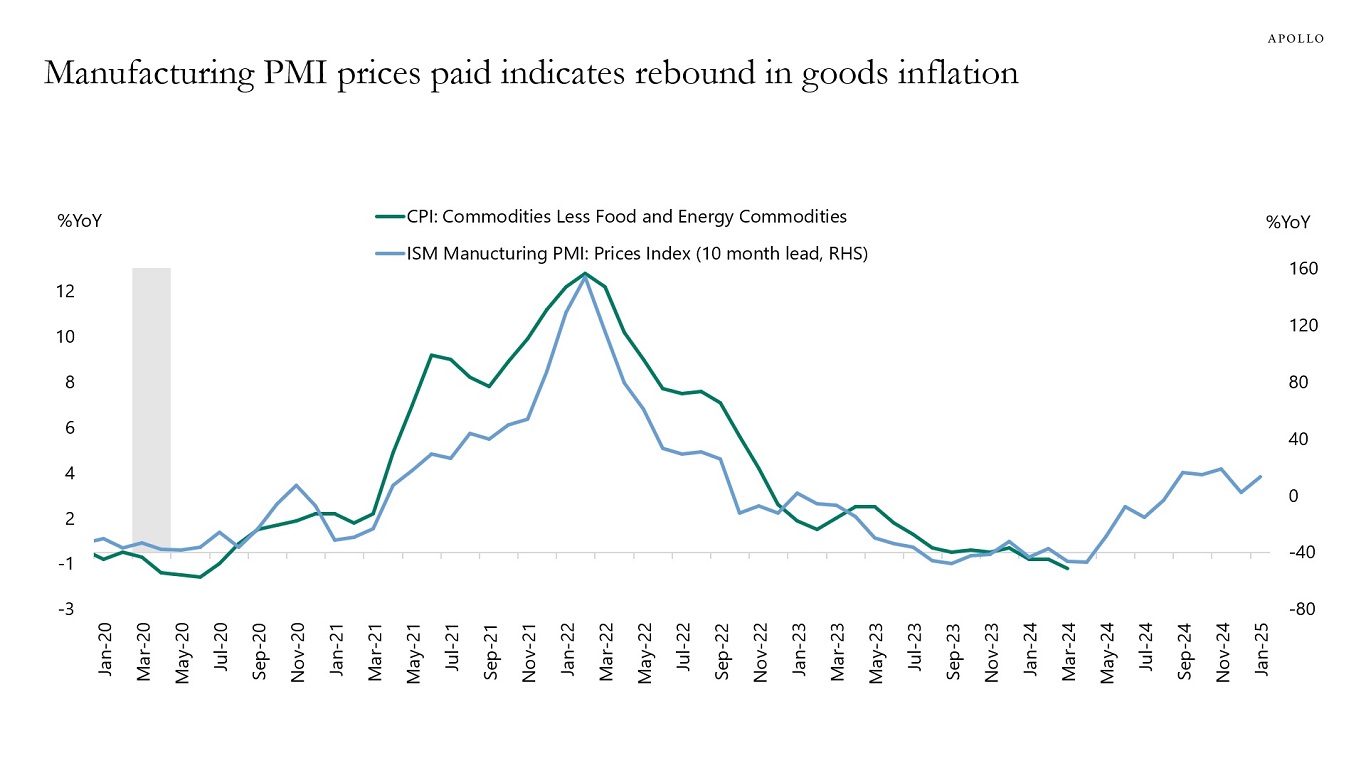
Source: BLS, ISM, Haver Analytics, Apollo Chief Economist See important disclaimers at the bottom of the page.
-
In financial markets, a lot of conversations are about public companies, but the reality is that in Europe, 96% of firms with revenue greater than $100 million are private, see chart below.
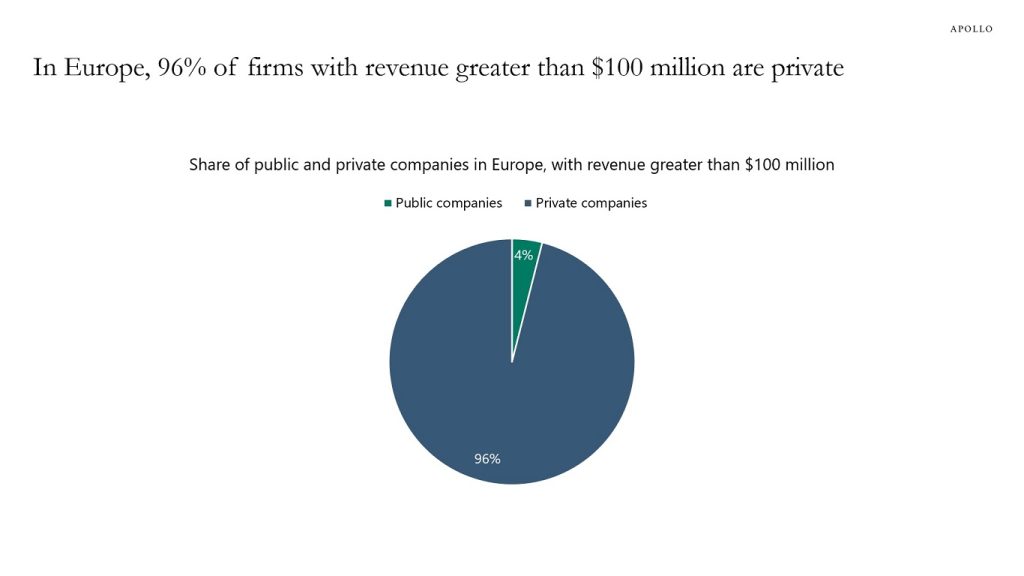
Source: S&P Capital IQ, Apollo Chief Economist. Note: For companies with last 12-month revenue greater then $100 million by count. See important disclaimers at the bottom of the page.
-
Forty-eight percent of Americans have a passport, up from 3% in 1989, see chart below.
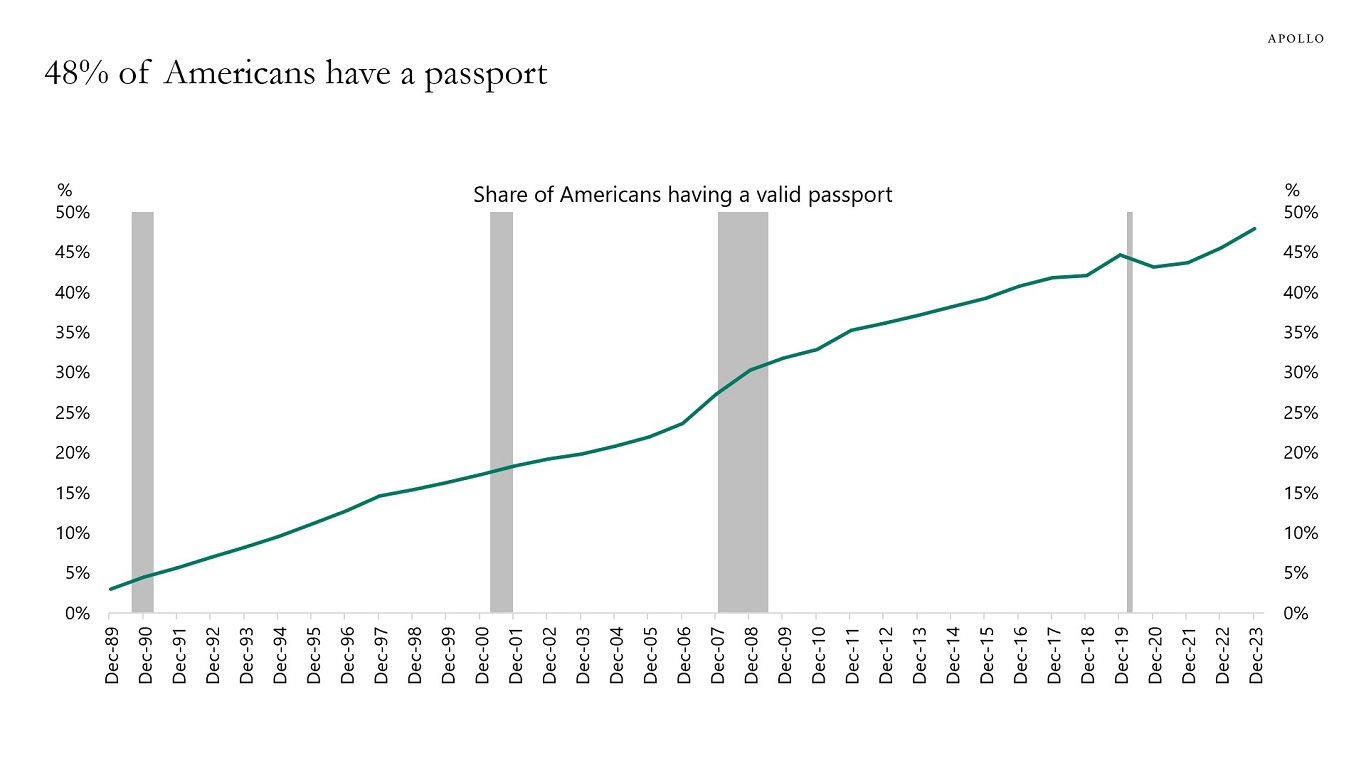
Source: US Department of State, Census Bureau, Haver Analytics, Apollo Chief Economist See important disclaimers at the bottom of the page.

This presentation may not be distributed, transmitted or otherwise communicated to others in whole or in part without the express consent of Apollo Global Management, Inc. (together with its subsidiaries, “Apollo”).
Apollo makes no representation or warranty, expressed or implied, with respect to the accuracy, reasonableness, or completeness of any of the statements made during this presentation, including, but not limited to, statements obtained from third parties. Opinions, estimates and projections constitute the current judgment of the speaker as of the date indicated. They do not necessarily reflect the views and opinions of Apollo and are subject to change at any time without notice. Apollo does not have any responsibility to update this presentation to account for such changes. There can be no assurance that any trends discussed during this presentation will continue.
Statements made throughout this presentation are not intended to provide, and should not be relied upon for, accounting, legal or tax advice and do not constitute an investment recommendation or investment advice. Investors should make an independent investigation of the information discussed during this presentation, including consulting their tax, legal, accounting or other advisors about such information. Apollo does not act for you and is not responsible for providing you with the protections afforded to its clients. This presentation does not constitute an offer to sell, or the solicitation of an offer to buy, any security, product or service, including interest in any investment product or fund or account managed or advised by Apollo.
Certain statements made throughout this presentation may be “forward-looking” in nature. Due to various risks and uncertainties, actual events or results may differ materially from those reflected or contemplated in such forward-looking information. As such, undue reliance should not be placed on such statements. Forward-looking statements may be identified by the use of terminology including, but not limited to, “may”, “will”, “should”, “expect”, “anticipate”, “target”, “project”, “estimate”, “intend”, “continue” or “believe” or the negatives thereof or other variations thereon or comparable terminology.