


Want it delivered daily to your inbox?
-
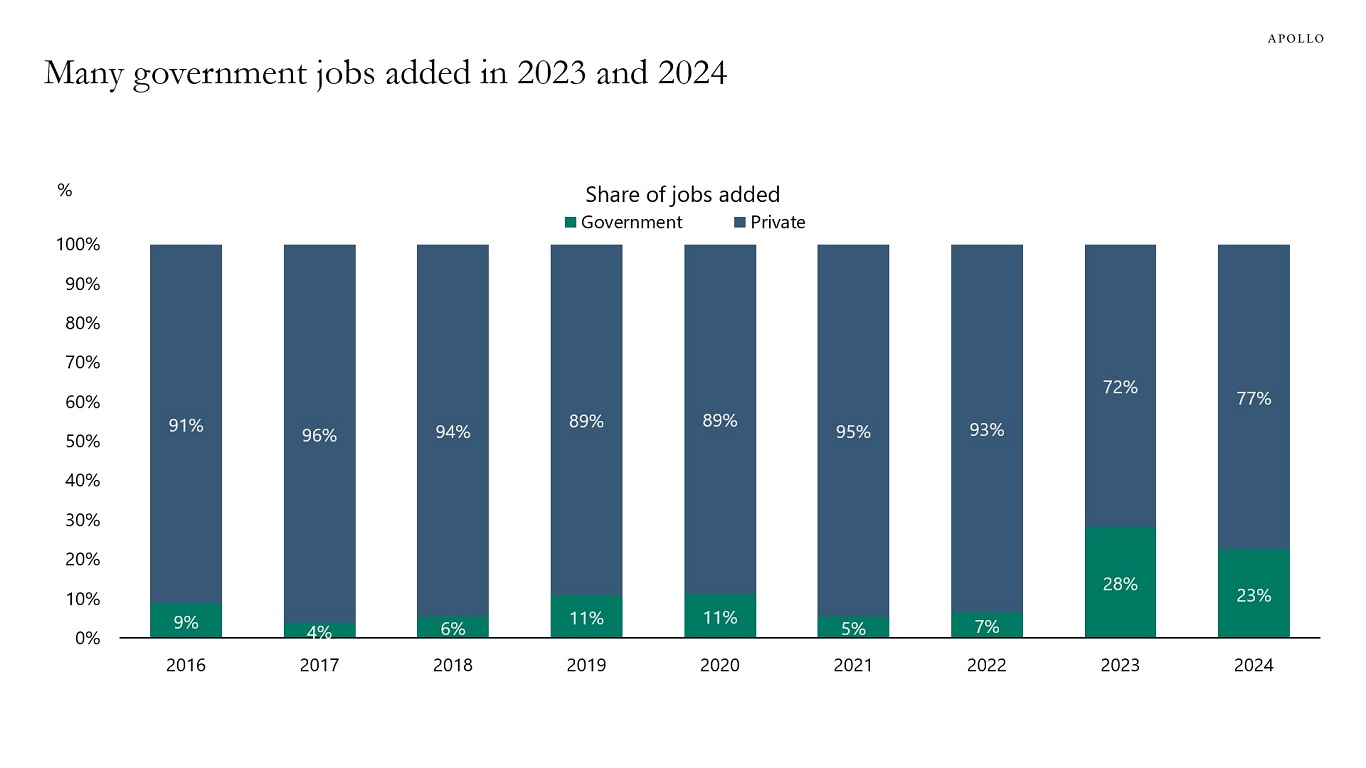
About 25% of jobs added in the US economy over the past two years were government jobs, up from 5% in 2021 and 7% in 2022, see chart below.
We are hosting a conference call today at 10 am EST to discuss the potential implications of the latest US administration policy proposals, you can register here, and the chart book we will be using is available here.
Source: BLS, Haver Analytics, Apollo Chief Economist See important disclaimers at the bottom of the page.
-
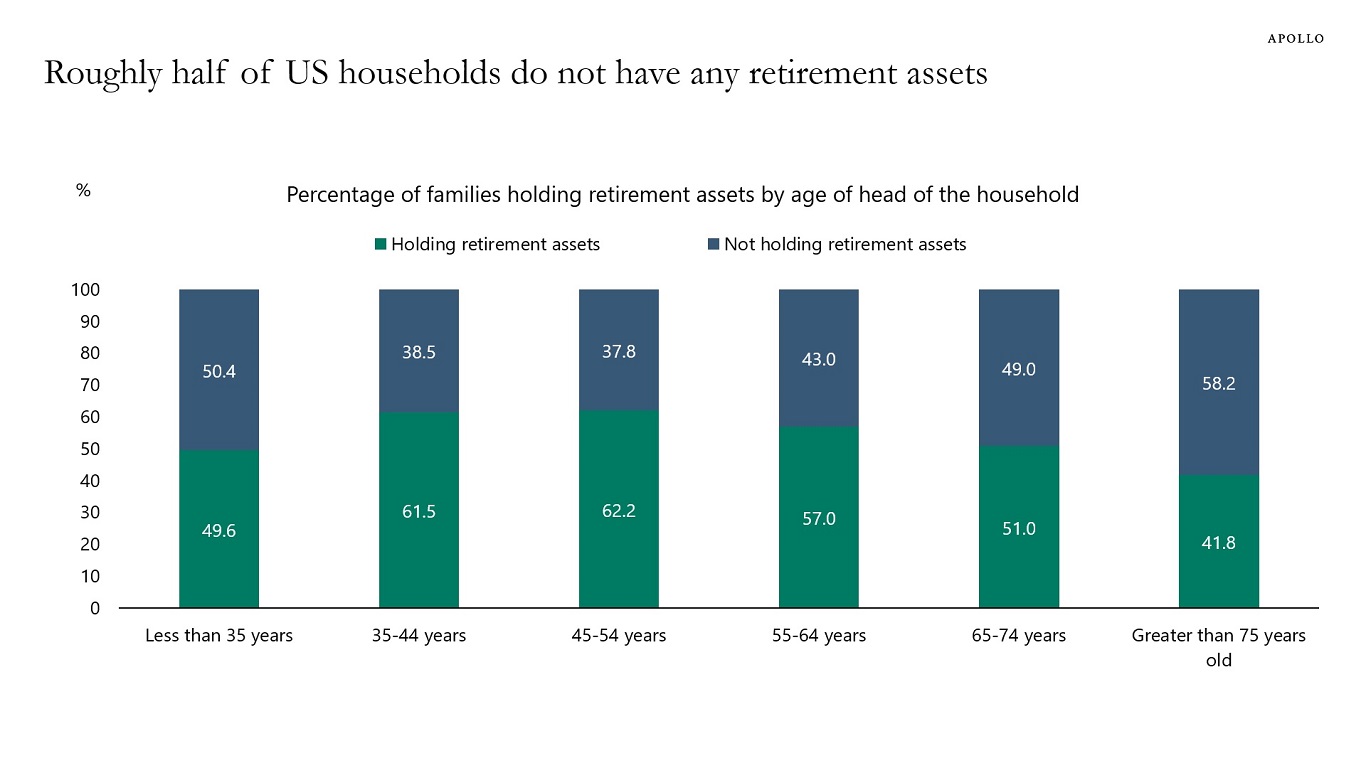
About half of the US population does not own any retirement assets, see chart below.
Source: Survey of Consumer Finances 2022, Haver Analytics, Apollo Chief Economist See important disclaimers at the bottom of the page.
-
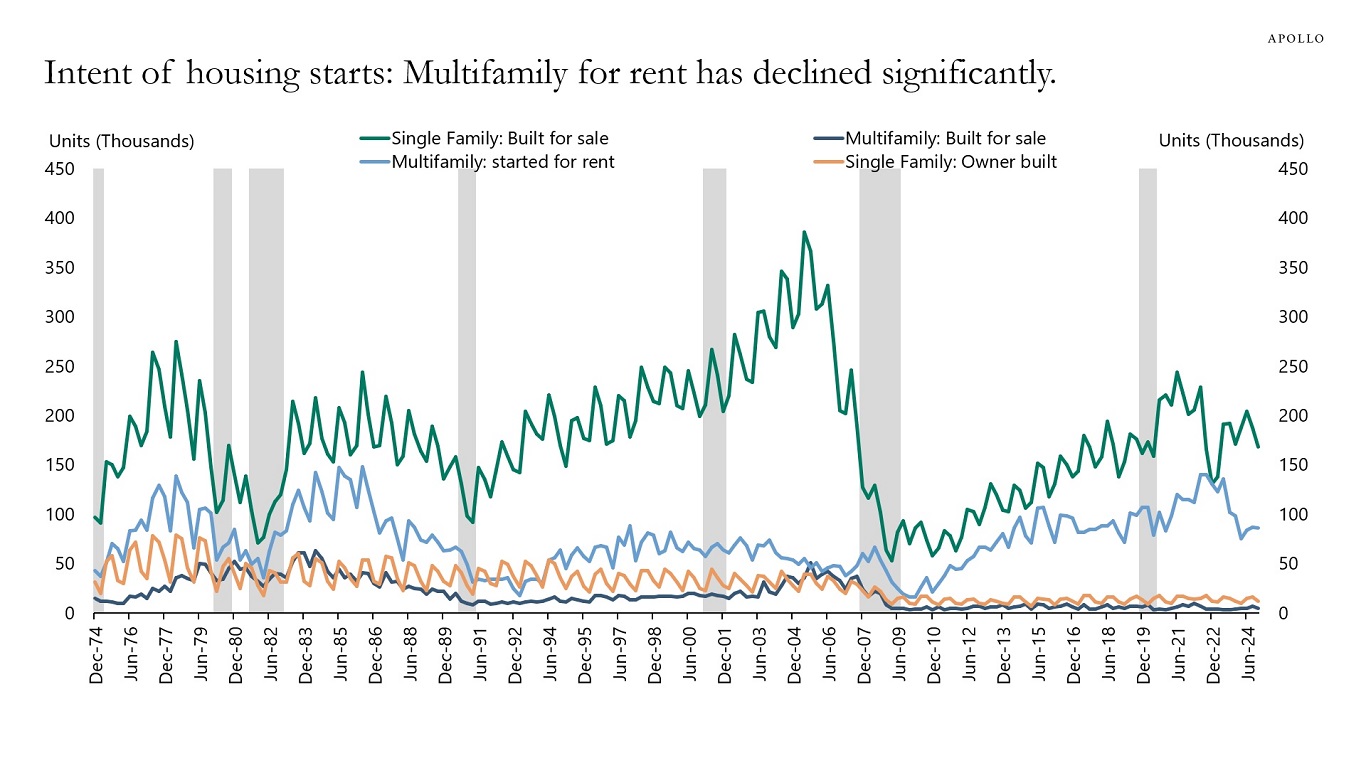
Since the Fed began to raise interest rates in March 2022, housing starts have declined significantly, in particular, multifamily housing starts for rent have declined almost 50%, see the first chart.
Given it currently takes on average 17 months to build a multifamily property, see the second chart, we can produce a forecast for the number of multifamily homes coming to the market this year and next year. The conclusion is that multifamily completions will decline significantly in 2025 and 2026, see the third chart.
Combined with a historically low rental vacancy rate, solid household formation, and an all-time high share of Americans saying that they would rent if they had to move, the bottom line is that rent inflation will start to rise later this year, see the fourth, fifth, and sixth chart below.
Rising rents put upward pressure on OER in the CPI index and will keep inflation higher for longer. With inflation higher for longer, the Fed will also keep interest rates higher for longer.
The bottom line is that inflation remains well above the Fed’s 2% inflation target, and it will require interest rates higher for longer to get inflation back to 2%.
Our latest US housing outlook is available here.
Source: US Census Bureau, Apollo Chief Economist 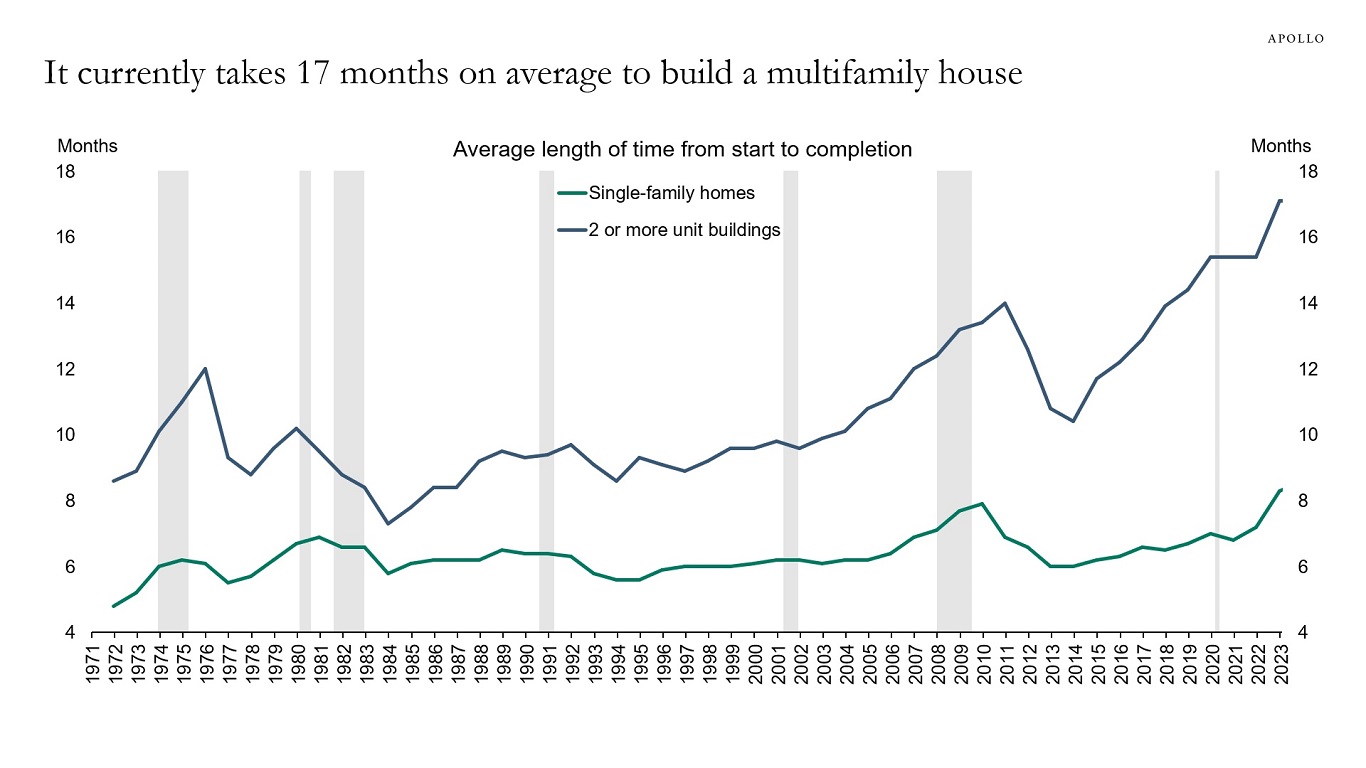
Note: Single-family homes are 1-unit buildings. Source: Census, Haver Analytics, Apollo Chief Economist 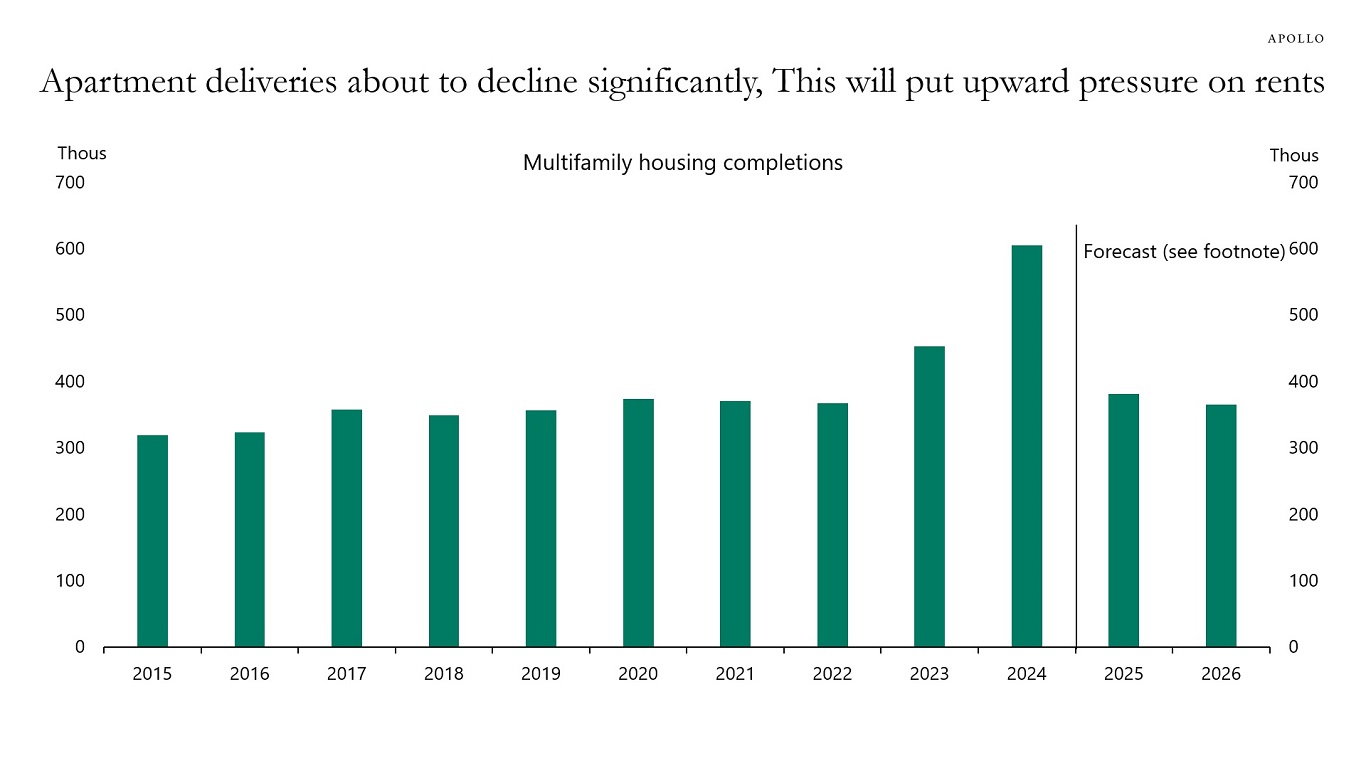
Note: 2025 and 2026 forecasts using data for housing starts and average length of time from start to completion. As housing starts have normalized, completed apartments are also normalizing to pre-pandemic levels. Source: Census Bureau, Haver Analytics, Apollo Chief Economist 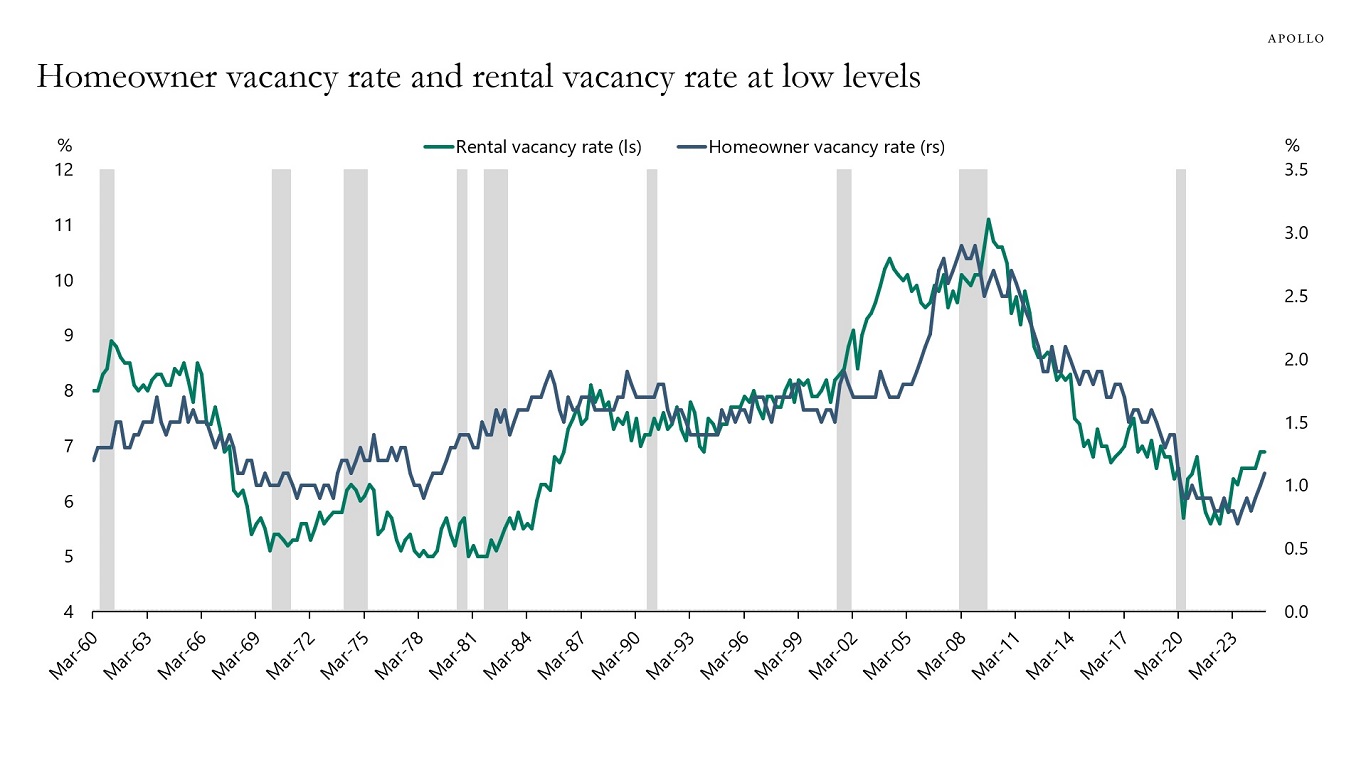
Source: Census Bureau, Haver, Apollo Chief Economist 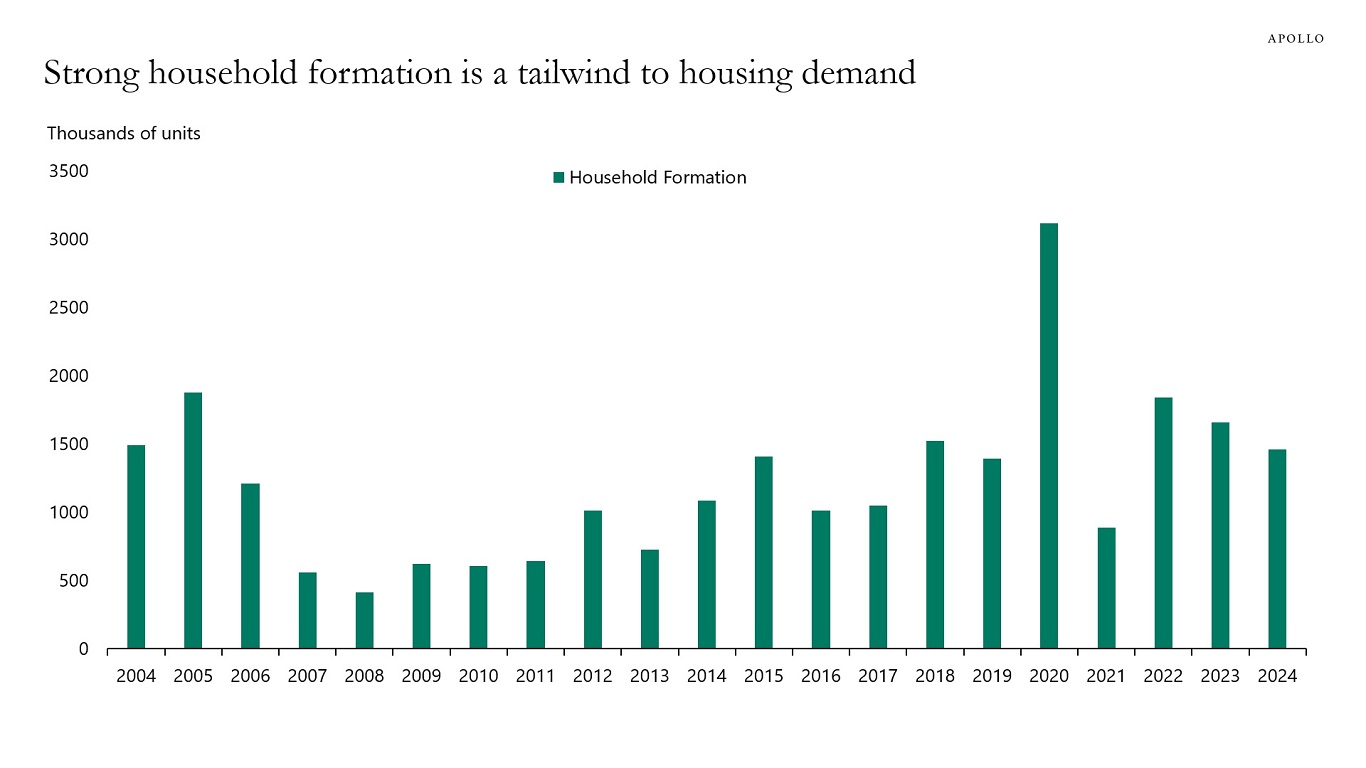
Source: Census Bureau, Haver, Apollo Chief Economist 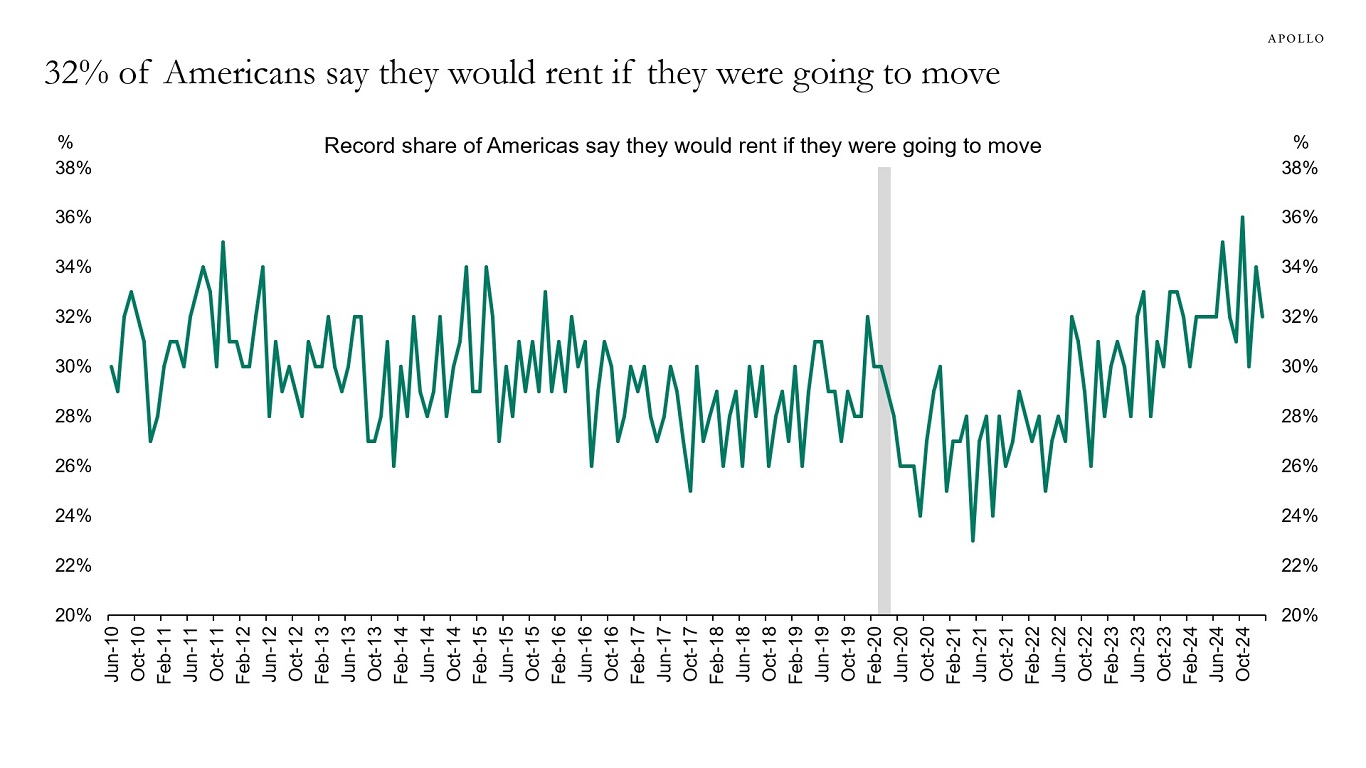
Source: Fannie Mae, Apollo Chief Economist See important disclaimers at the bottom of the page.
-
There are often adjustment costs associated with changing policies. Laying off government workers puts upward pressure on unemployment, and imposing tariffs increases prices and lowers demand for foreign goods. How significant the impact of these policies will be on the economy depends on the magnitude and duration of each policy.
The two first charts below show the impact of tariffs and DOGE on GDP and inflation, using a model similar to the Fed’s model of the US economy, FRBUS. The results show that over the coming quarters, inflation will be 0.2% higher and GDP will be 0.5% lower.
In other words, DOGE and tariffs combined are a mild temporary shock to the economy that will put modest upward pressure on inflation and modest downward pressure on GDP.
This is also what the incoming data is showing. This week, we saw inflation expectations move higher, a reversal of capex spending plans, and weakness in consumer confidence, see the third and fourth chart, and our chart book here. Jobless claims also moved higher, likely driven by government contractors and also by federal workers who had not received forms SF-50 and SF-8 and decided to file for unemployment benefits anyway to get the process started.
The bottom line for markets is that this is a modest stagflation shock to the economy but not a recession.
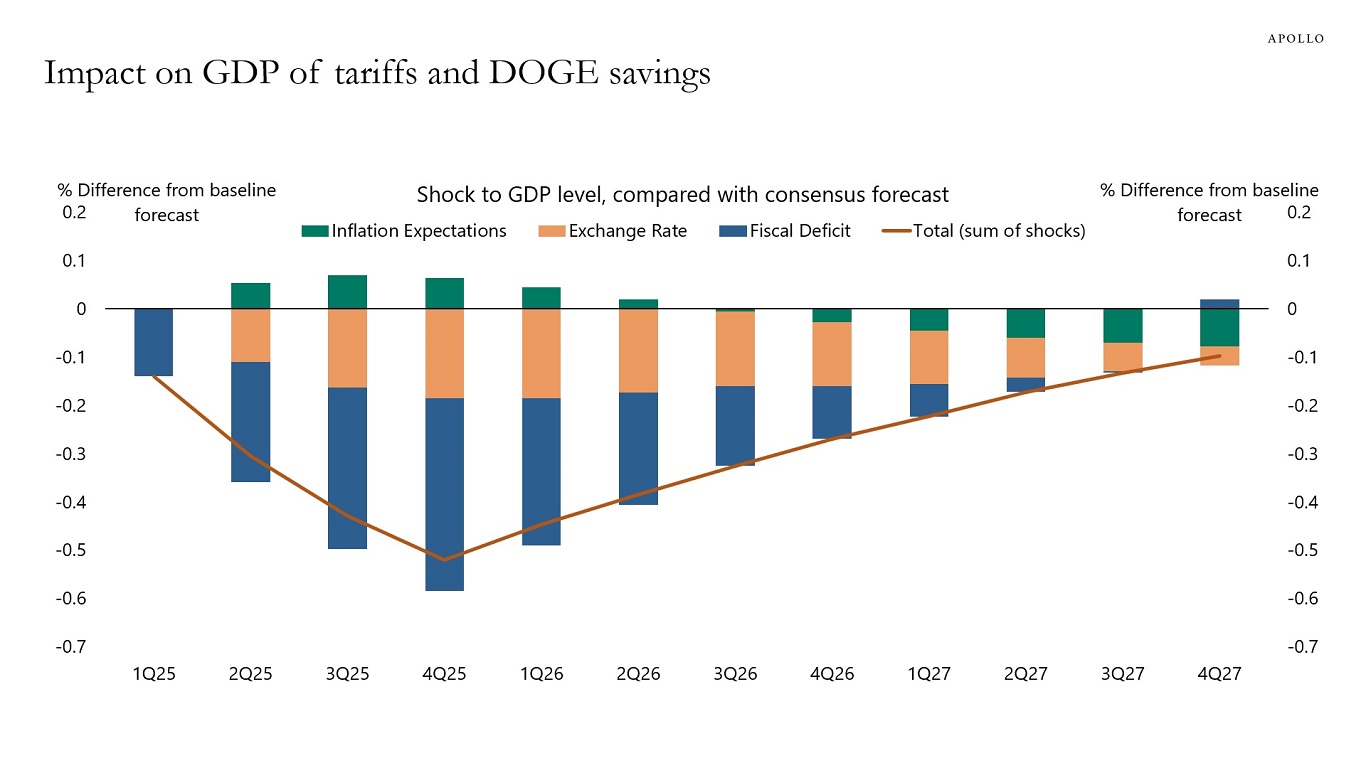
Note: Assuming $100bn in DOGE savings resulting in 0.4% reduction in fiscal deficit, 5% appreciation of exchange rate, and 0.5% pt increase in inflation expectations shocks applied in Q1 2025. Source: Bloomberg SHOK model, Apollo Chief Economist 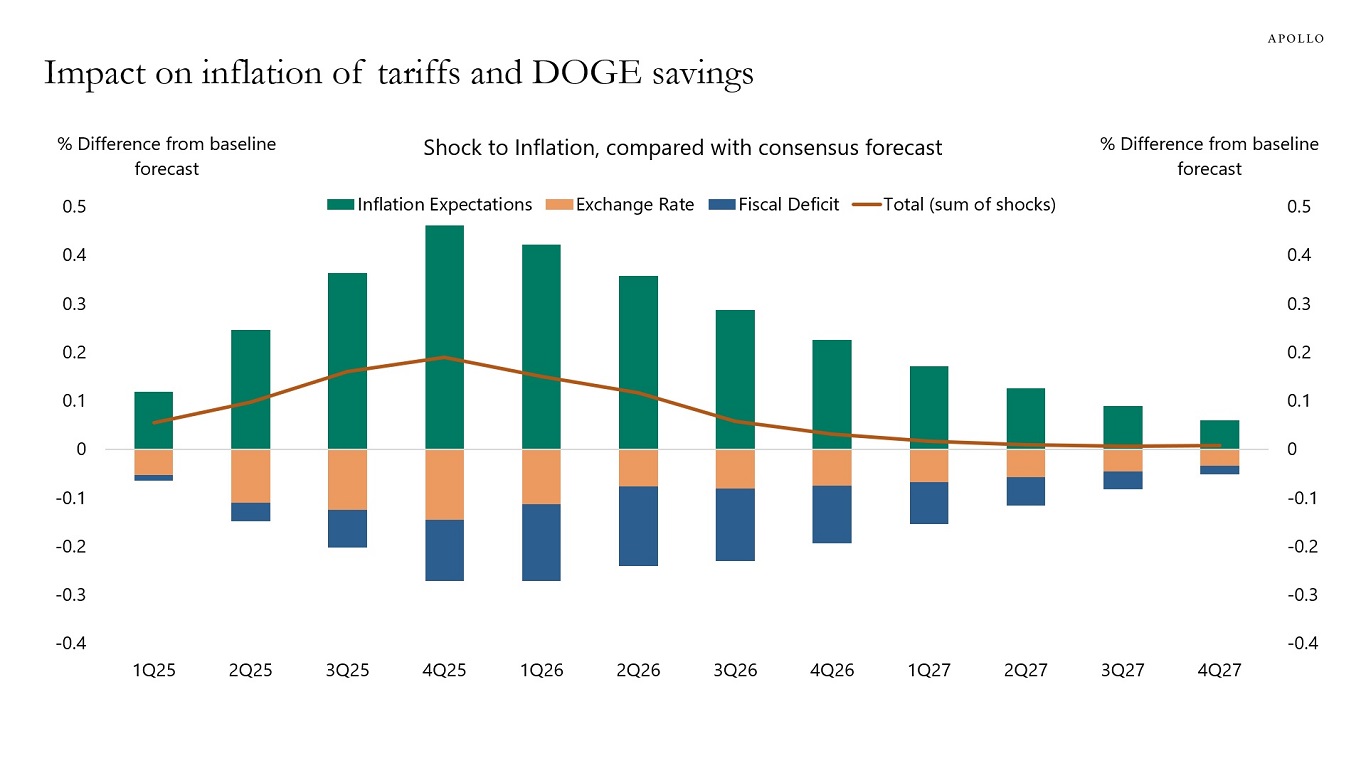
Note: Assuming $100bn in DOGE savings resulting in 0.4% reduction in fiscal deficit, 5% appreciation of exchange rate, and 0.5% pt increase in inflation expectations shocks applied in Q1 2025. Source: Bloomberg SHOK model, Apollo Chief Economist 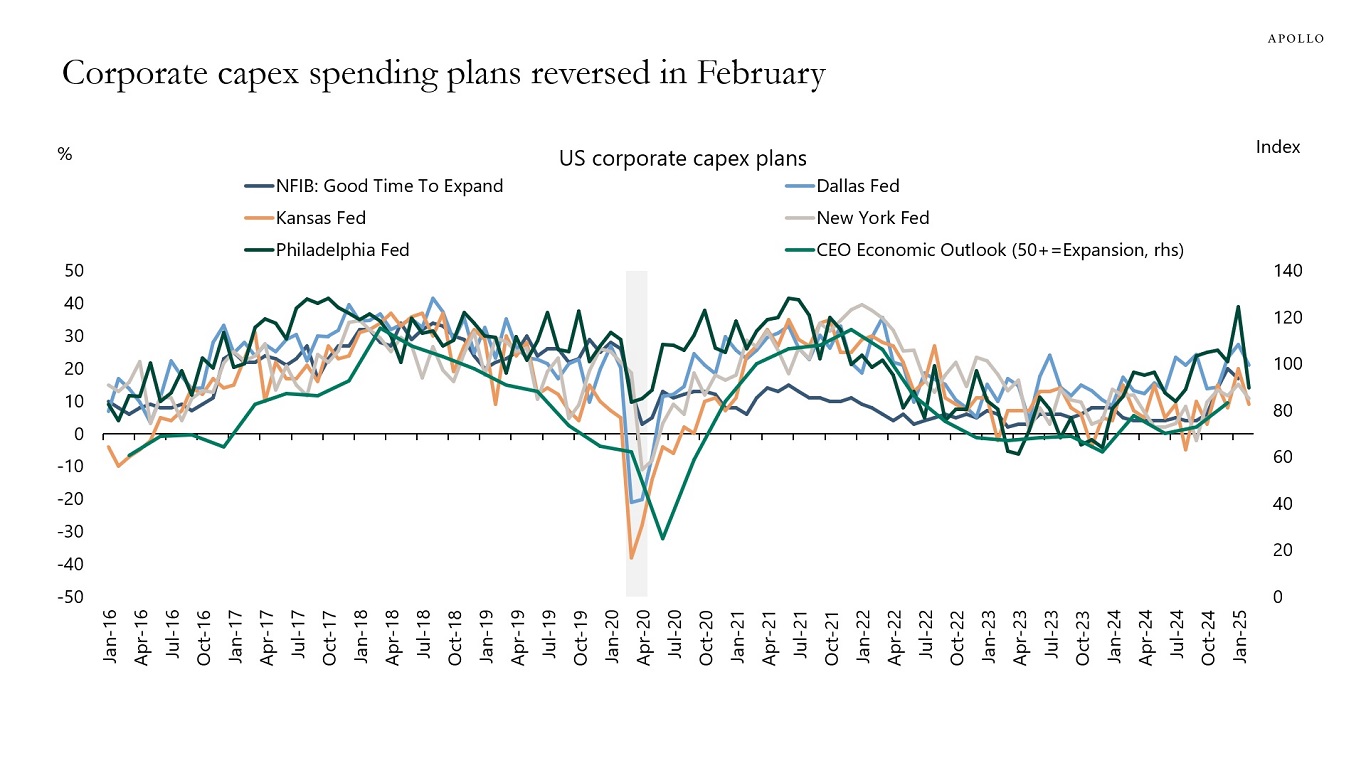
Source: Business Roundtable; NFIB; Federal Reserve Bank of Philadelphia, Dallas, New York, Kansas, and Richmond; Apollo Chief Economist 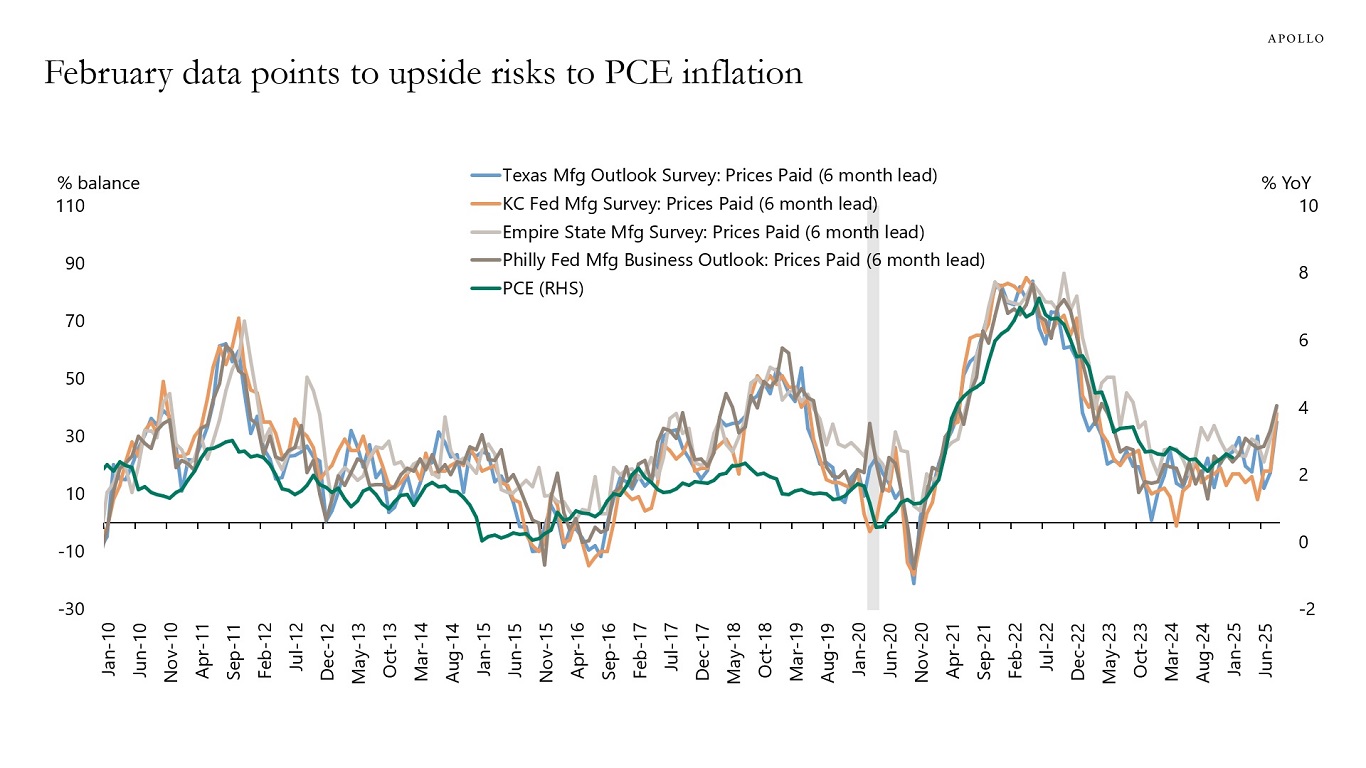
Source: BEA, FRBNY, Federal Reserve Bank of Richmond, Federal Reserve Bank of Philadelphia, Kansas City Fed, Federal Reserve Bank of Dallas, Haver Analytics, Apollo Chief Economist 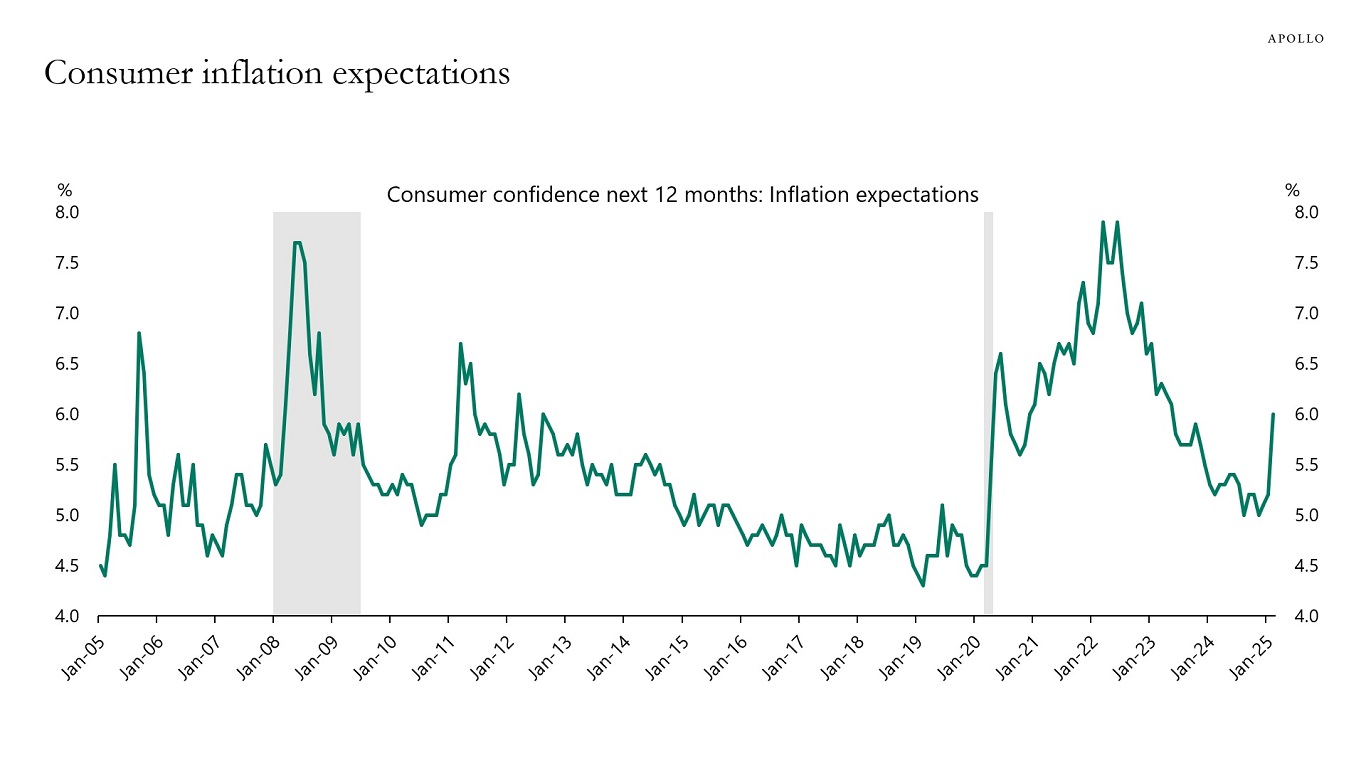
Source: Conference Board, Haver Analytics, Apollo Chief Economist See important disclaimers at the bottom of the page.
-
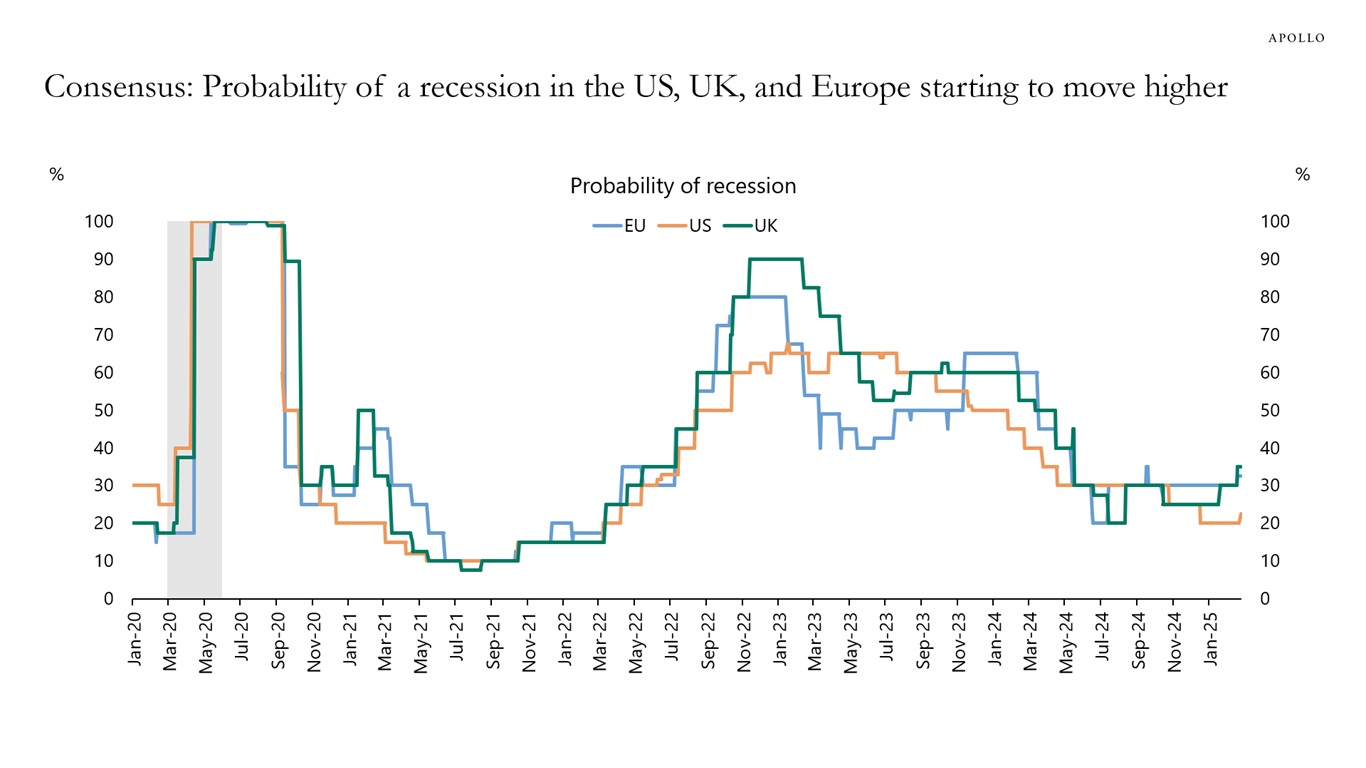
Since 2023, the likelihood of a recession has declined steadily. But in recent weeks, the probability of a recession over the next 12 months has ticked higher in the US, UK, and Europe, see chart below.
Source: Bloomberg, Apollo Chief Economist See important disclaimers at the bottom of the page.
-
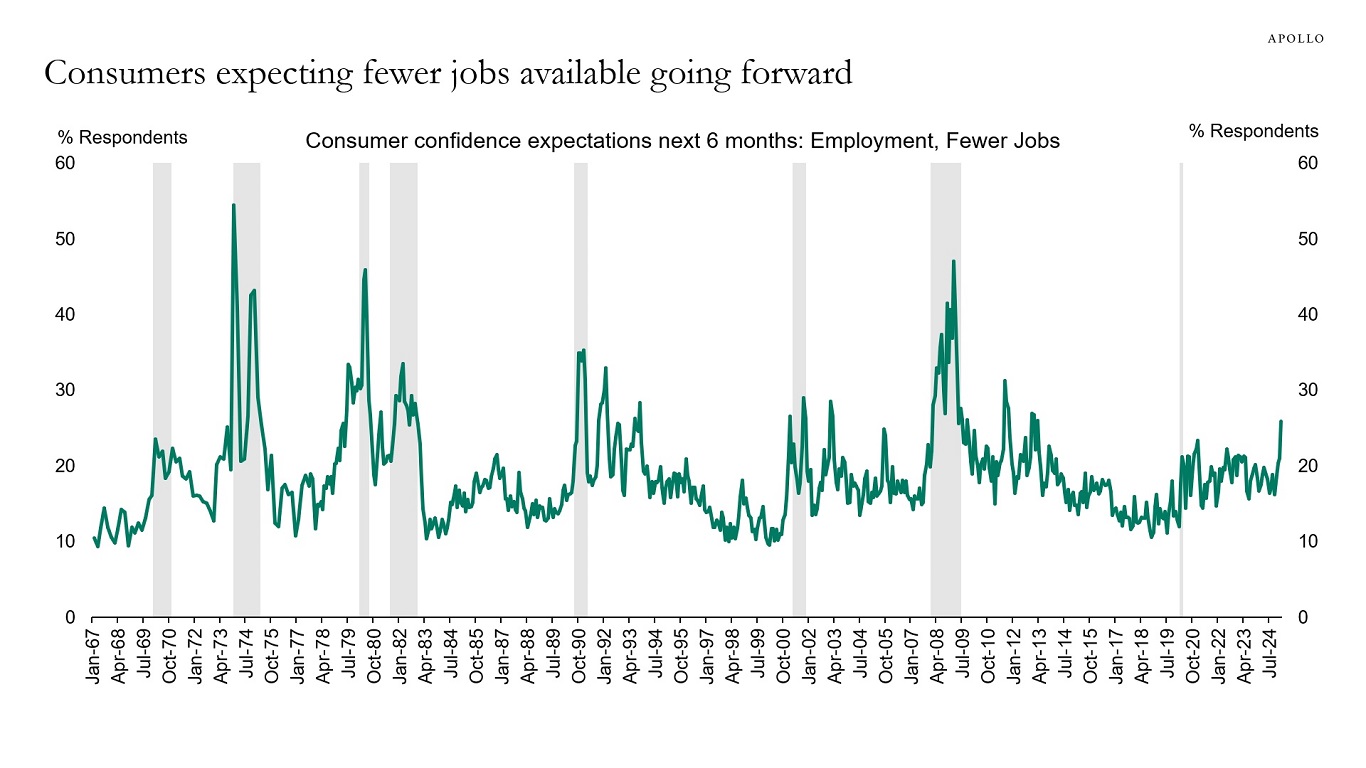
The Conference Board consumer confidence survey for February shows a big jump in the share of consumers who are worried about fewer jobs being available, see the first chart below.
Total employment in the US economy is about 160 million. With 3 million federal employees potentially worrying about their jobs and 6 million federal contractors worrying about their jobs, the risks are rising that households may begin to hold back purchases of cars, computers, washers, dryers, vacation travel plans, etc.
We remain bullish on the economic outlook, but we are very carefully watching the incoming data for signs if this is an inflection point for the business cycle.
On Saturday, we will be publishing our usual daily and weekly indicators for the US economy to monitor if the weakness in sentiment seen in the charts below is starting to show up in actual spending decisions for consumers and firms.
Source: Conference Board, Haver Analytics, Apollo Chief Economist 
Source: Bloomberg, Apollo Chief Economist See important disclaimers at the bottom of the page.
-
The world has moved from globalization to segmentation.
Specifically, we have gone from a world of globalization where goods were flowing over borders, people were moving across borders, and the rules for businesses were predictable and harmonized across countries.
In the new world, economies, markets, and policies are more segmented. Tariffs and geopolitical considerations limit the flow of goods. There are more restrictions on immigration. Countries have different industrial policies, which have made the rules for businesses more unpredictable and idiosyncratic.
The consequence of moving from a global economy to a segmented economy consisting of many separate “islands” is permanently higher inflation everywhere. Imported goods are more expensive, domestically produced goods are more expensive, less immigration makes domestic labor more expensive, and different industrial policies in different countries reduce competition.
The bottom line is that globalization was putting downward pressure on inflation. Segmentation, or deglobalization, is putting upward pressure on inflation.
For markets, the conclusion is straightforward. An increasingly segmented global economy is putting structural upward pressure on inflation in goods markets and labor markets, which will keep interest rates structurally higher for longer.
See important disclaimers at the bottom of the page.
-
There is a long list of forces pushing inflation higher, including tariffs, rising wage growth, higher inflation expectations, easy fiscal policy, easy financial conditions, residual seasonality, and a slowdown in apartment deliveries putting upward pressure on rents later this year, see complete list below. Our latest inflation outlook is available here.
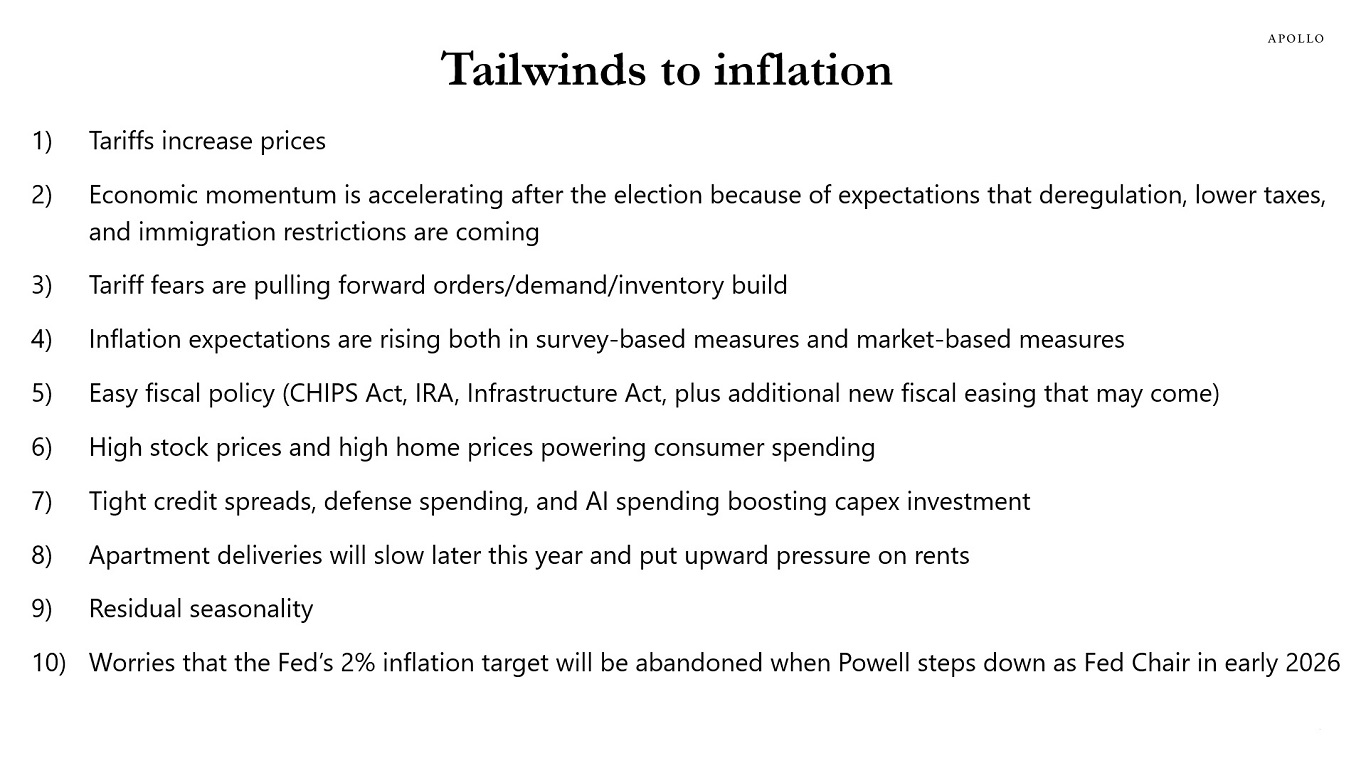
Source: Apollo Chief Economist See important disclaimers at the bottom of the page.
-
Global equity investors are not only highly concentrated in tech stocks, they are also highly concentrated in US stocks, see chart below. It goes against page one in the finance textbook, which says that investors should be diversified.
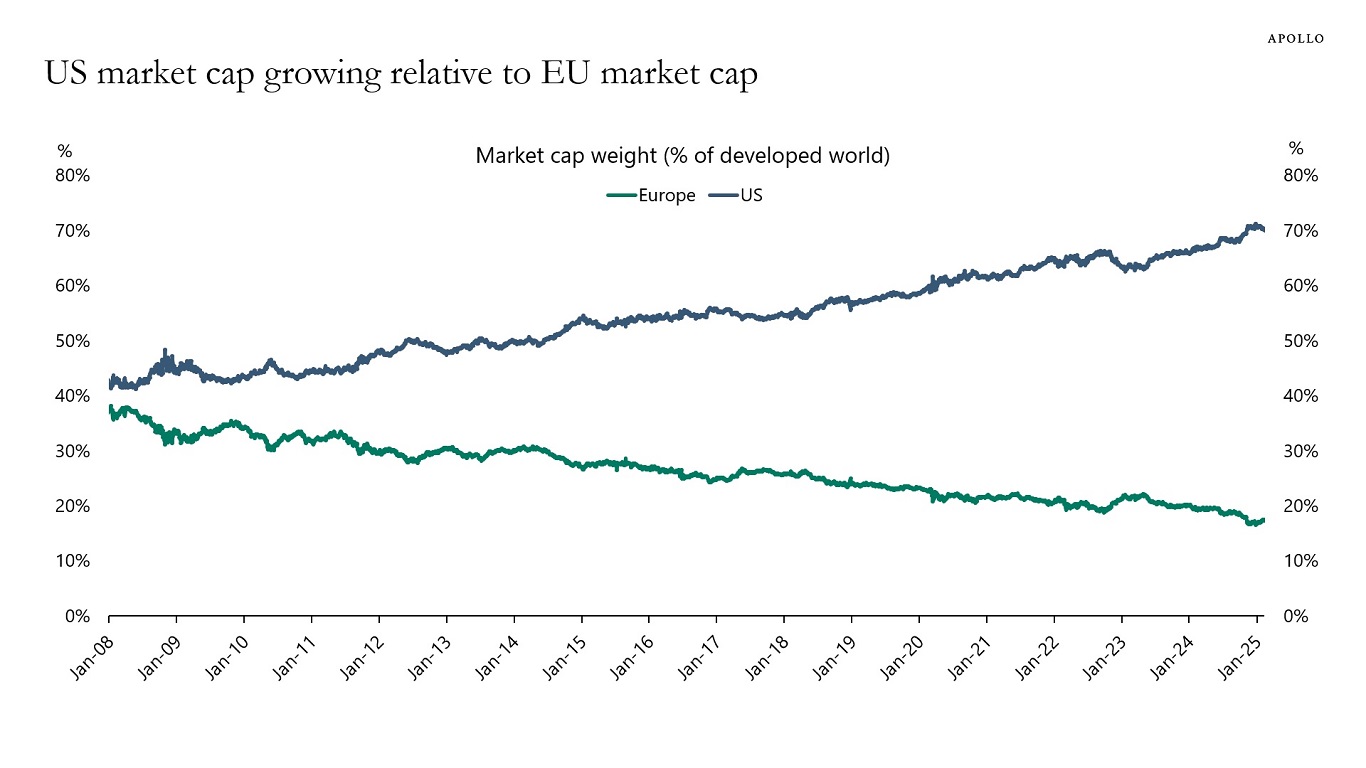
Source: MSCI, Bloomberg, Apollo Chief Economist See important disclaimers at the bottom of the page.
-
Rates higher for longer continues to be a headwind to the outlook for CRE, see chart below.
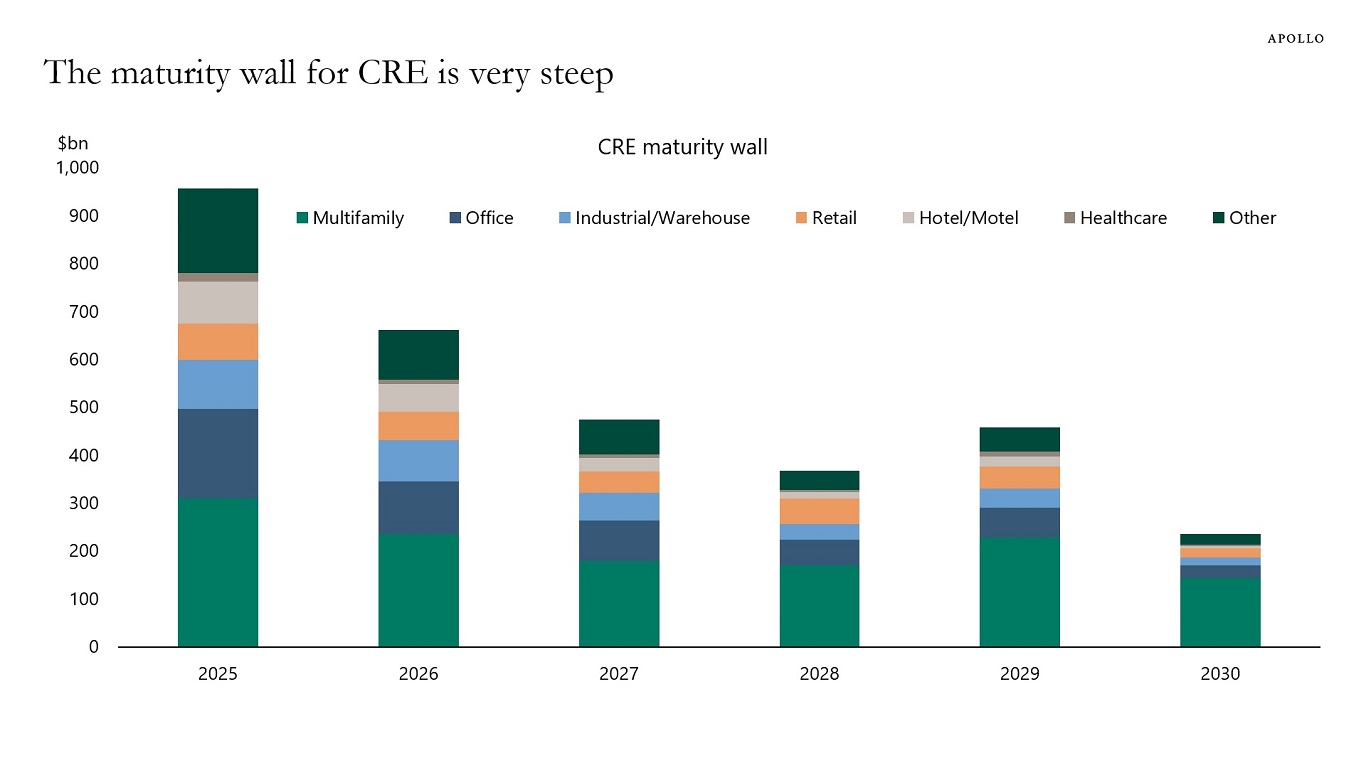
Source: Mortgage Bankers Association, Apollo Chief Economist See important disclaimers at the bottom of the page.

This presentation may not be distributed, transmitted or otherwise communicated to others in whole or in part without the express consent of Apollo Global Management, Inc. (together with its subsidiaries, “Apollo”).
Apollo makes no representation or warranty, expressed or implied, with respect to the accuracy, reasonableness, or completeness of any of the statements made during this presentation, including, but not limited to, statements obtained from third parties. Opinions, estimates and projections constitute the current judgment of the speaker as of the date indicated. They do not necessarily reflect the views and opinions of Apollo and are subject to change at any time without notice. Apollo does not have any responsibility to update this presentation to account for such changes. There can be no assurance that any trends discussed during this presentation will continue.
Statements made throughout this presentation are not intended to provide, and should not be relied upon for, accounting, legal or tax advice and do not constitute an investment recommendation or investment advice. Investors should make an independent investigation of the information discussed during this presentation, including consulting their tax, legal, accounting or other advisors about such information. Apollo does not act for you and is not responsible for providing you with the protections afforded to its clients. This presentation does not constitute an offer to sell, or the solicitation of an offer to buy, any security, product or service, including interest in any investment product or fund or account managed or advised by Apollo.
Certain statements made throughout this presentation may be “forward-looking” in nature. Due to various risks and uncertainties, actual events or results may differ materially from those reflected or contemplated in such forward-looking information. As such, undue reliance should not be placed on such statements. Forward-looking statements may be identified by the use of terminology including, but not limited to, “may”, “will”, “should”, “expect”, “anticipate”, “target”, “project”, “estimate”, “intend”, “continue” or “believe” or the negatives thereof or other variations thereon or comparable terminology.