


Want it delivered daily to your inbox?
-
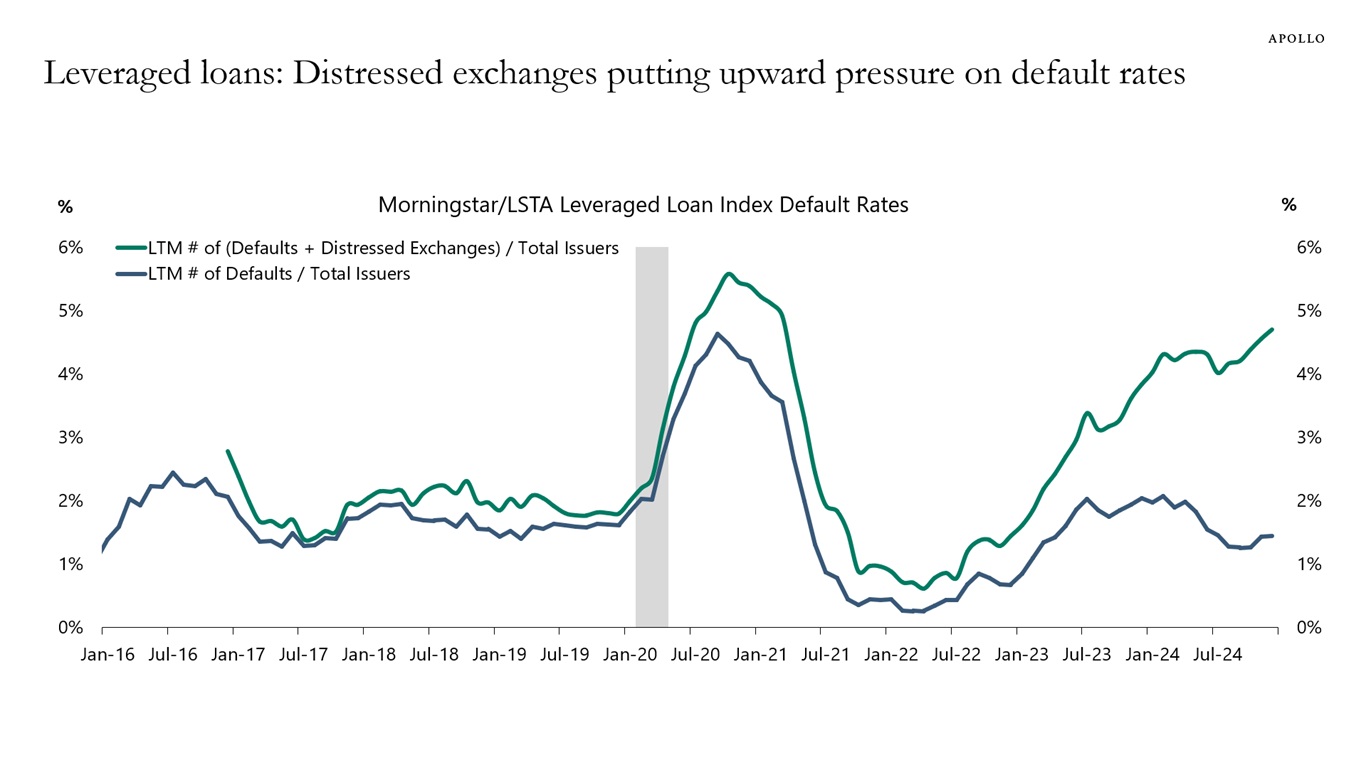
While headline default rates have ticked up in the last two years, they are primarily driven by distressed exchanges, see the first chart. The increase in dollar-weighted default rates has been less severe—those have, in fact, been trending lower recently—suggesting that a disproportionate number of small companies are facing stress, see the second chart.
The implication is that even as default rates have ticked up, credit losses suffered by high-yield and leveraged-loan investors remain pretty muted. However, with interest rates staying higher for longer, the increase in distressed exchanges could pressure future recoveries if the underlying issuer fundamentals remain stressed.
For more discussion, see our 2025 credit outlook here.
Source: Shobhit Gupta, PitchBook LCD, Apollo Chief Economist 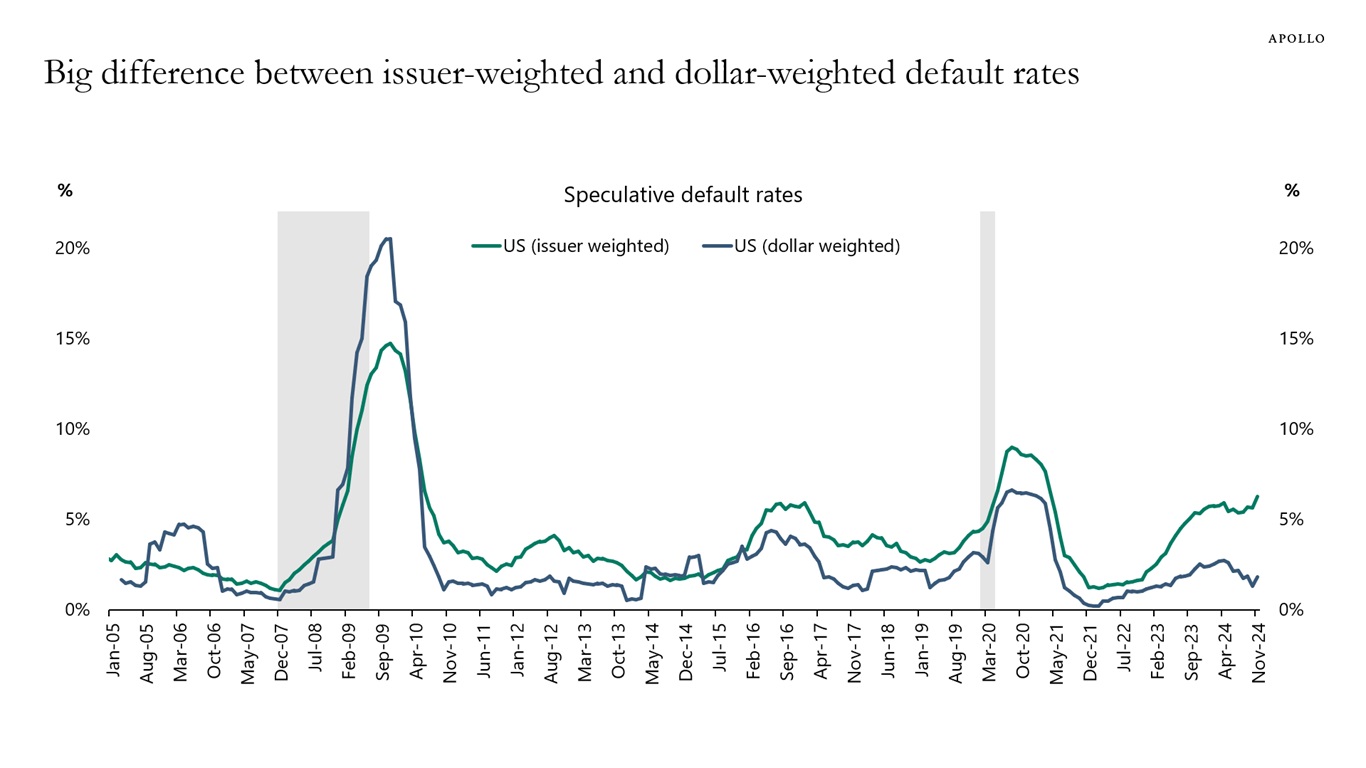
Source: Shobhit Gupta, Moody’s Analytics, Apollo Chief Economist See important disclaimers at the bottom of the page.
-
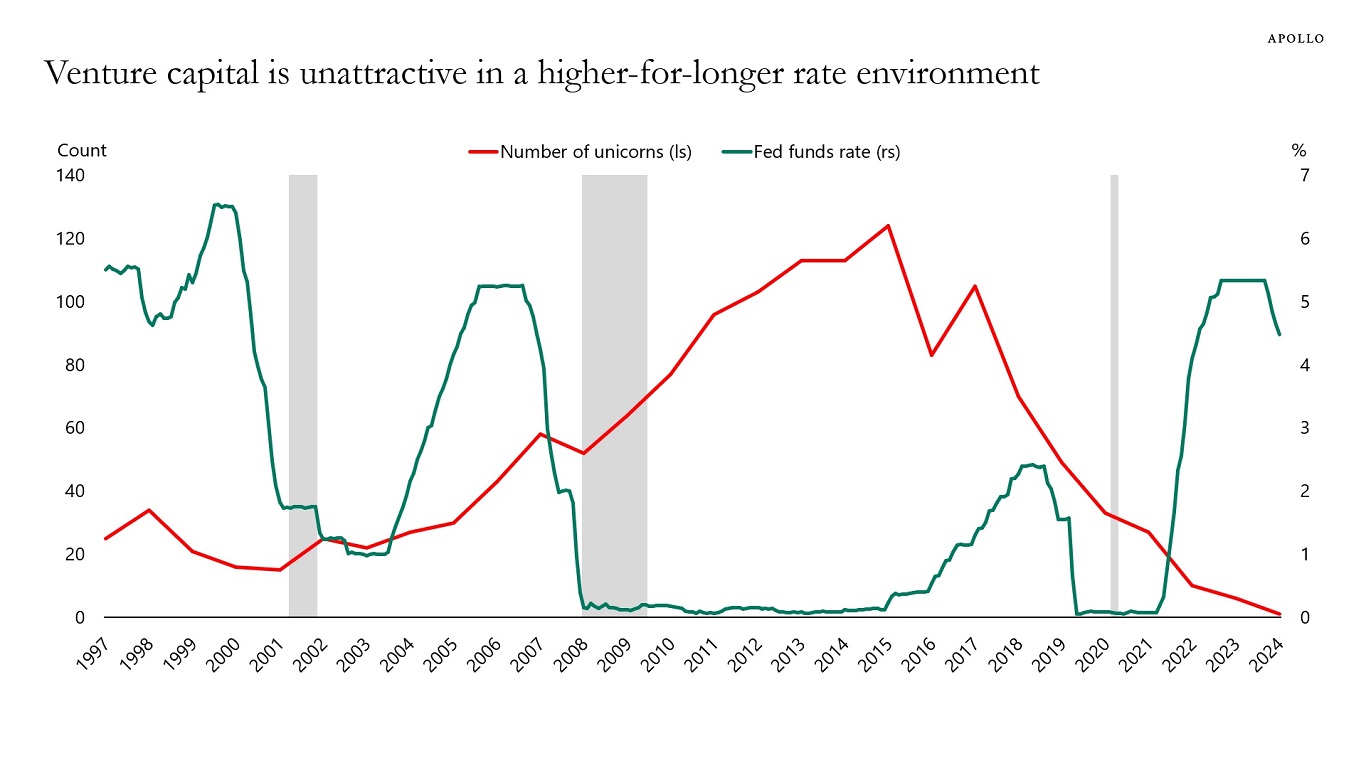
The chart below shows that when interest rates are low, more unicorns are created because it is cheaper for startups to access capital, allowing them to scale faster and reach a billion-dollar valuation.
When interest rates are higher for longer, fewer unicorns are created because financing costs are more expensive, and it becomes more difficult for companies to expand.
This is not surprising. In fact, this is the entire idea from the Fed with raising interest rates: to make borrowing more expensive and slow economic activity.
The bottom line is that venture capital is unattractive in a higher-for-longer environment because startup firms are characterized by having no earnings, no revenues, and no cash flows, and, therefore, less ability to pay the debt-servicing costs that are associated with expanding the business.
In short, companies with low interest coverage ratios struggle when interest rates are higher for longer.
Source: Ilya Strebulaev, Venture Capital Initiative, Stanford Graduate School of Business, Apollo Chief Economist See important disclaimers at the bottom of the page.
-
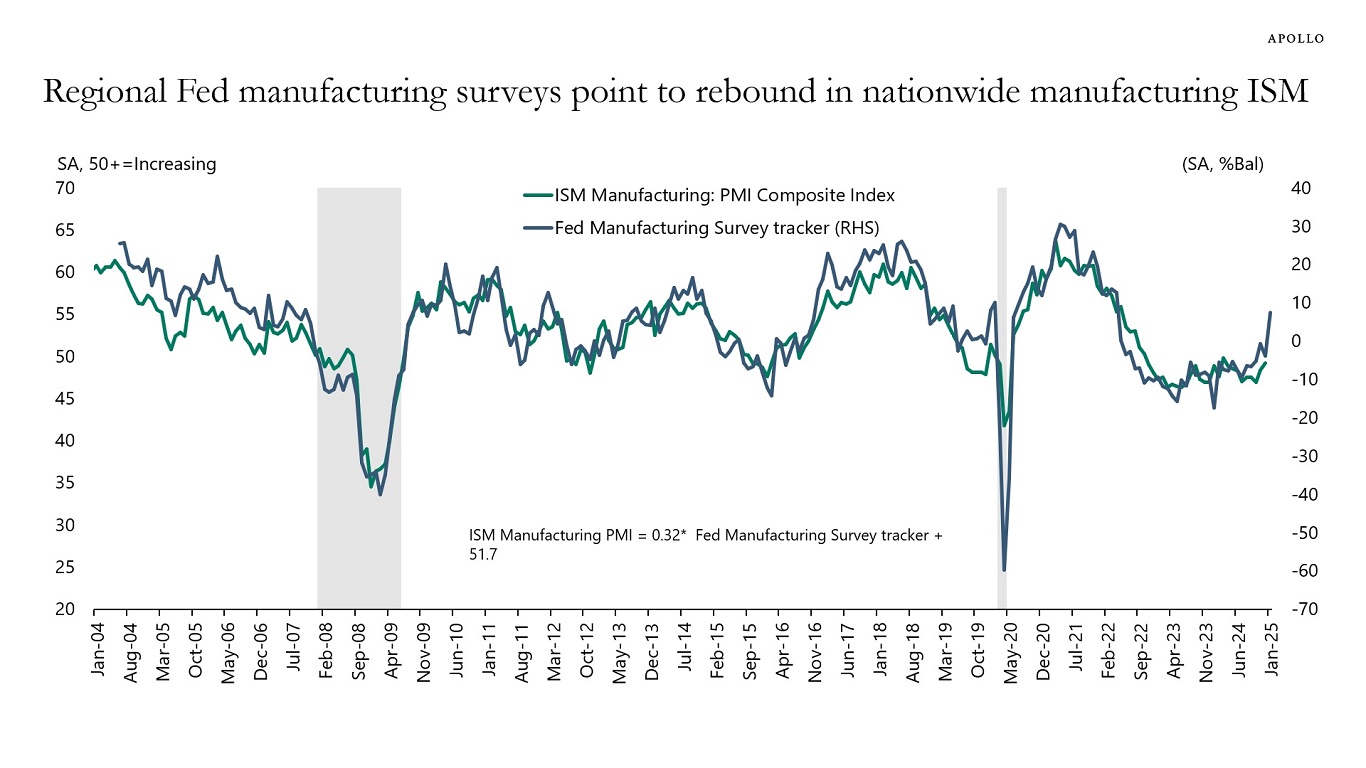
On Monday, we will get manufacturing ISM for January, and it is likely to show a big jump higher, see charts below. Based on the historical relationship with the regional Fed ISM indicators, the nationwide ISM could increase to 54, a level which would be consistent with first-quarter GDP growth of 3.4%.
The strong momentum in the economy is driven by high stock prices, high home prices, and strong tailwinds to growth from tech capex spending, defense spending, and spending driven by the CHIPS Act, the IRA, and the Infrastructure Act.
Combined with low jobless claims and higher animal spirits since the election, the bottom line is that the US economy is entering 2025 with accelerating momentum.
The narrative that the economy is slowing and inflation is moving down to 2% is wrong, see again charts below.
Note: Fed Manufacturing tracker is the average of the FRBNY, Federal Reserve Bank of Richmond, Federal Reserve Bank of Philadelphia, Kansas City Fed, Federal Reserve Bank of Dallas manufacturing surveys. Source: ISM, FRBNY, Federal Reserve Bank of Richmond, Federal Reserve Bank of Philadelphia, Kansas City Fed, Federal Reserve Bank of Dallas 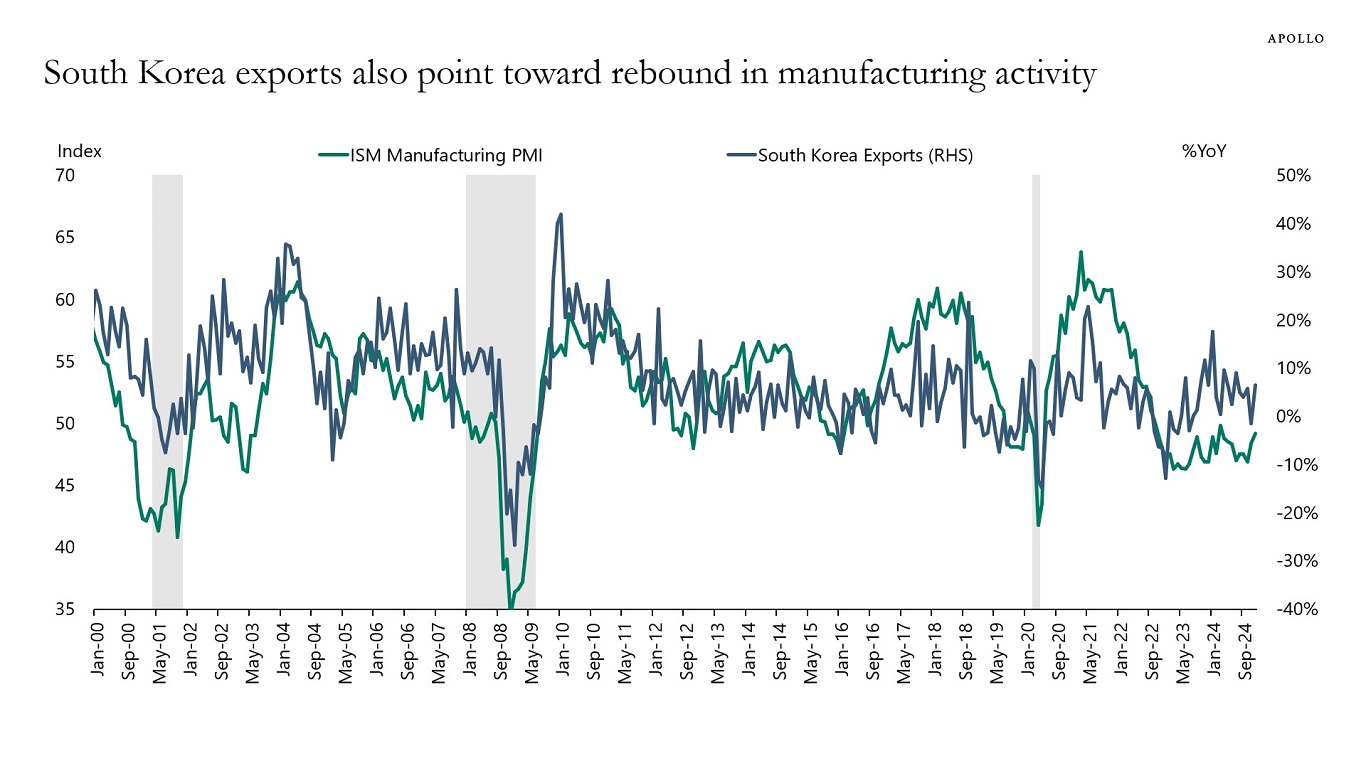
Source: BoK, ISM, Haver Analytics, Apollo Chief Economist 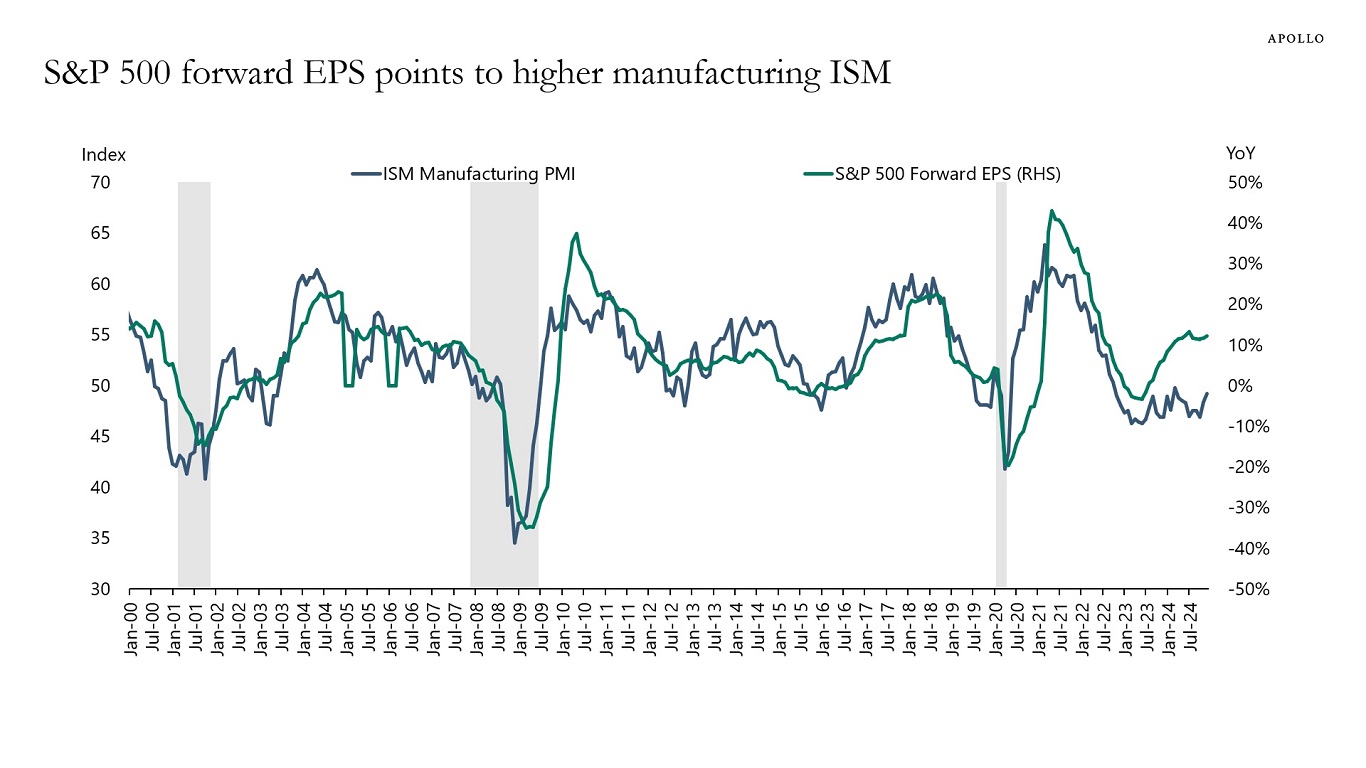
Source: ISM, Bloomberg, Apollo Chief Economist See important disclaimers at the bottom of the page.
-
In France, government pension spending is 14% of GDP. In Germany, it is 10%, and in the United States, it is 7%, see chart below.
There is a need for more retirement savings in all OECD countries.
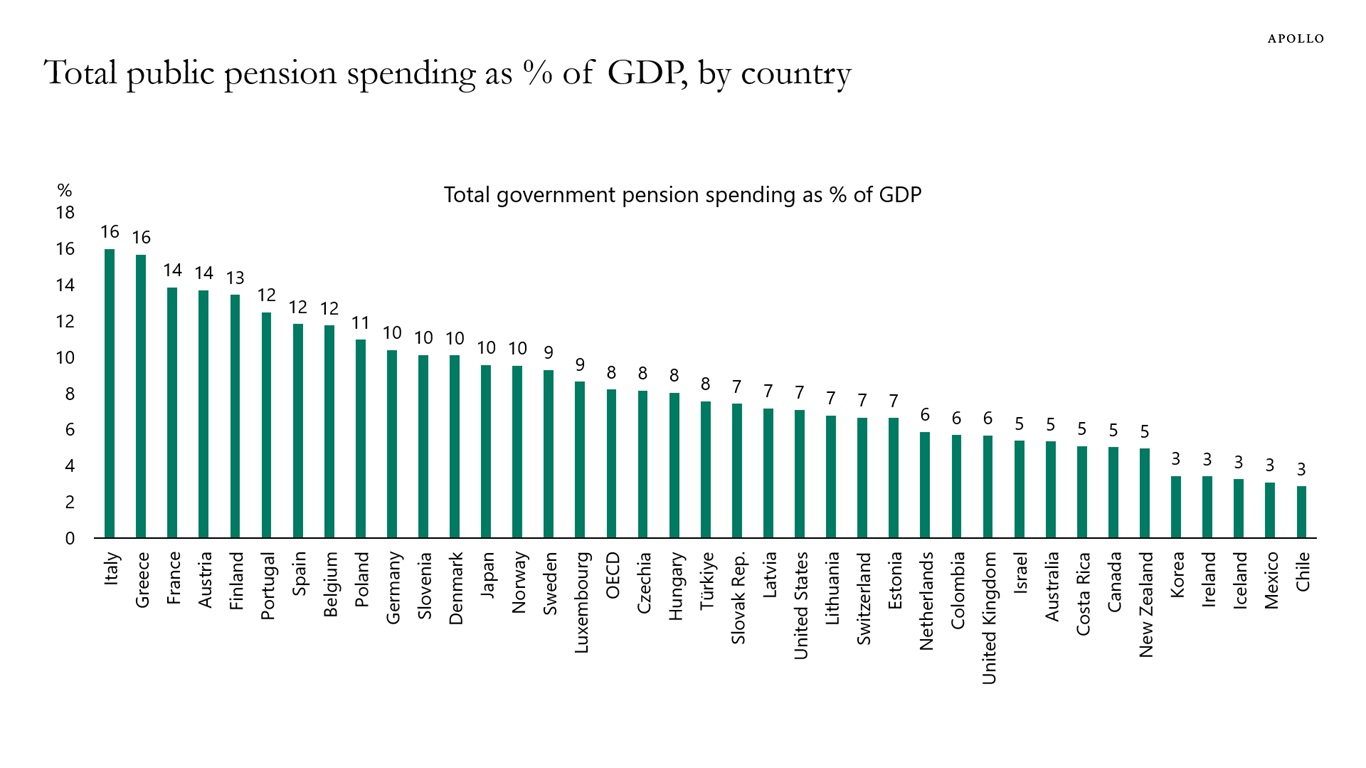
Note: Data for 2019. Source: OECD, Apollo Chief Economist See important disclaimers at the bottom of the page.
-
The DeepSeek correction in tech stocks has not changed the overall concentration problem in the S&P 500, see chart below. Investors in the S&P 500 continue to be dramatically over-exposed to the tech sector.
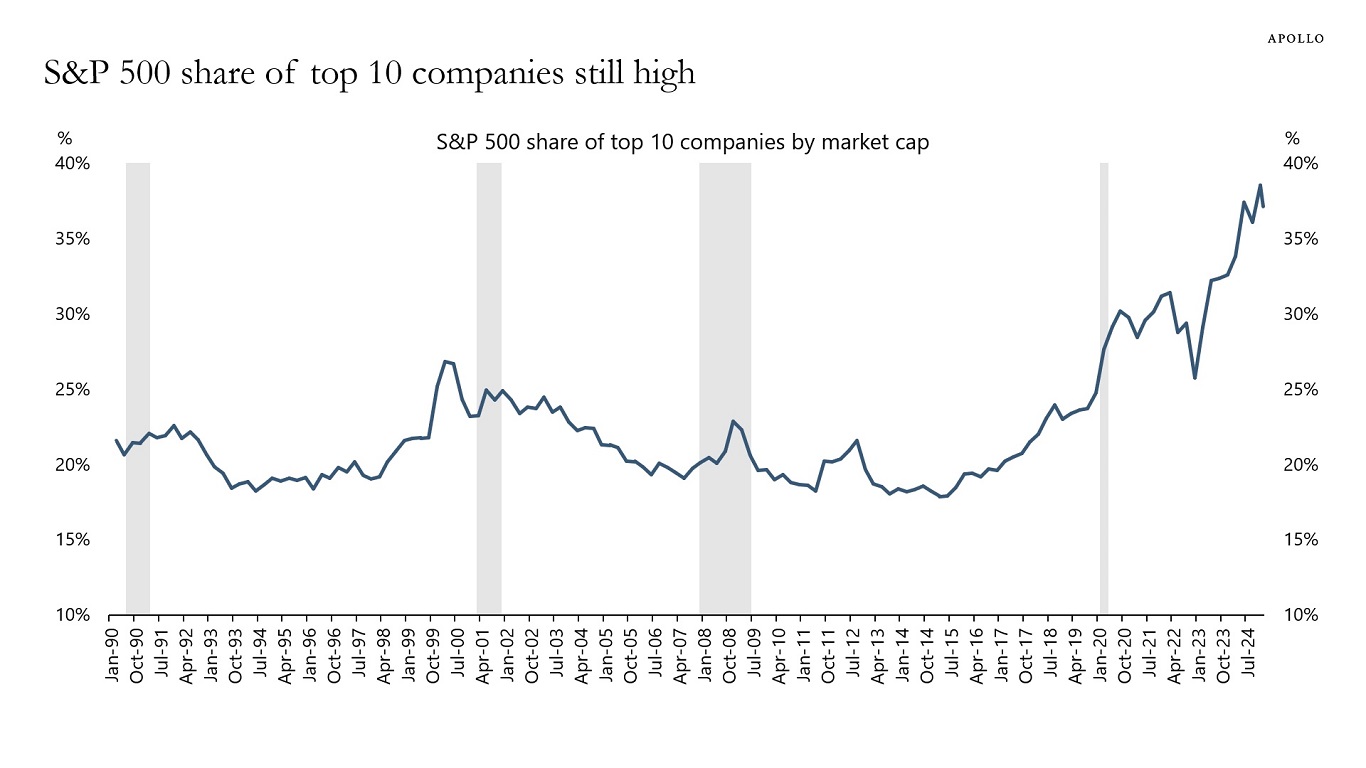
Source: Bloomberg, Apollo Chief Economist See important disclaimers at the bottom of the page.
-
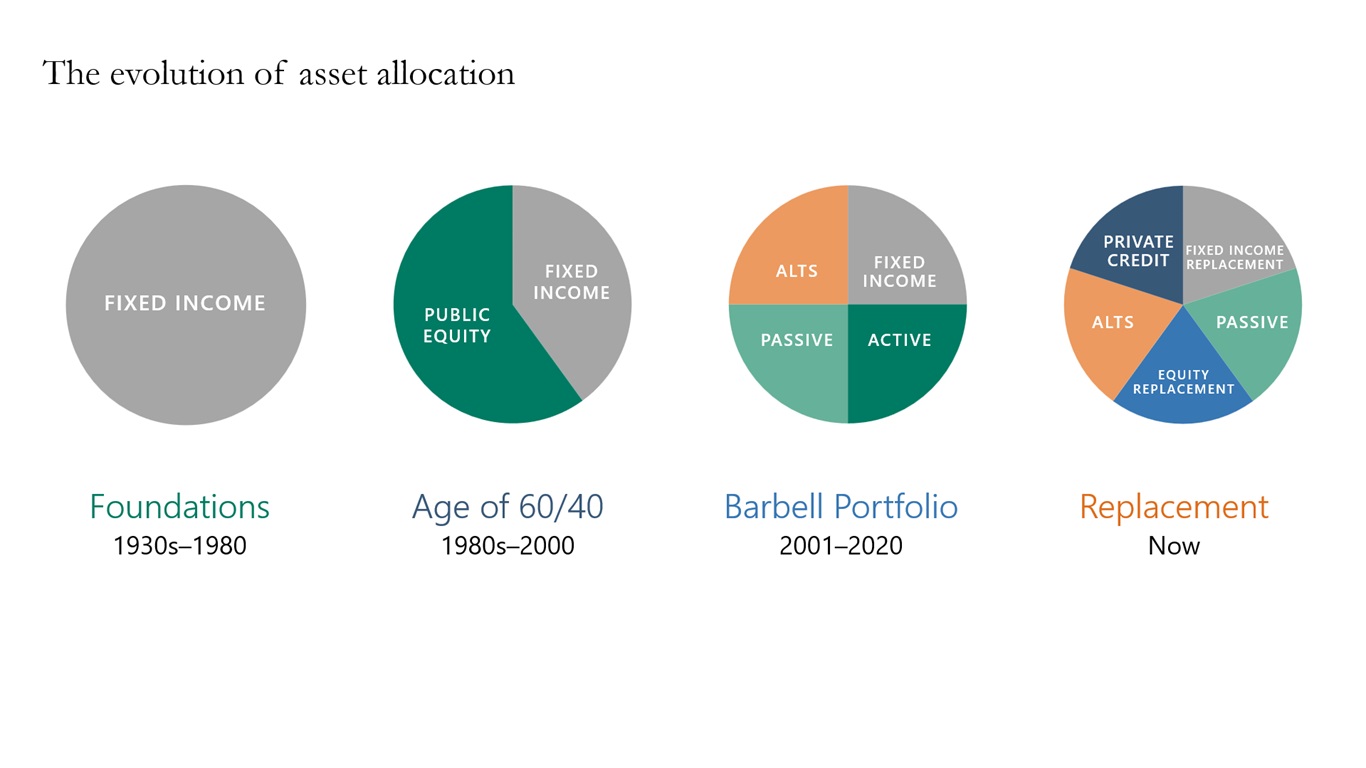
Asset allocation has evolved from the 60/40 portfolio to the barbell portfolio to now focusing on fixed income replacement and equity replacement, see chart below.
Source: Apollo Chief Economist See important disclaimers at the bottom of the page.
-
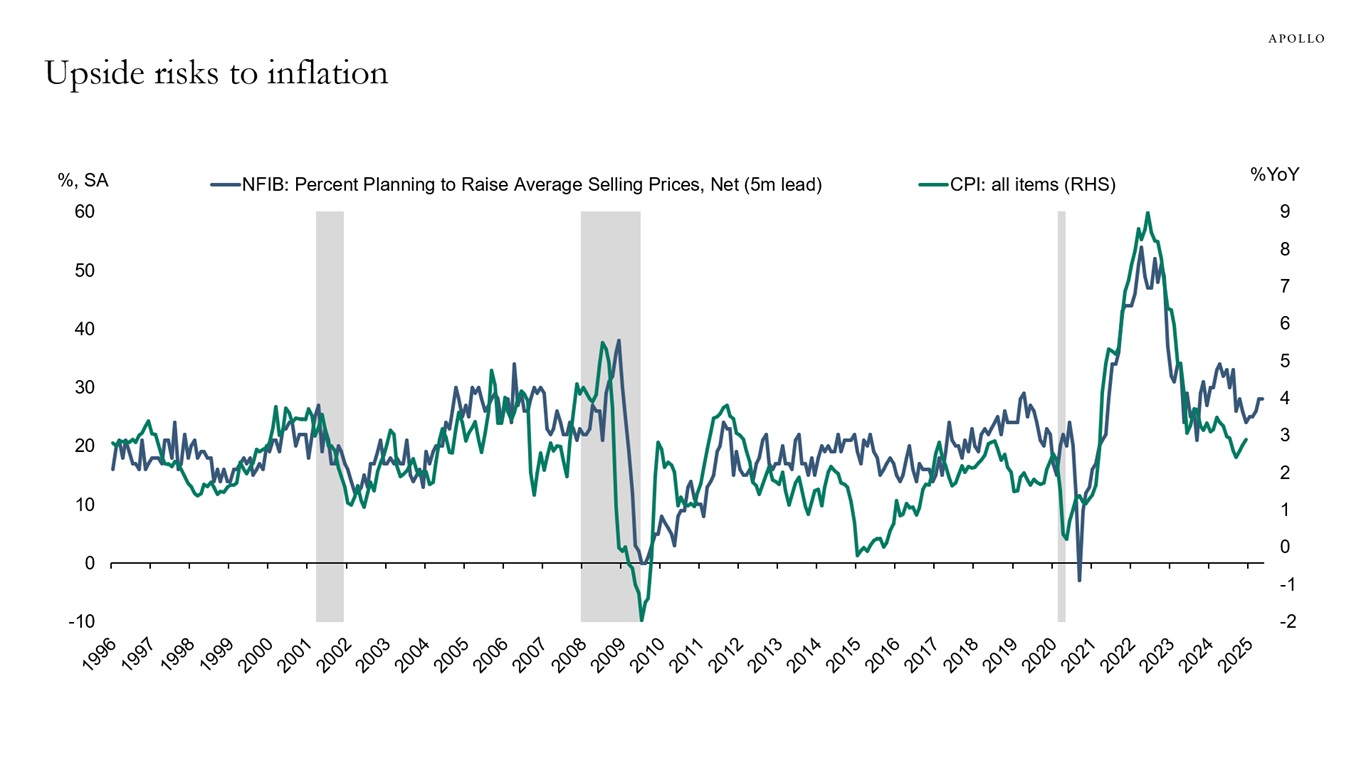
The share of companies planning to raise prices remains elevated and has started to trend higher, see the first chart below.
Combined with the recent jump in ISM services prices paid, see the second chart, this points to upside risks to inflation going forward.
Source: NFIB, Haver Analytics, Apollo Chief Economist 
Source: BEA, ISM, Haver Analytics, Apollo Chief Economist See important disclaimers at the bottom of the page.
-
We created a chart book looking at recent trends in US immigration. It is available here, with key charts inserted below.
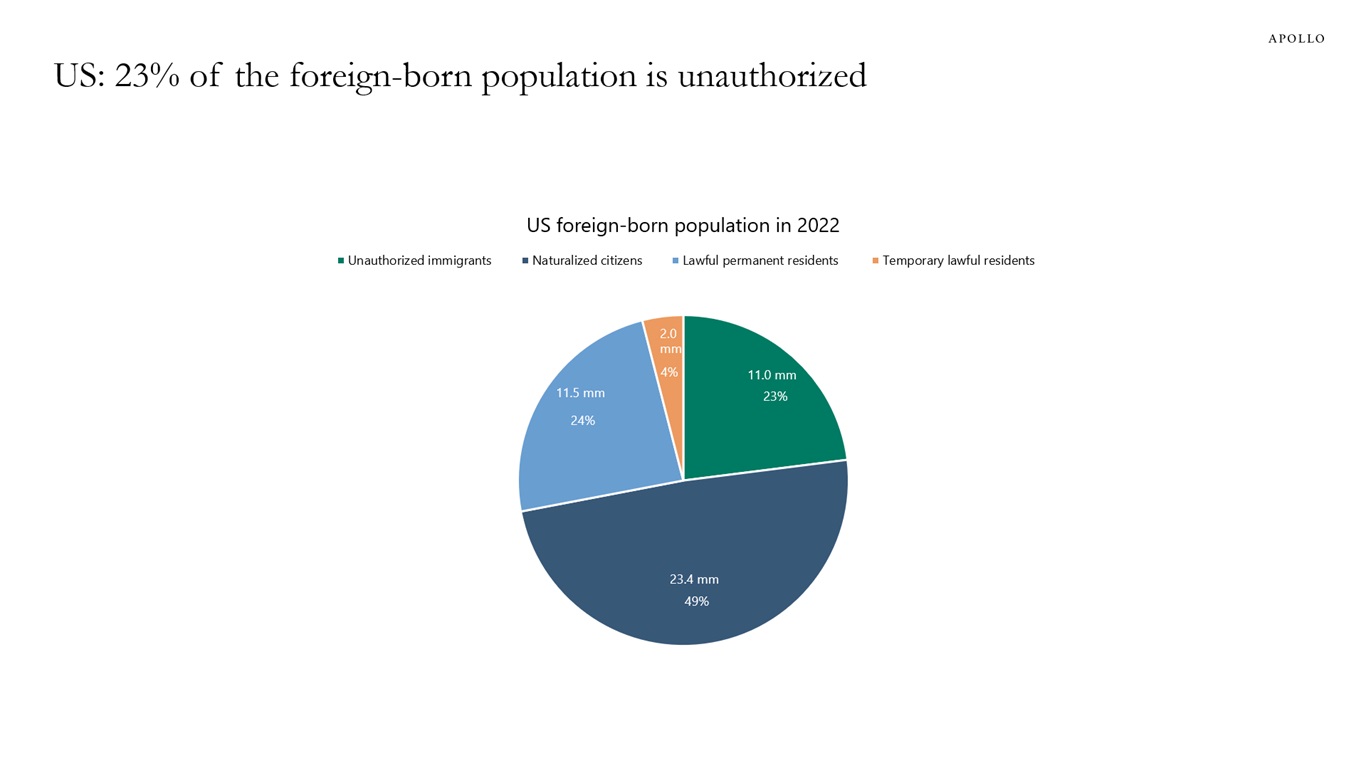
Source: Pew Research Center, 2022, Apollo Chief Economist 
Note: Pew Research Center estimates based on augmented US Census Bureau data – American Community Survey, 2005-2022 (IPUMS); Current Population Survey, 1995-2004; Decennial Census 1990 from Warren and Warren (2013). Source: Pew Research Center, Apollo Chief Economist 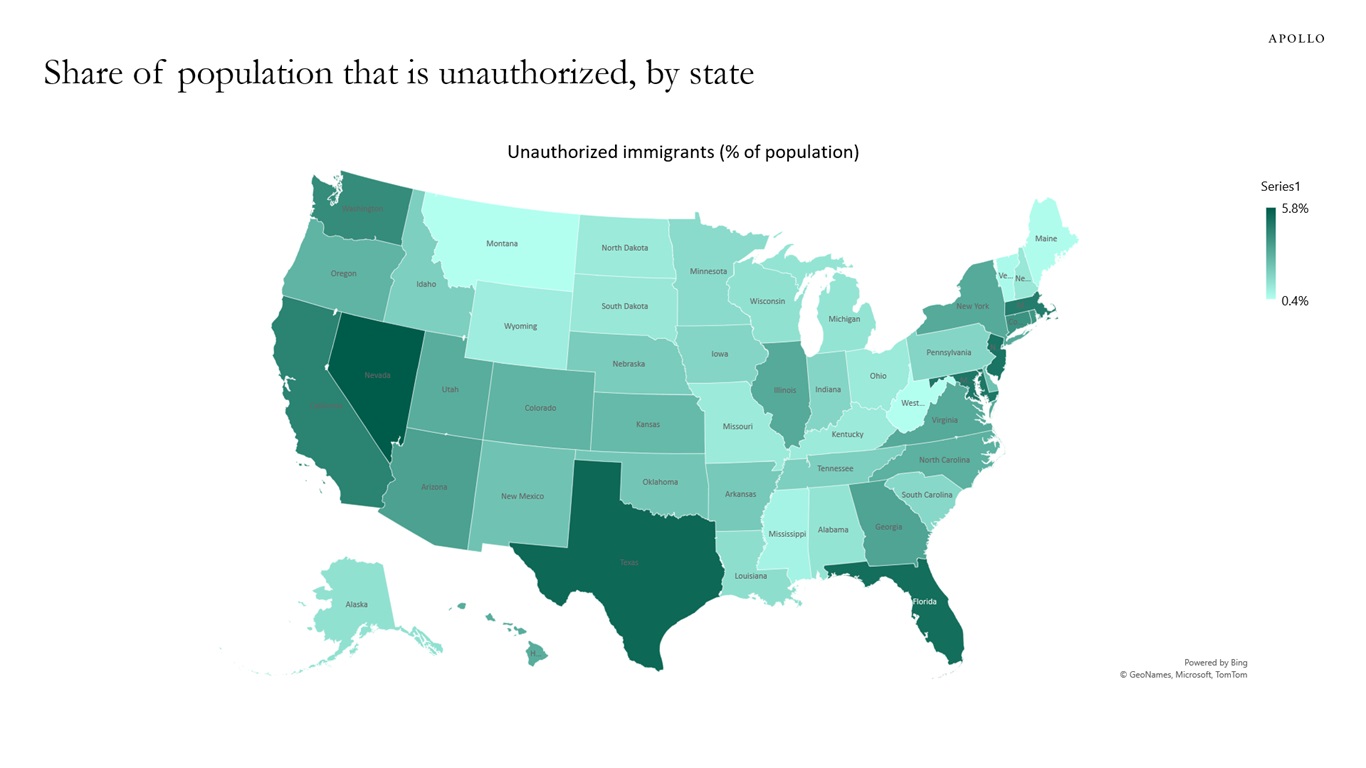
Note: Pew Research Center estimates based on augmented US Census Bureau data – American Community Survey, 2005-2022 (IPUMS); Current Population Survey, 1995-2004; Decennial Census 1990 from Warren and Warren (2013). Source: Pew Research Center, Apollo Chief Economist 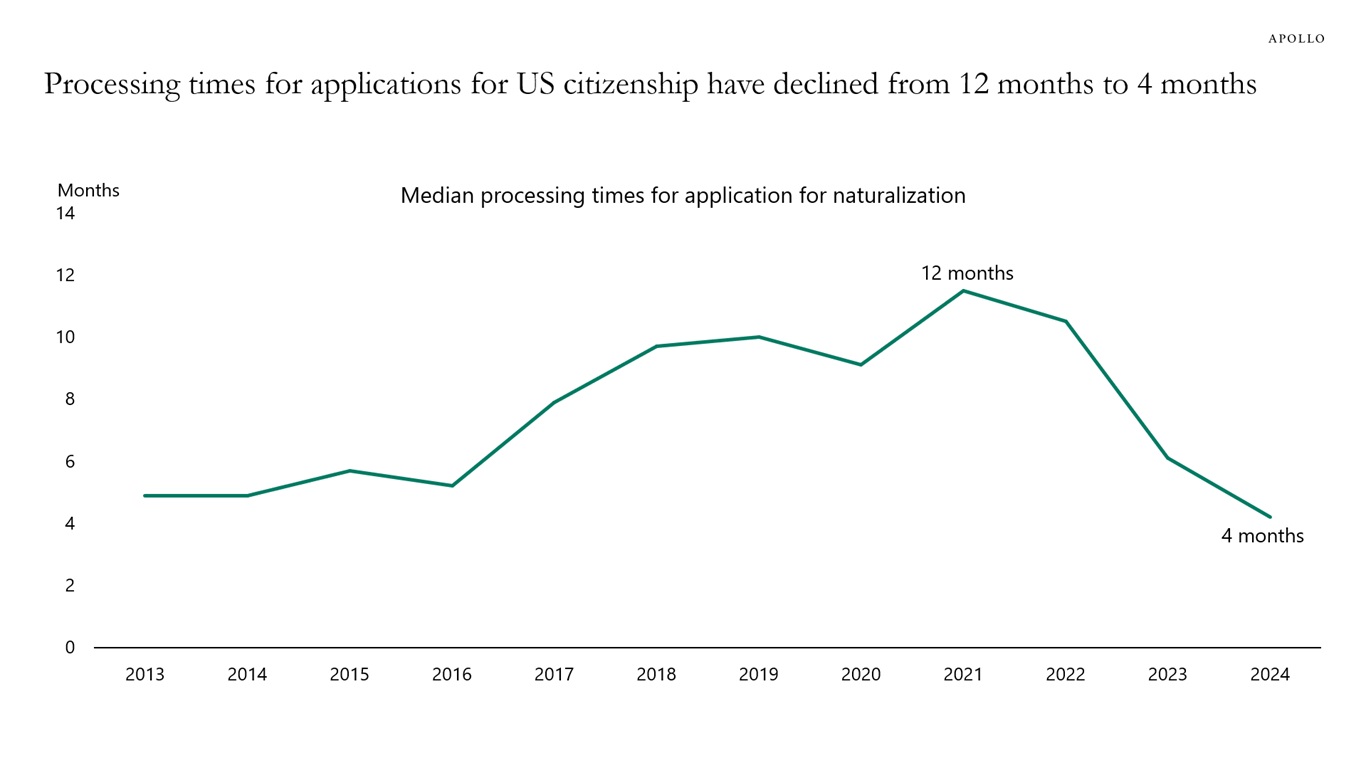
Note: Year indicates Fiscal Year. Source: US Citizenship and Immigration Services, Apollo Chief Economist 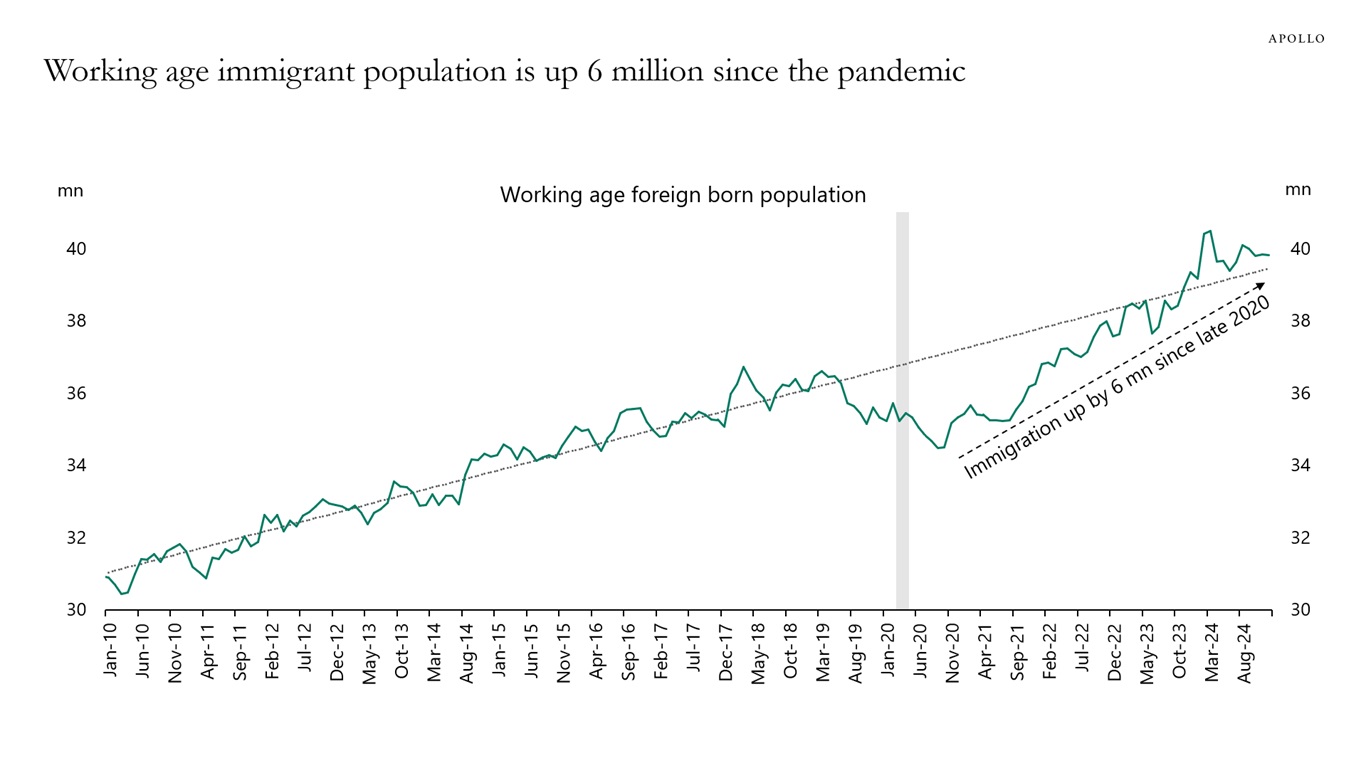
Source: BLS, Haver Analytics, Apollo Chief Economist 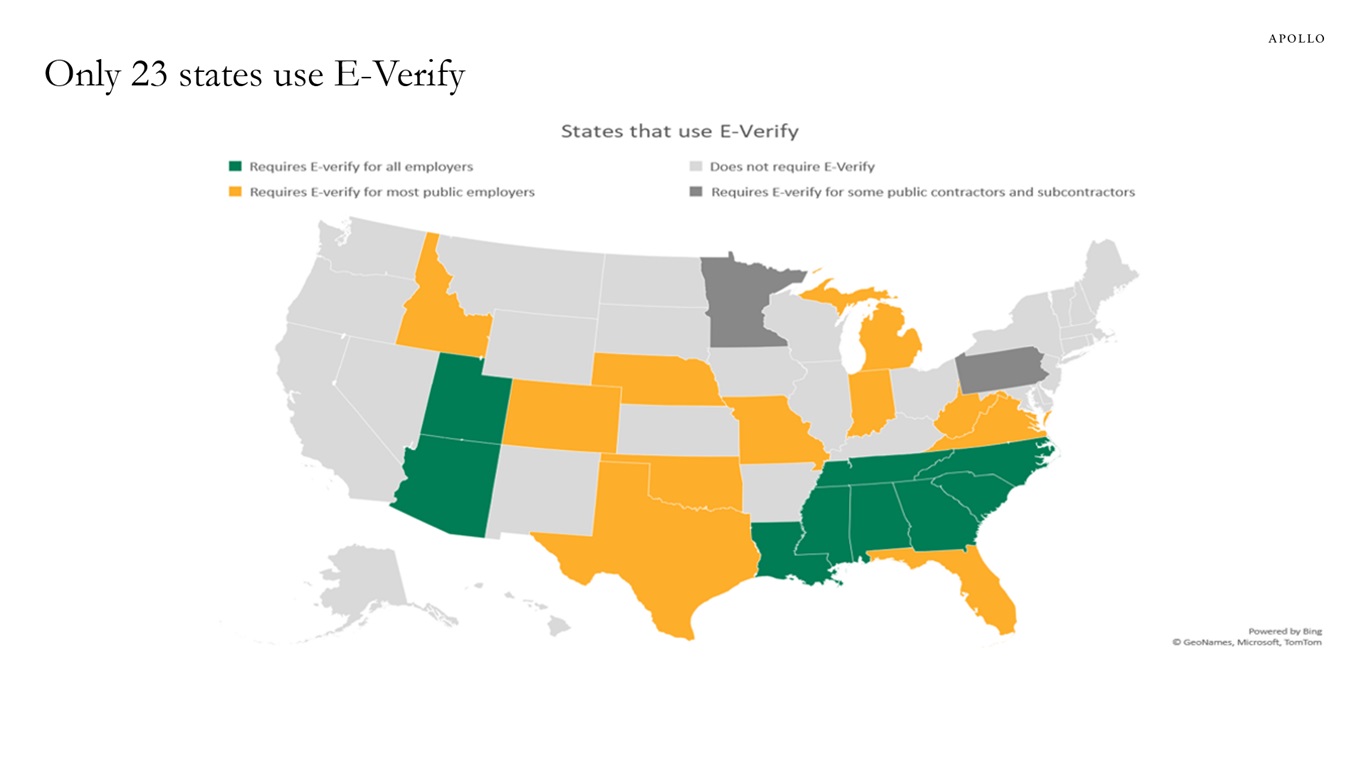
Note: E-Verify is a voluntary internet-based program to help employers verify the work authorization of all new hires. The program is administered by the US Department of Homeland Security in partnership with the Social Security Administration. Currently, 23 states require the use of E-Verify for at least some public and/or private employers. Source: NCSL, Apollo Chief Economist 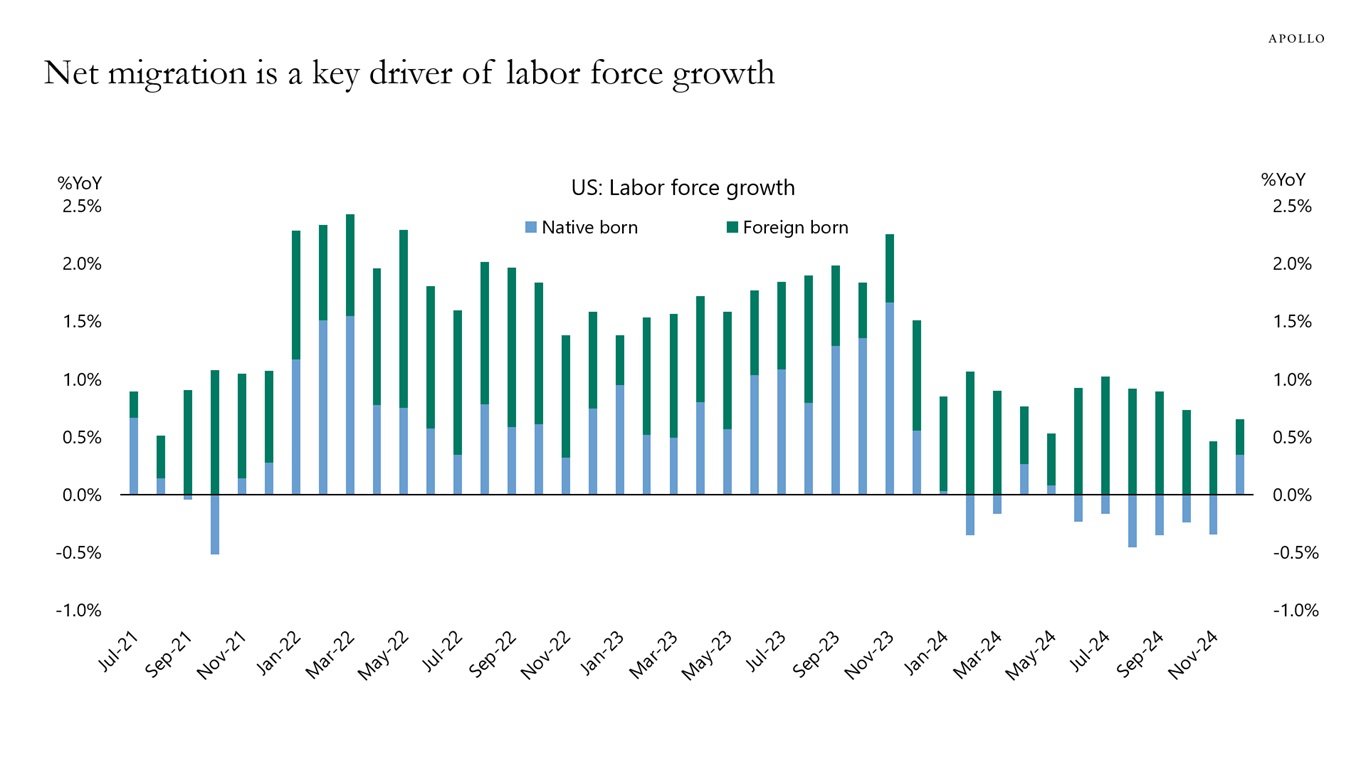
Source: BLS, Haver Analytics, Apollo Chief Economist 
See important disclaimers at the bottom of the page.
-
The incoming data shows that weekly same-store retail sales are strong, daily debit card spending data is strong, daily TSA air travel data is strong, the JOLTS layoff rate is very low, WARN notices are low, jobless claims are low, and announced job cuts are very low.
Combined with the latest Atlanta Fed GDP estimate at 3.0% and a boost coming to growth and inflation because of the Fed cutting interest rates since September and higher animal spirits since the election, the bottom line is that the US economy is entering 2025 with some really strong tailwinds, and the market is underestimating the risk that the Fed will have to hike interest rates later this year.
Our chart book with daily and weekly indicators for the US economy is available here.
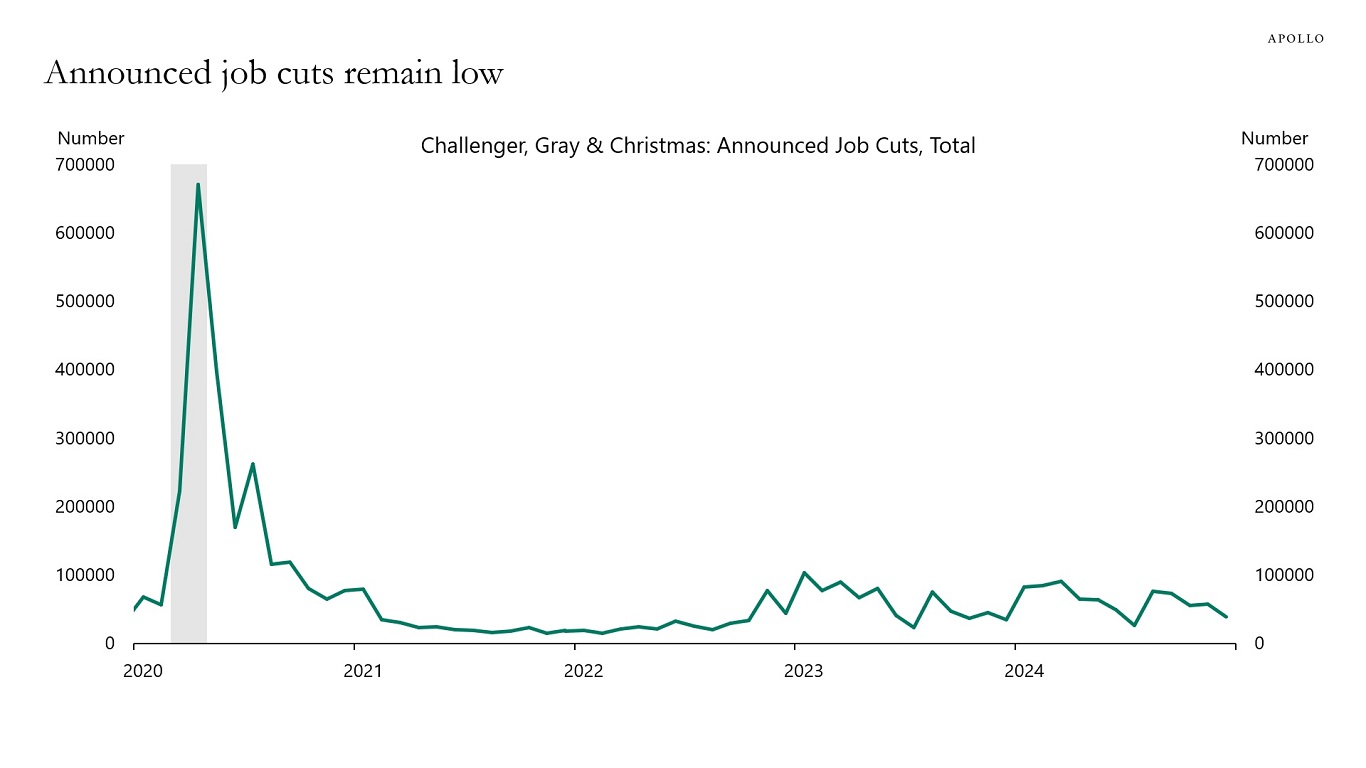
Source: Challenger, Gray & Christmas, Haver Analytics, Apollo Chief Economist 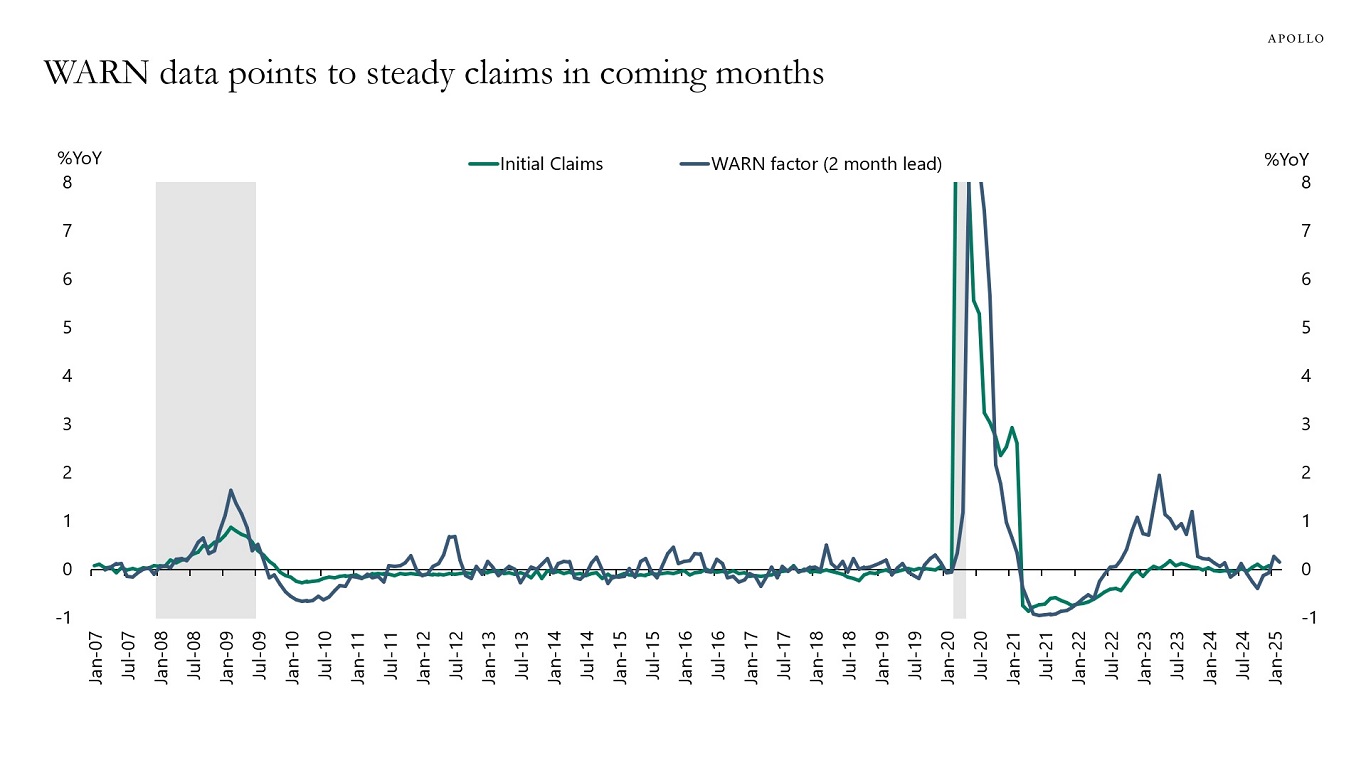
Note: The Worker Adjustment and Retraining Notification (WARN) Act helps ensure 60 to 90 days advance notice in cases of qualified plant closings and mass layoffs. WARN factor is the Cleveland Fed estimate for WARN notices. Source: Department of Labor, Haver Analytics, Federal Reserve Bank of Cleveland, Apollo Chief Economist 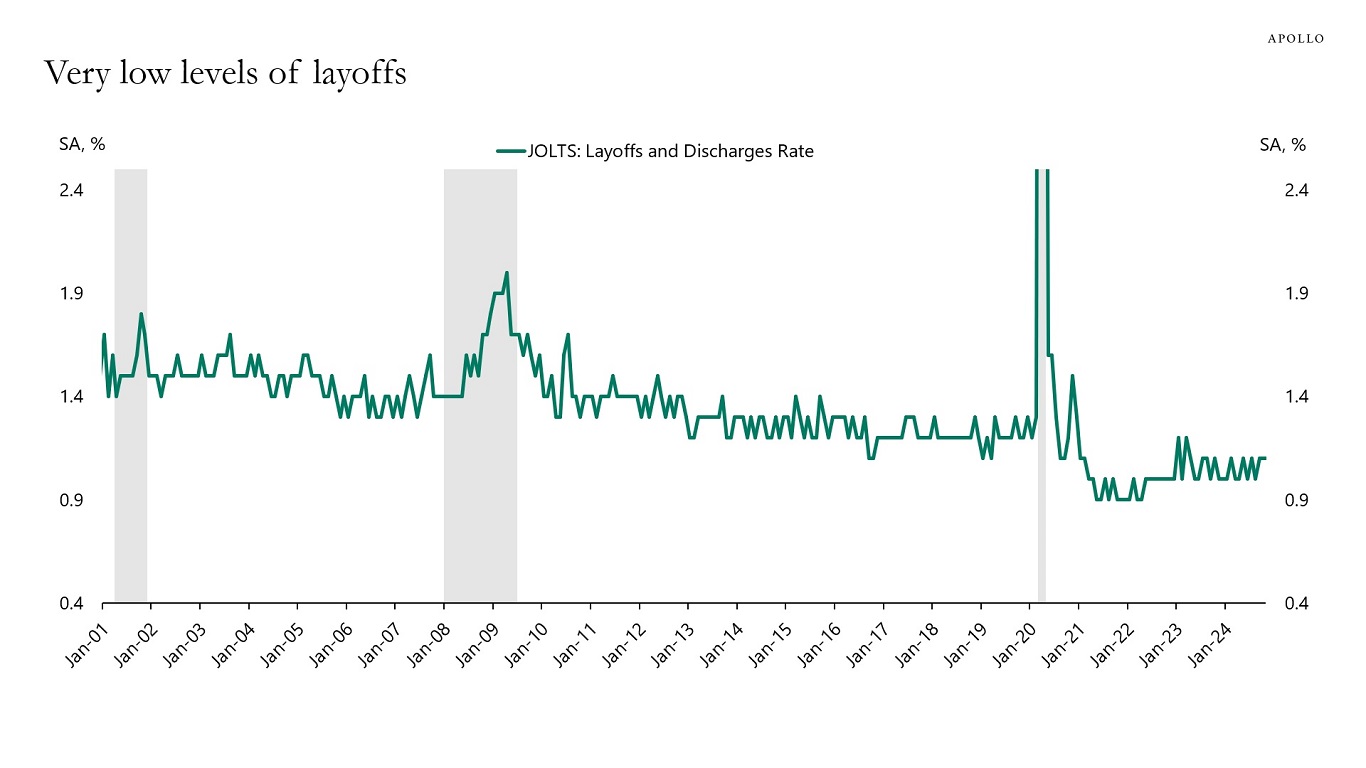
Source: BLS, Haver Analytics, Apollo Chief Economist 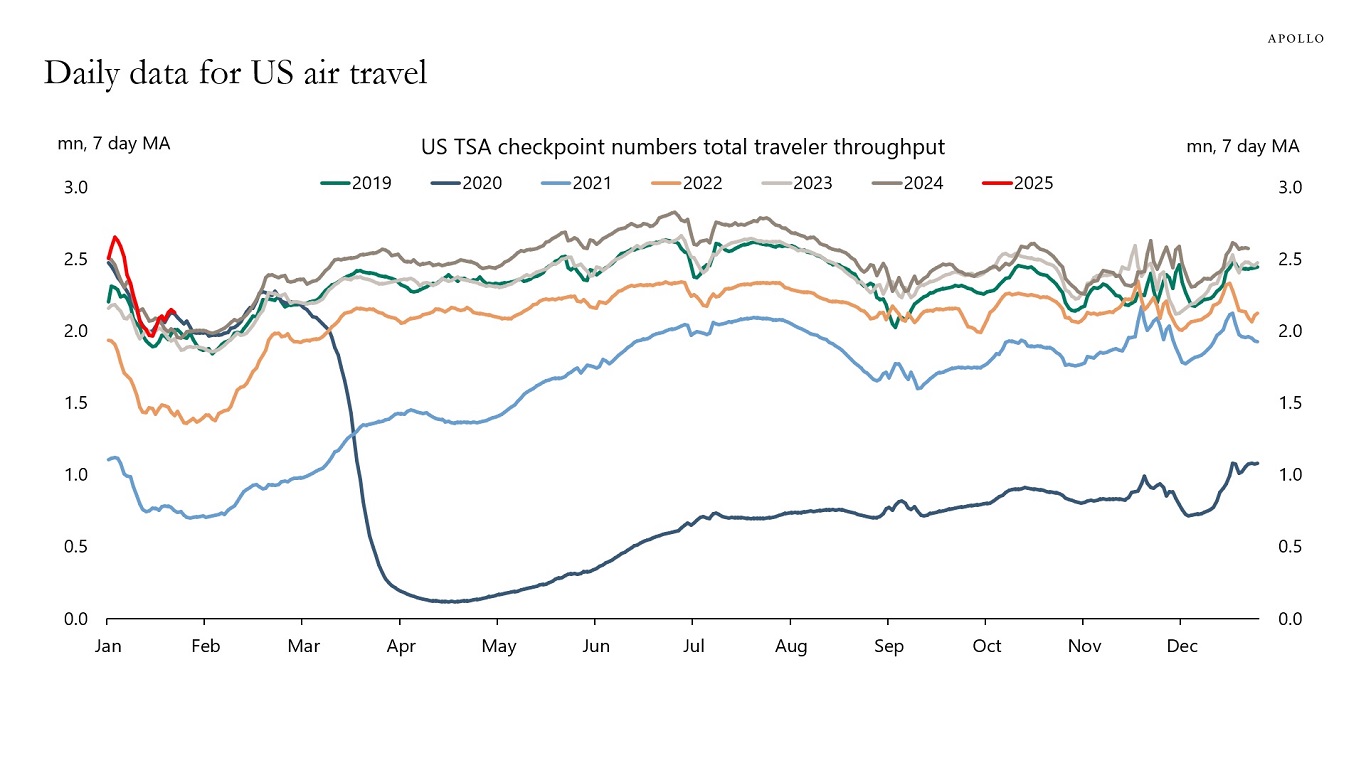
Source: TSA, Bloomberg, Apollo Chief Economist 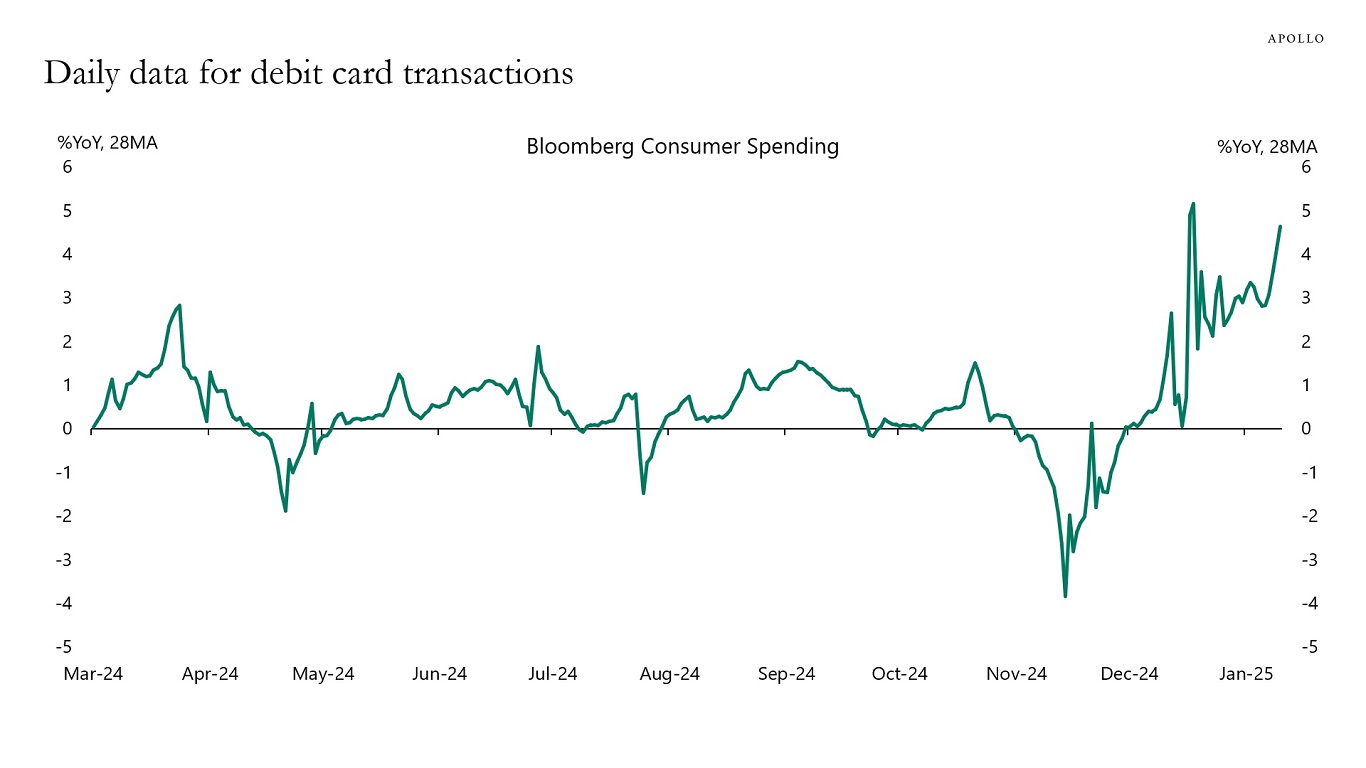
Note: Consists largely of debit card transactions. Source: Bloomberg, Apollo Chief Economist 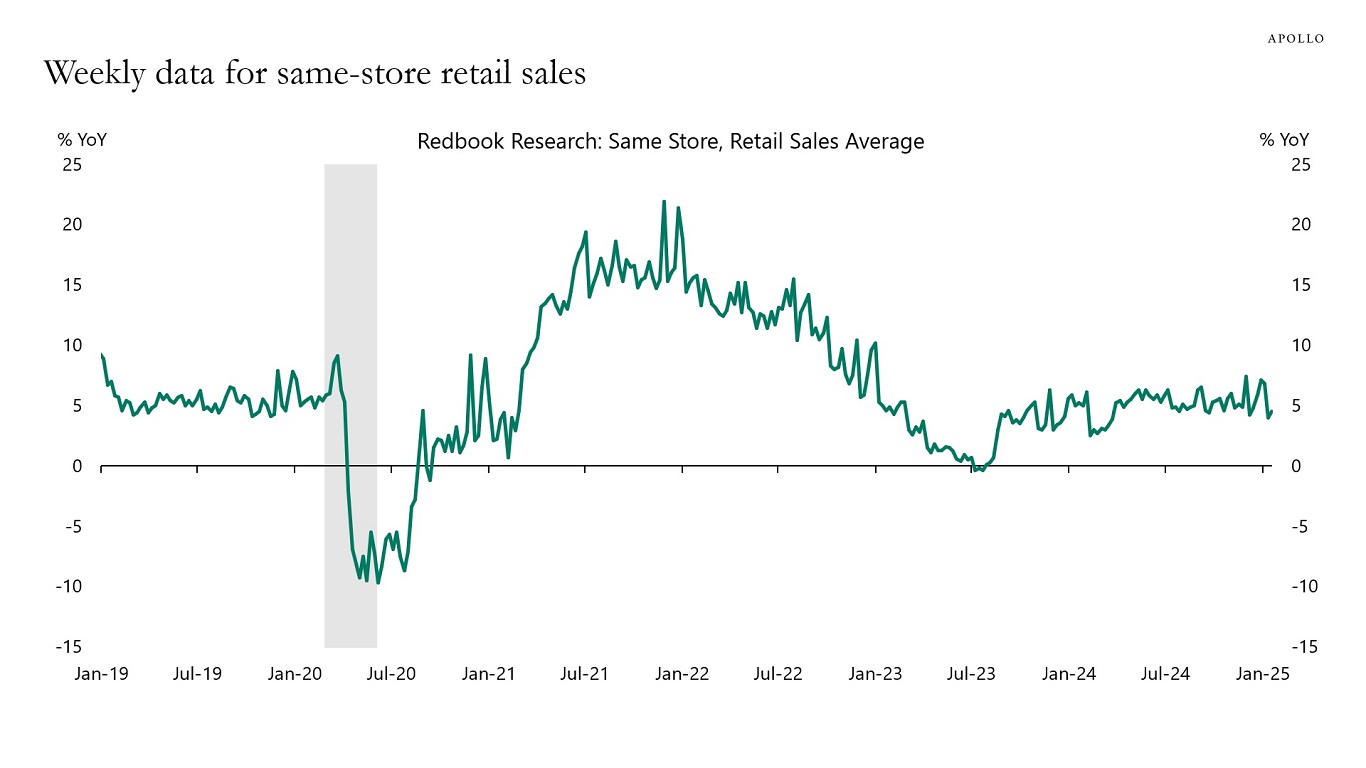
Source: Redbook, Haver Analytics, Apollo Chief Economist 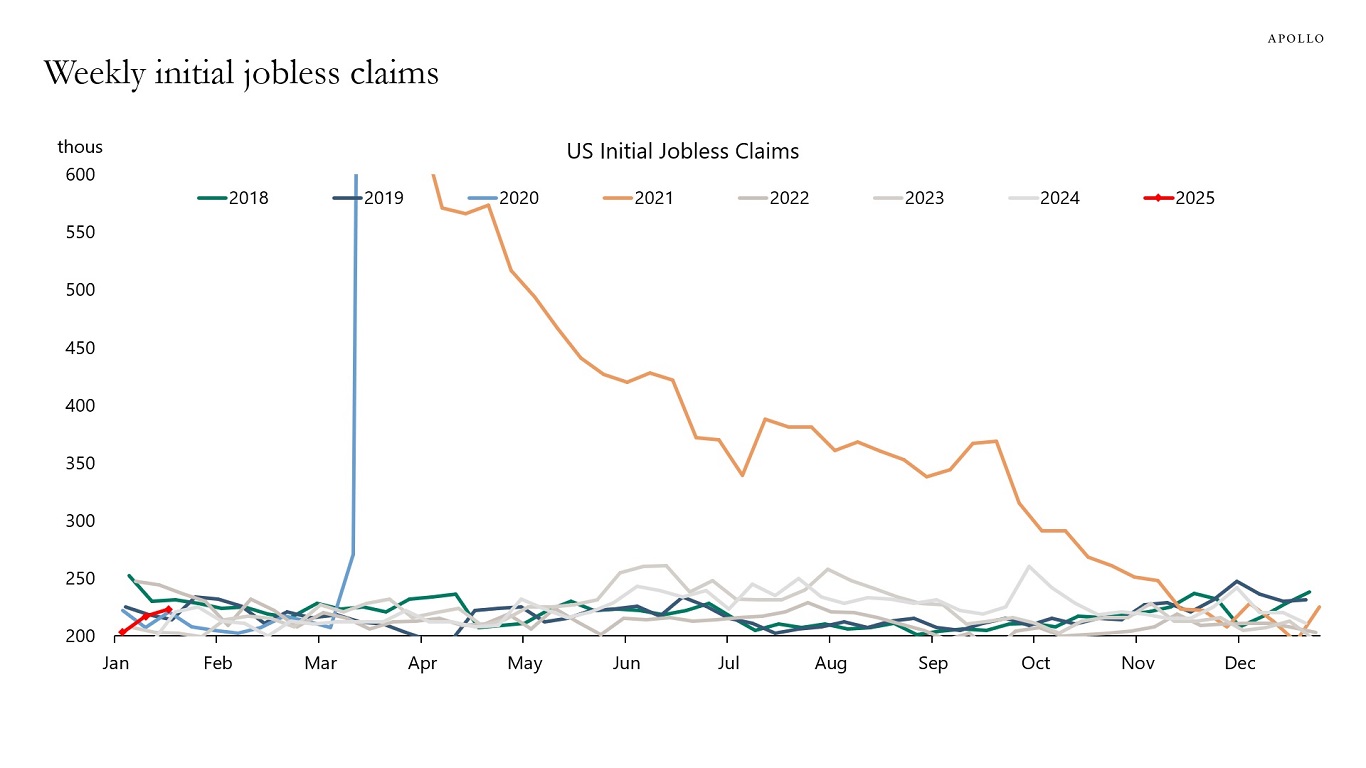
Note: Some data not shown in chart due to significant variances in scale. Source: US Department of Labor, Apollo Chief Economist 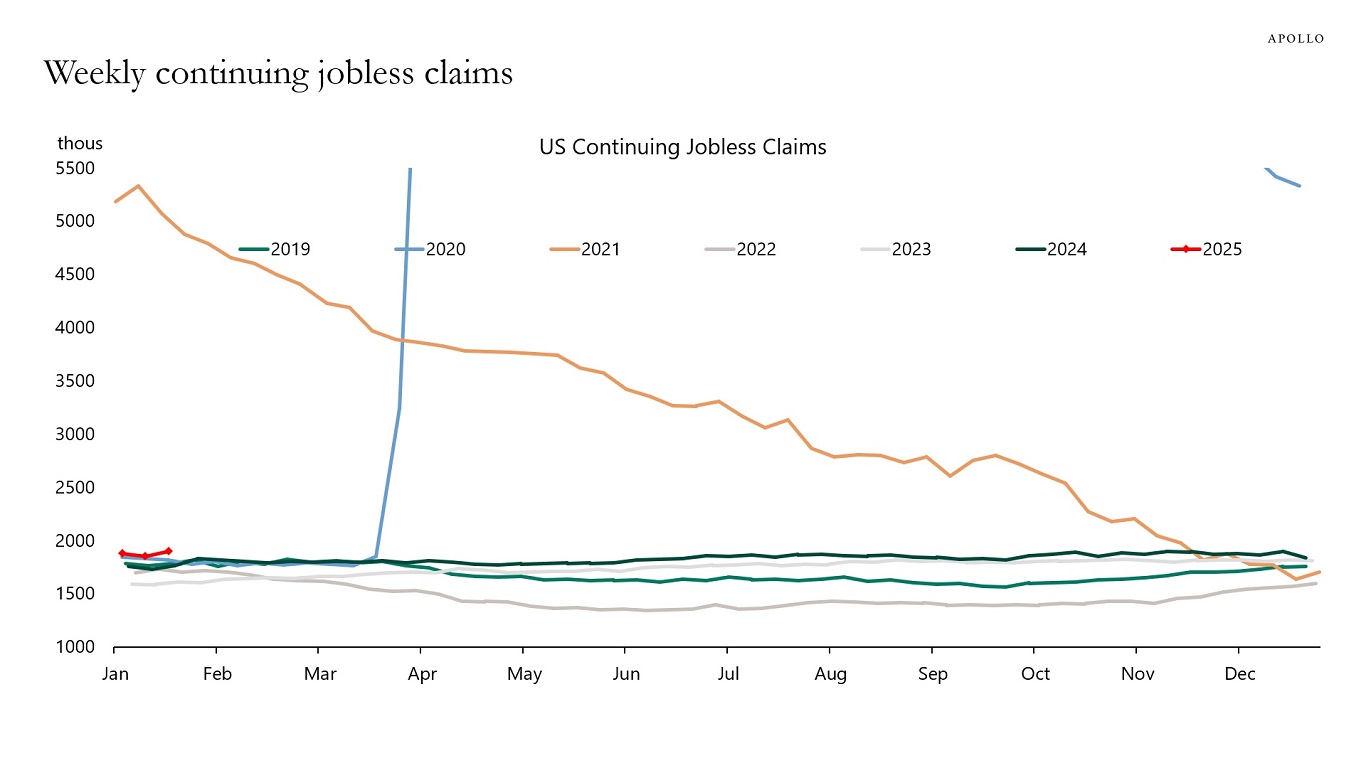
Note: Some data not shown in chart due to significant variances in scale. Source: US Department of Labor, Apollo Chief Economist 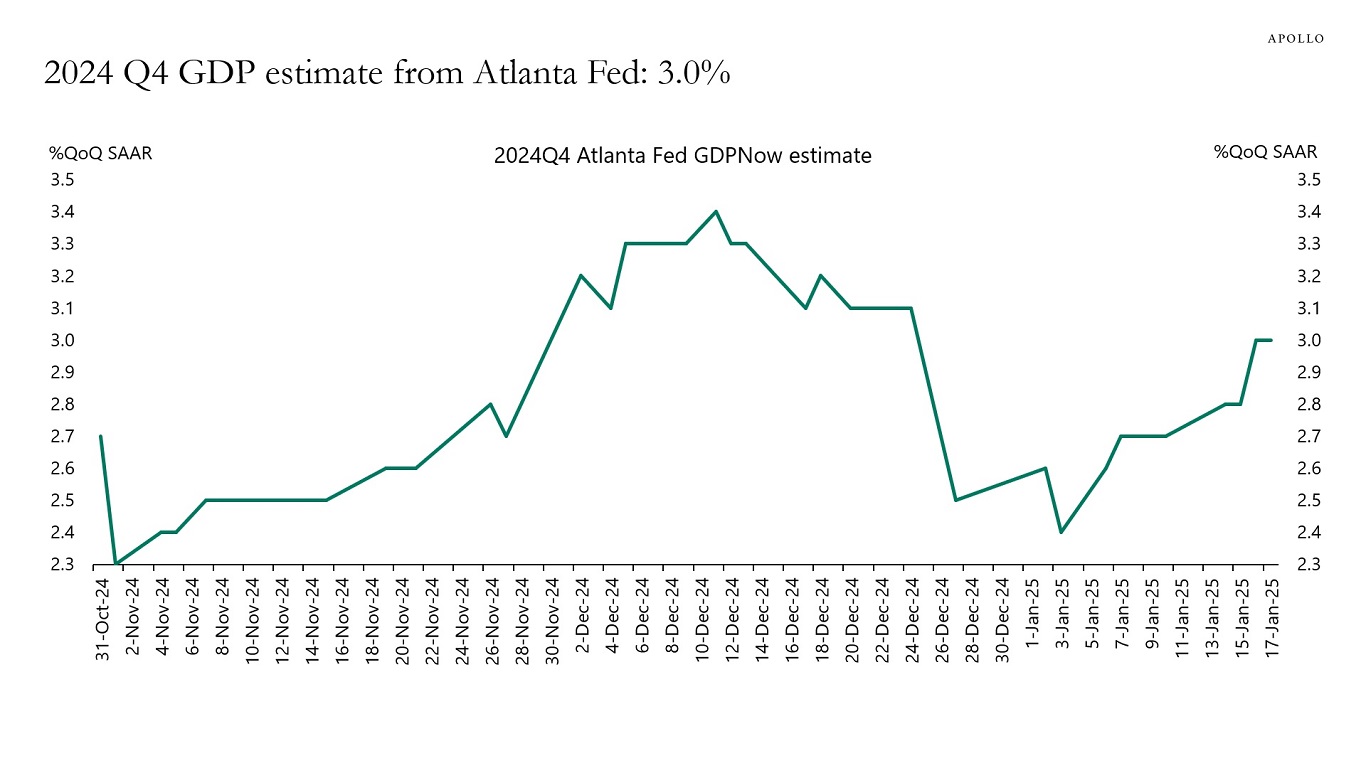
Source: Federal Reserve Bank of Atlanta, Haver Analytics Apollo Chief Economist 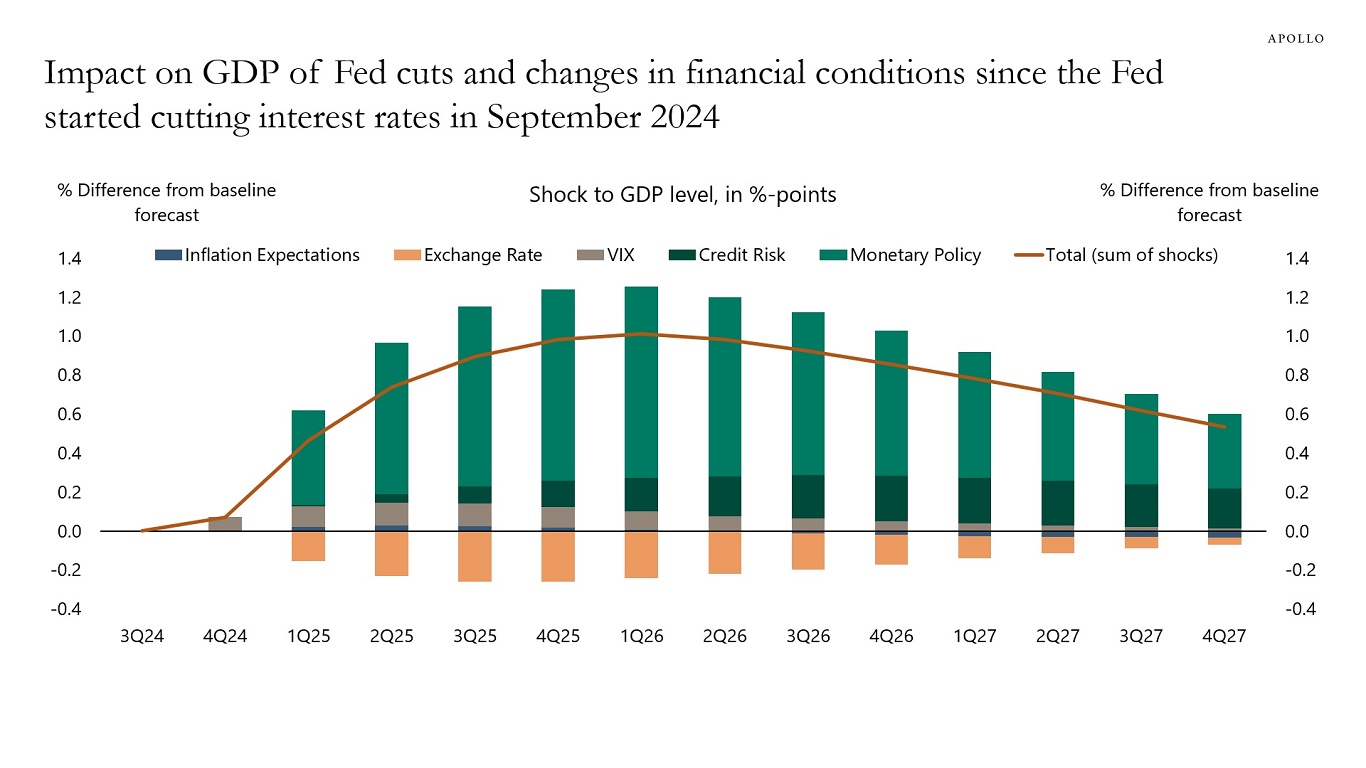
Note: The following shocks are applied to Q4 2024: A 0.2%-point rise in inflation expectations, 7% appreciation in the exchange rate, 0.5 standard deviation fall in VIX, 30 bps tightening of credit spreads, -100 bps rate cuts and -50 bps forward guidance. Source: Bloomberg SHOK model, Apollo Chief Economist 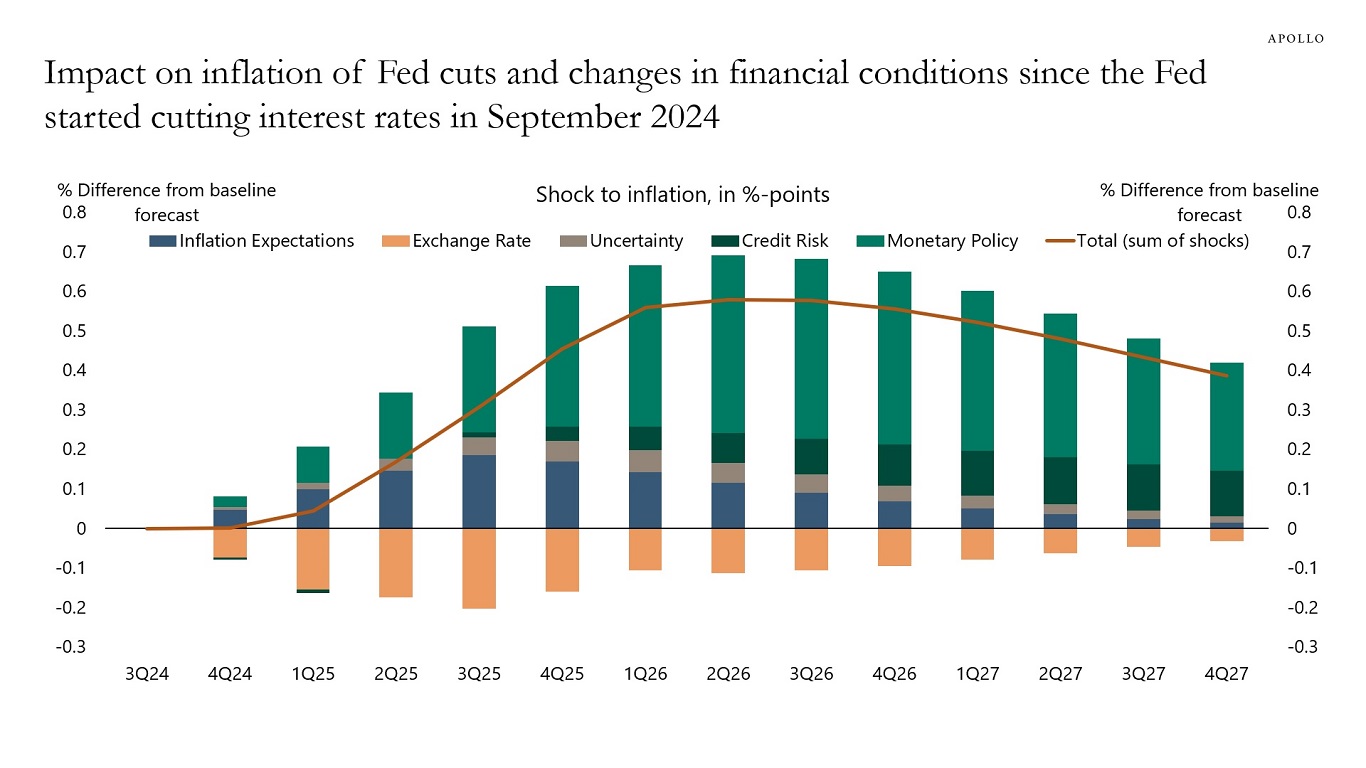
Note: The following shocks are applied to Q4 2024: A 0.2%-point rise in inflation expectations, 7% appreciation in the exchange rate, 0.5 standard deviation fall in VIX, 30 bps tightening of credit spreads, -100 bps rate cuts and -50 bps forward guidance. Source: Bloomberg SHOK model, Apollo Chief Economist See important disclaimers at the bottom of the page.
-
Household inflation expectations have shifted completely after the election, see the chart below.
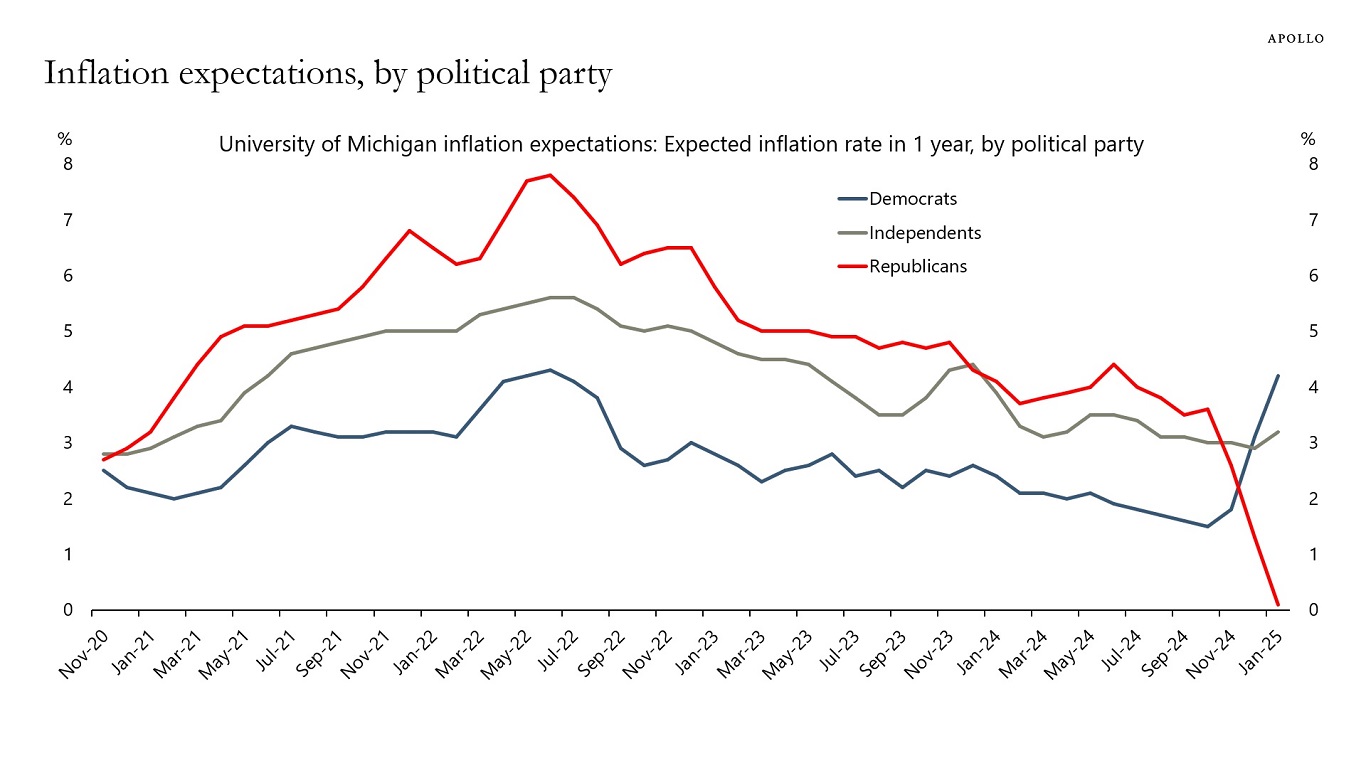
Source: University of Michigan, Bloomberg, Apollo Chief Economist See important disclaimers at the bottom of the page.

This presentation may not be distributed, transmitted or otherwise communicated to others in whole or in part without the express consent of Apollo Global Management, Inc. (together with its subsidiaries, “Apollo”).
Apollo makes no representation or warranty, expressed or implied, with respect to the accuracy, reasonableness, or completeness of any of the statements made during this presentation, including, but not limited to, statements obtained from third parties. Opinions, estimates and projections constitute the current judgment of the speaker as of the date indicated. They do not necessarily reflect the views and opinions of Apollo and are subject to change at any time without notice. Apollo does not have any responsibility to update this presentation to account for such changes. There can be no assurance that any trends discussed during this presentation will continue.
Statements made throughout this presentation are not intended to provide, and should not be relied upon for, accounting, legal or tax advice and do not constitute an investment recommendation or investment advice. Investors should make an independent investigation of the information discussed during this presentation, including consulting their tax, legal, accounting or other advisors about such information. Apollo does not act for you and is not responsible for providing you with the protections afforded to its clients. This presentation does not constitute an offer to sell, or the solicitation of an offer to buy, any security, product or service, including interest in any investment product or fund or account managed or advised by Apollo.
Certain statements made throughout this presentation may be “forward-looking” in nature. Due to various risks and uncertainties, actual events or results may differ materially from those reflected or contemplated in such forward-looking information. As such, undue reliance should not be placed on such statements. Forward-looking statements may be identified by the use of terminology including, but not limited to, “may”, “will”, “should”, “expect”, “anticipate”, “target”, “project”, “estimate”, “intend”, “continue” or “believe” or the negatives thereof or other variations thereon or comparable terminology.