


Want it delivered daily to your inbox?
-
Student loan payments restarted on October 1. And the Census Household Pulse Survey for October shows a jump in the share of consumers saying they are having difficulties paying their household expenses, see chart below.
Looking at the Household Pulse Survey in detail shows that the difficulties with paying household expenses were concentrated among households with a college degree, making between $50,000 and $150,000, suggesting that restarting student loan payments is the source of increased financial stress for consumers.
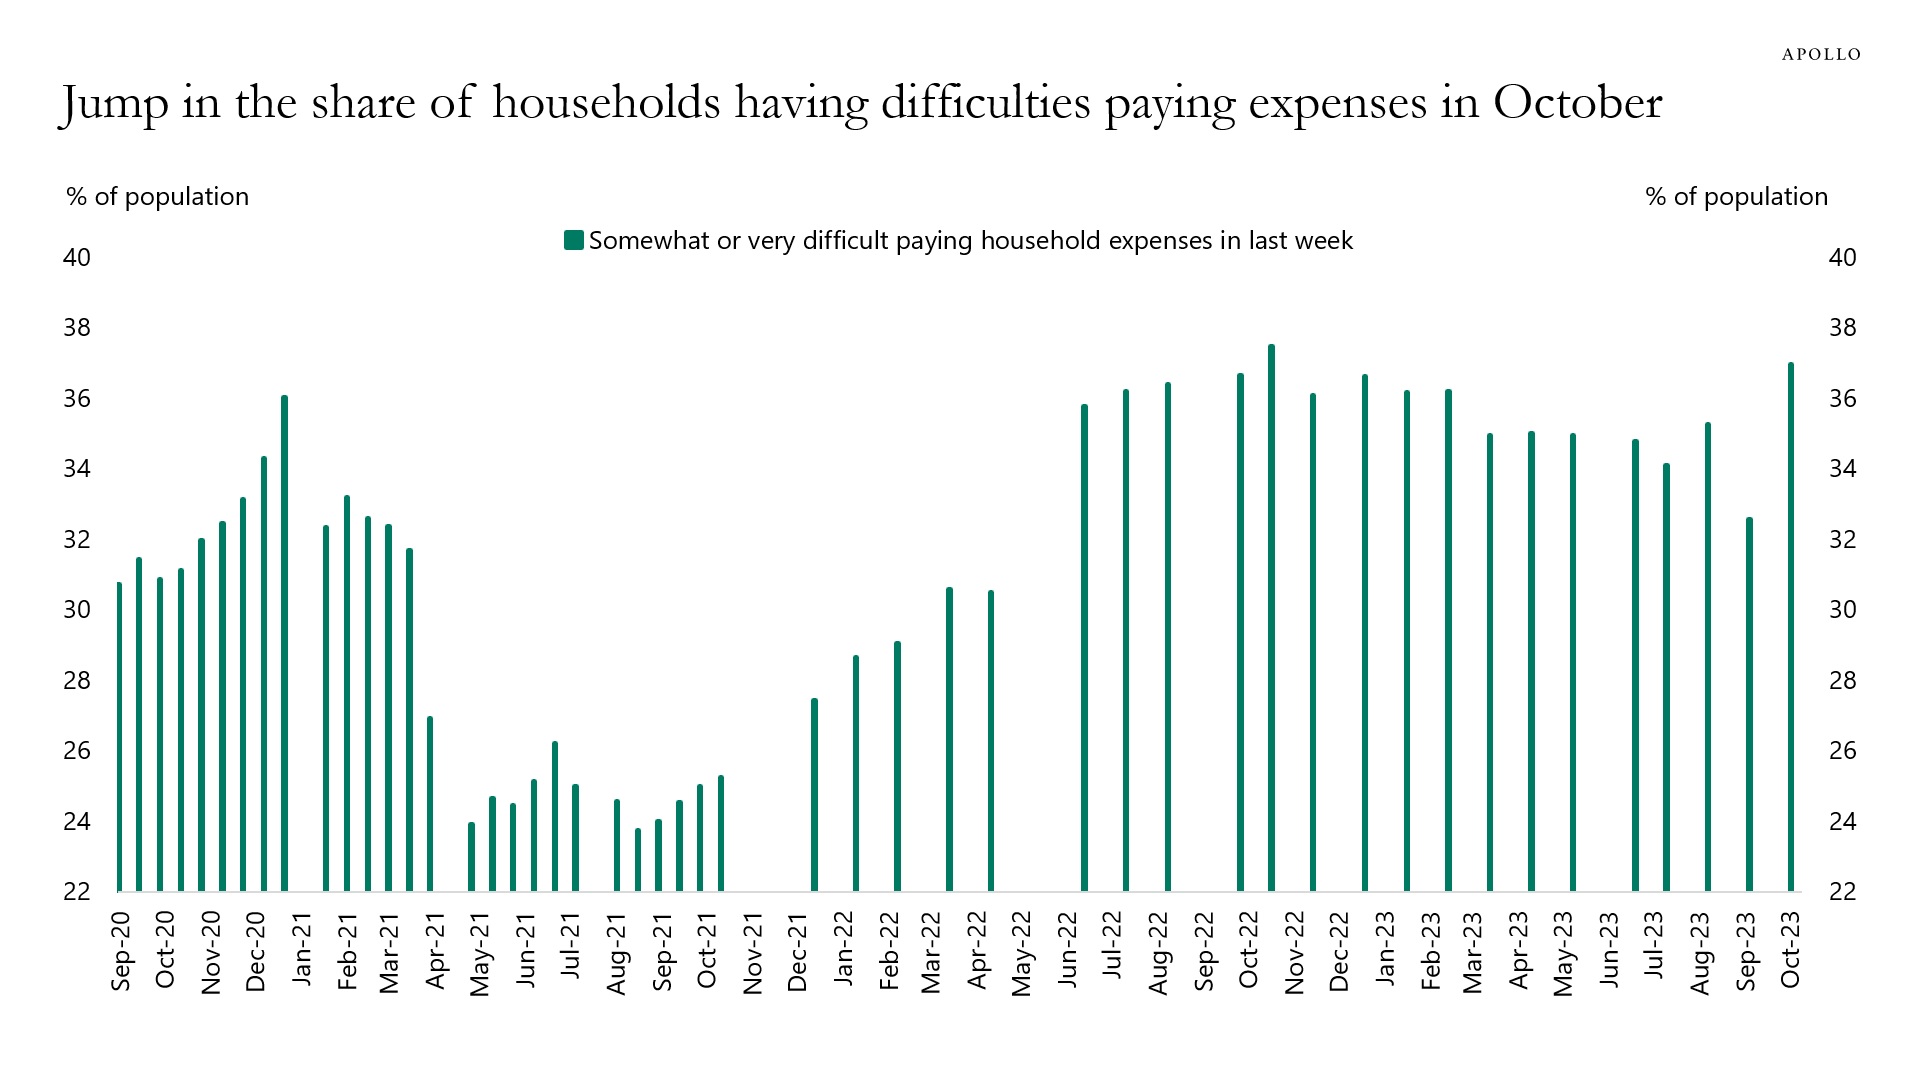
Source: Census Bureau, Apollo Chief Economist (Note: Household Pulse Survey) See important disclaimers at the bottom of the page.
-
There are 33 million small businesses in the US, and the monthly survey from the NFIB shows that small businesses are now paying 10% interest on short-term loans, see chart below.
In other words, Fed policy is working as the textbook would have predicted, and companies are facing higher costs of capital.
The outcome is lower capex spending and lower hiring.
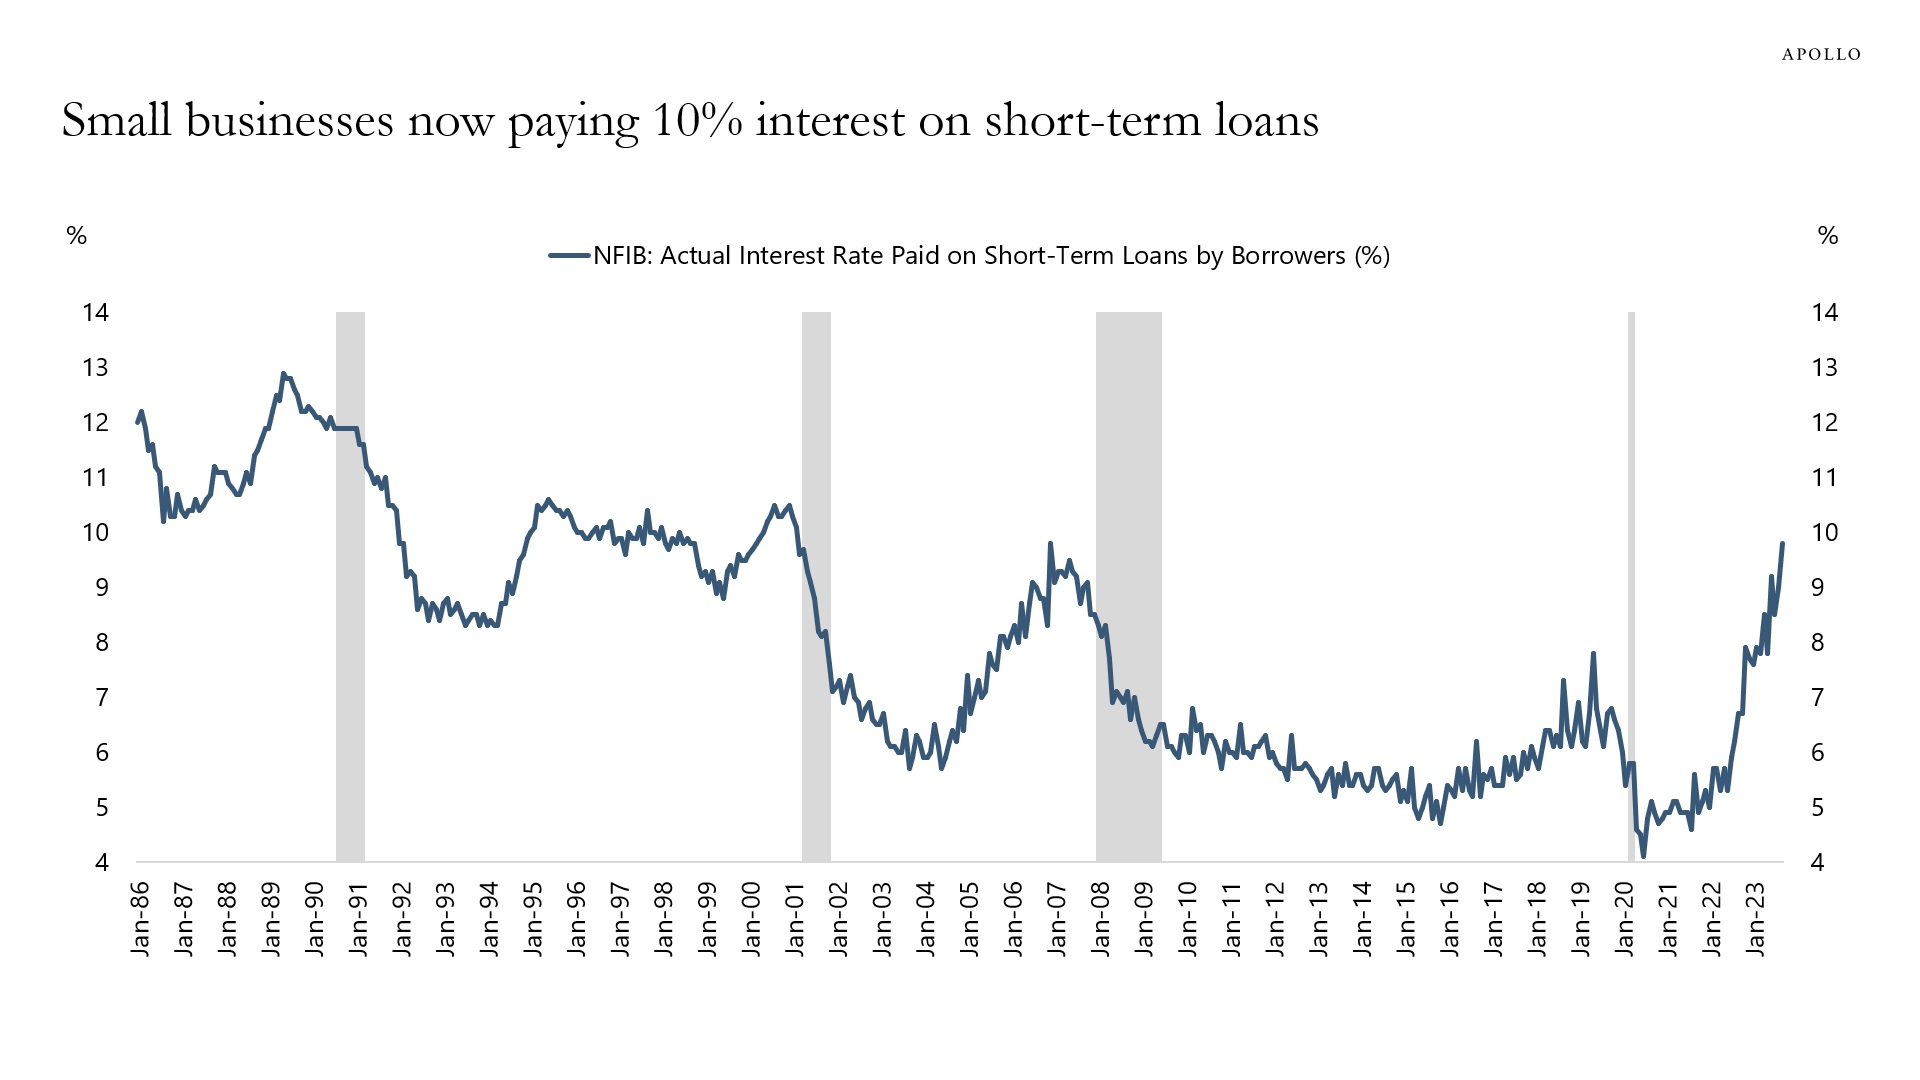
Source: NFIB, Haver Analytics, Apollo Chief Economist See important disclaimers at the bottom of the page.
-
It is more difficult to fire and hire workers in Europe, and the result is more rigid labor markets.
Combined with wages being more indexed to inflation, wage inflation is more sticky in Europe than in the US, see the first chart below.
Because of these structural features, the ECB has to remain hawkish even in a situation where the consensus is starting to see much weaker growth ahead in Europe, see the second chart.
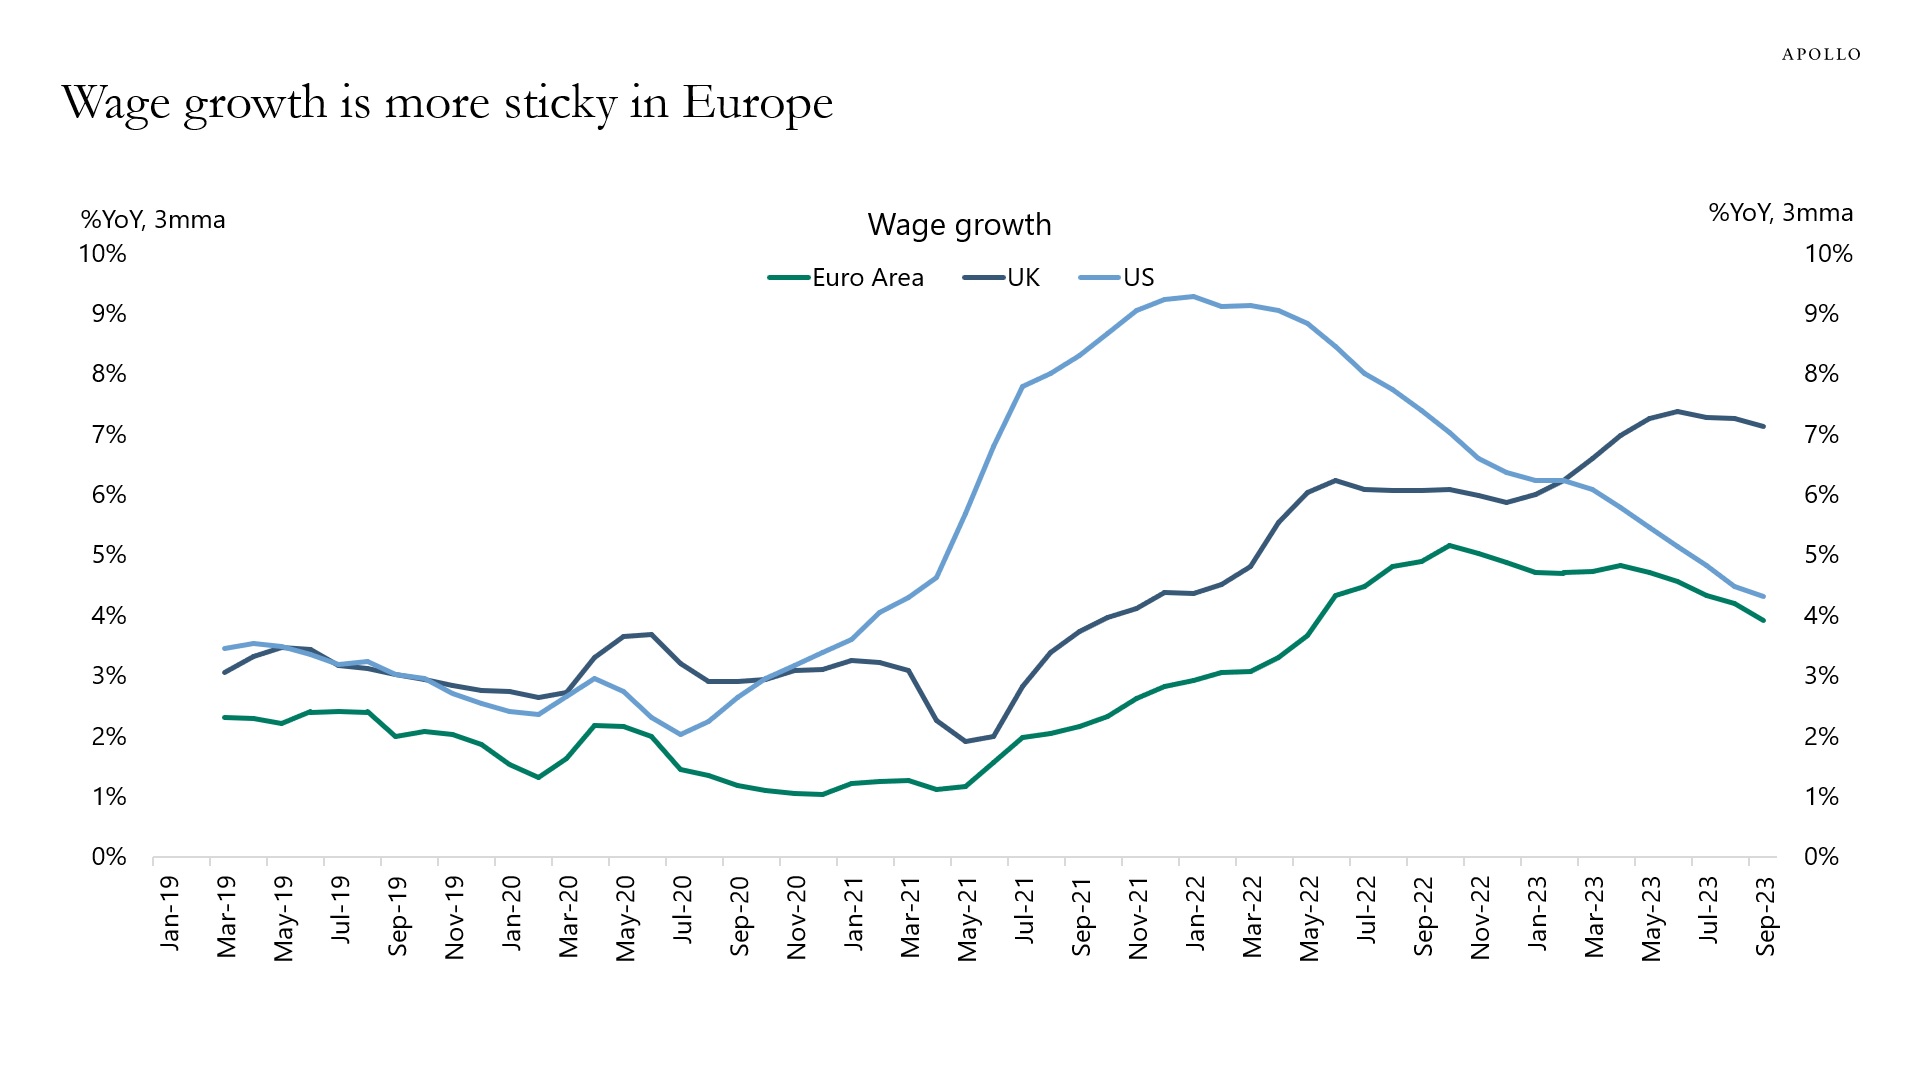
Source: Indeed wage growth tracker, Apollo Chief Economist 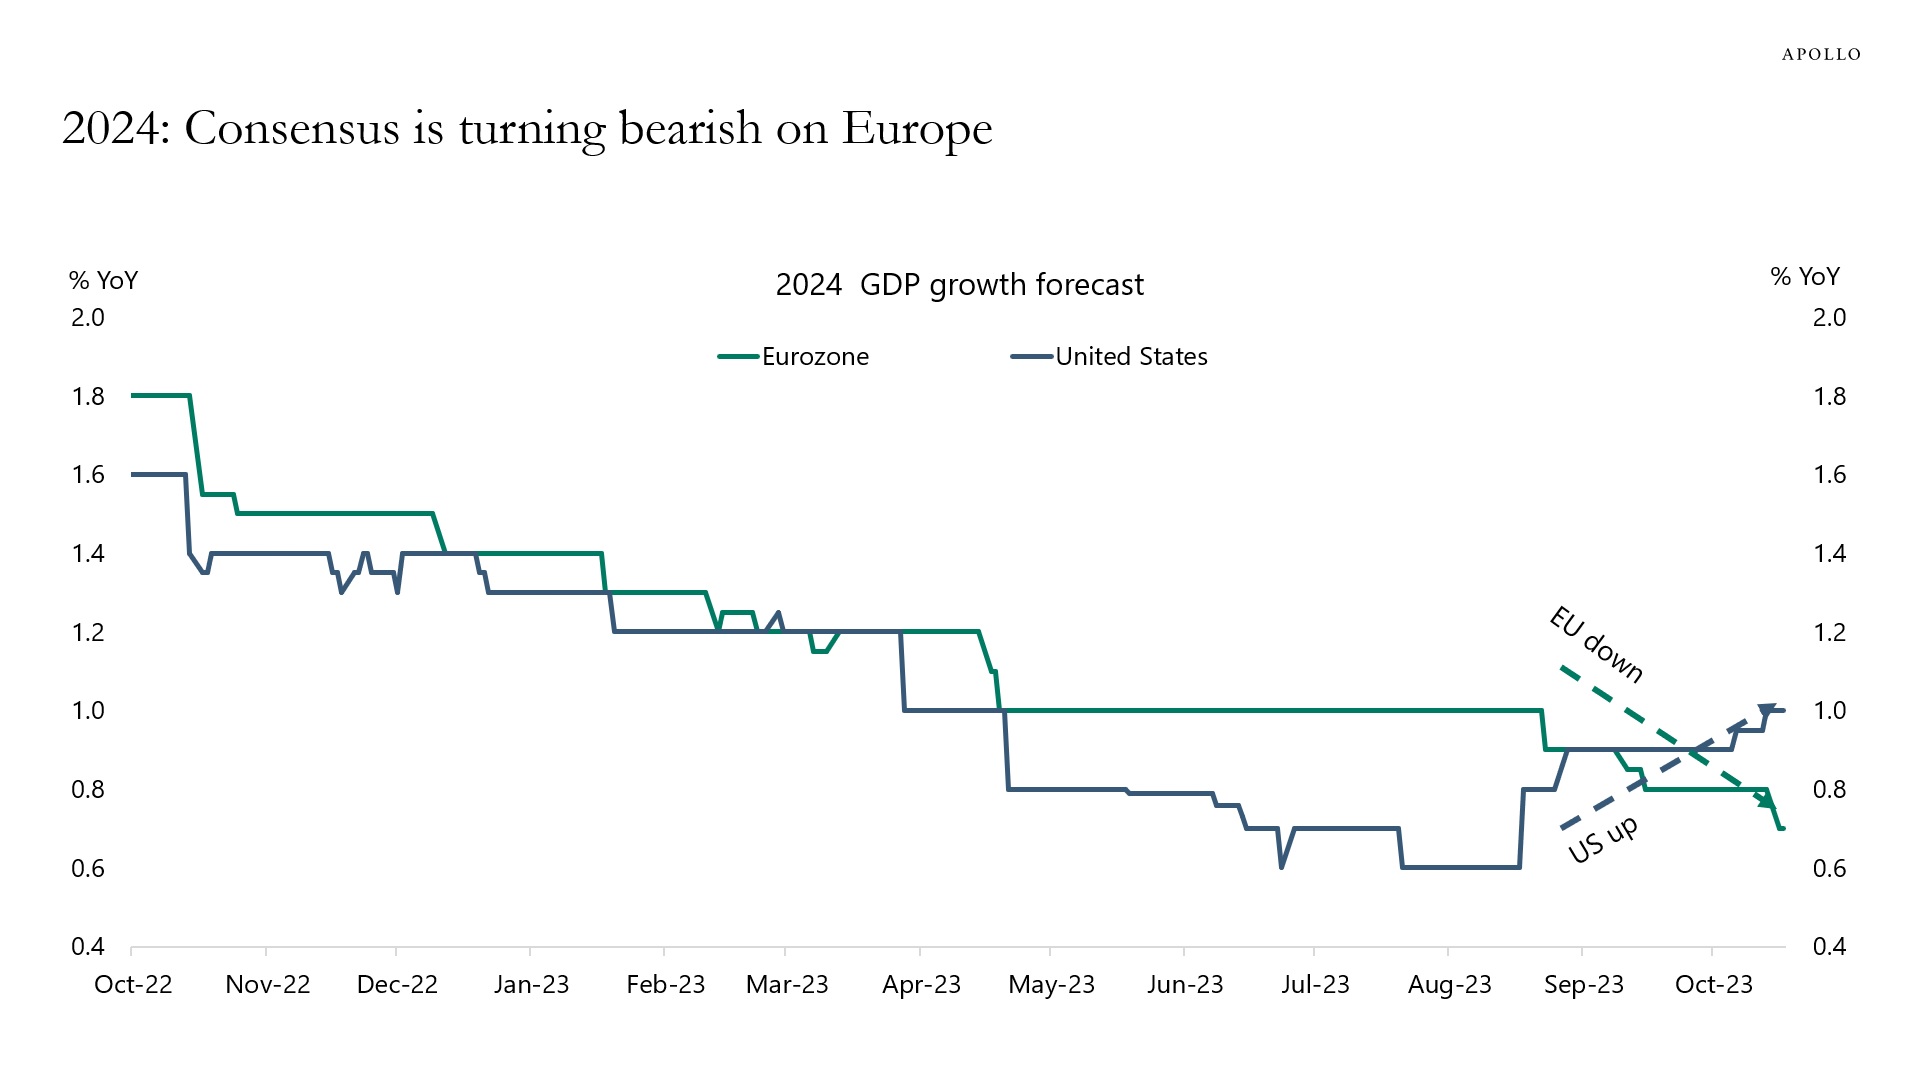
Source: Bloomberg, Apollo Chief Economist See important disclaimers at the bottom of the page.
-
Higher credit yields increase corporate capital costs.
And higher cost of capital puts pressure on coverage ratios and corporate profitability.
With lower coverage ratios and lower profitability, credit risks increase, and the result is that credit spreads should go wider.
That is, however, not what is happening at the moment. The current disconnect between credit yield levels and credit spreads is significant, see chart below.
Maybe what is happening today is similar to what happened from 2003 to 2007, when yield levels kept increasing and spreads stayed very tight, see again chart below. Only when the economic data started weakening did credit spreads begin to widen.
With the Fed trying to cool down the economy to fight inflation, the risks are that credit spreads will widen once the Fed succeeds with pushing the unemployment rate higher.
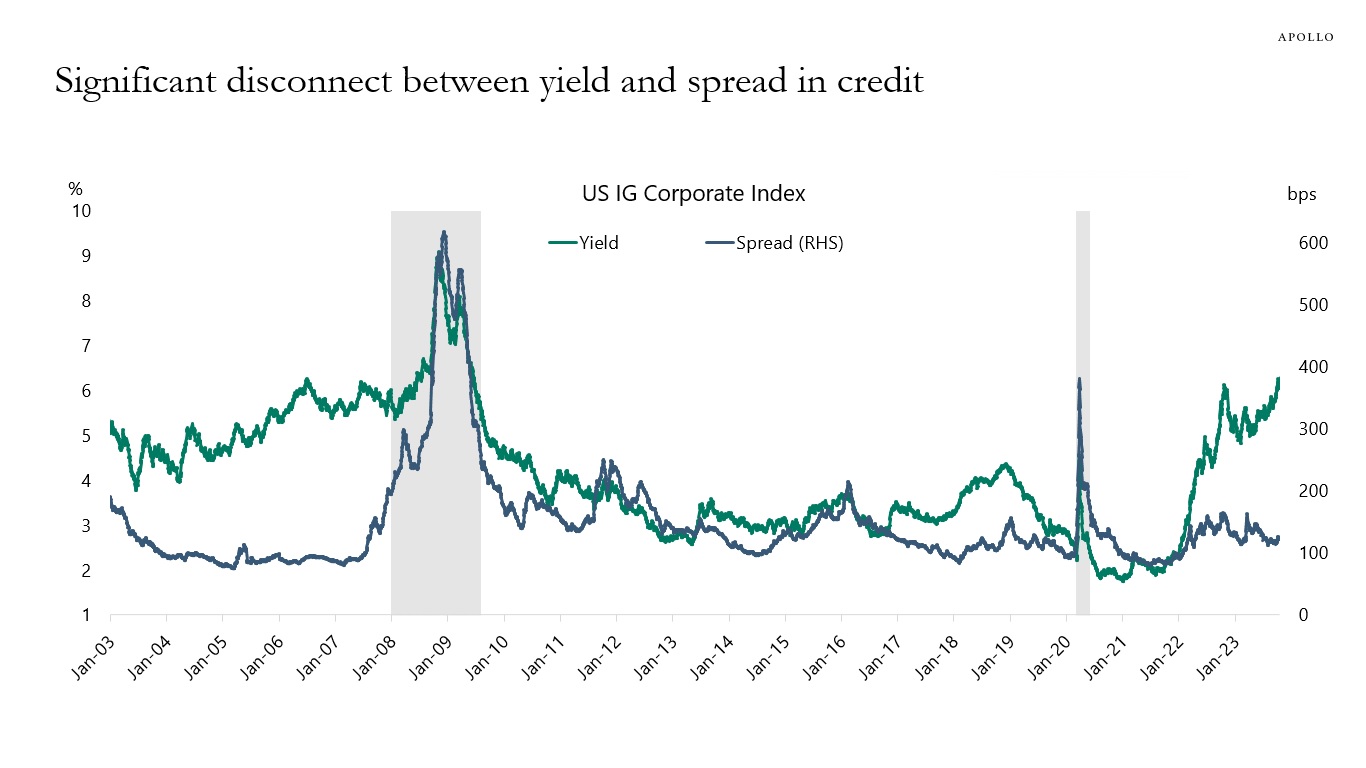
Source: Bloomberg, Apollo Chief Economist. Note: Index used is LUACTRUU Index. See important disclaimers at the bottom of the page.
-
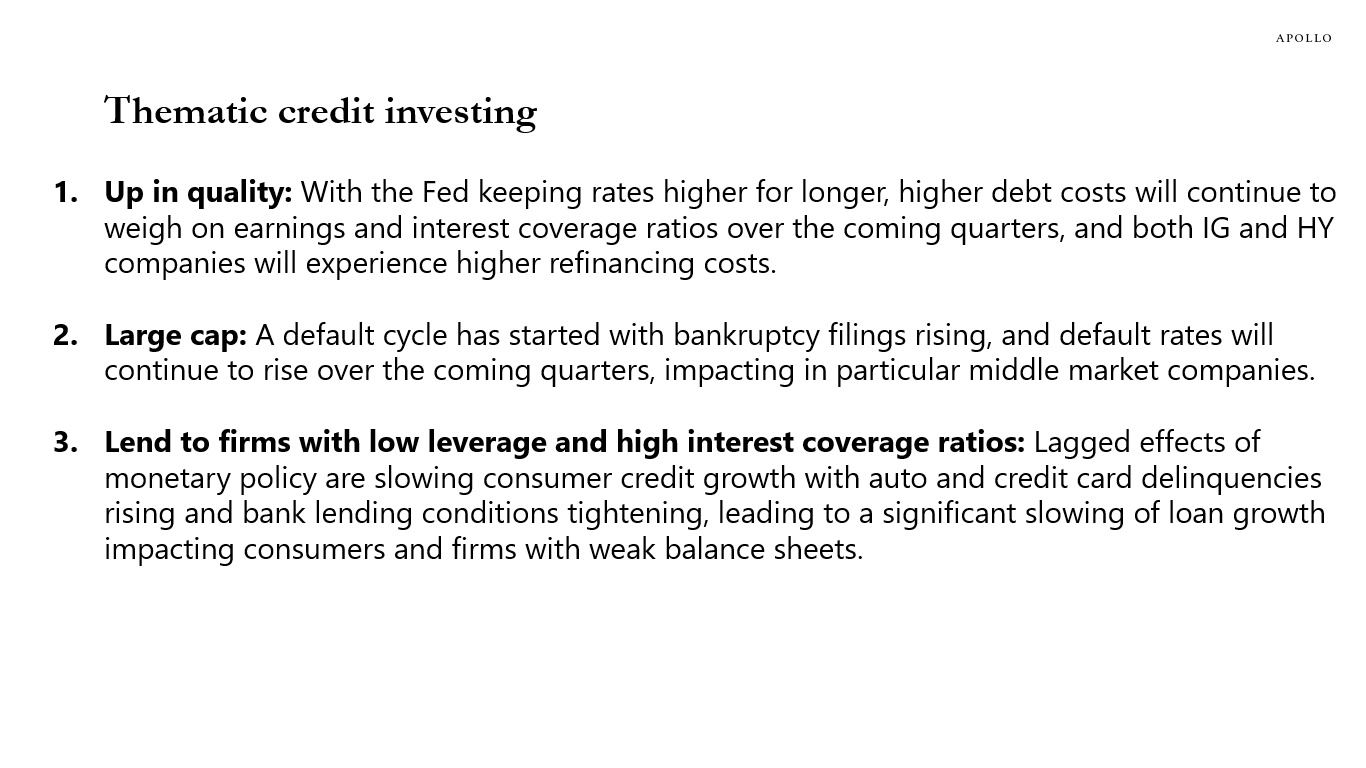
Our latest outlook for credit markets is available here, key charts inserted below.
Source: Apollo Chief Economist 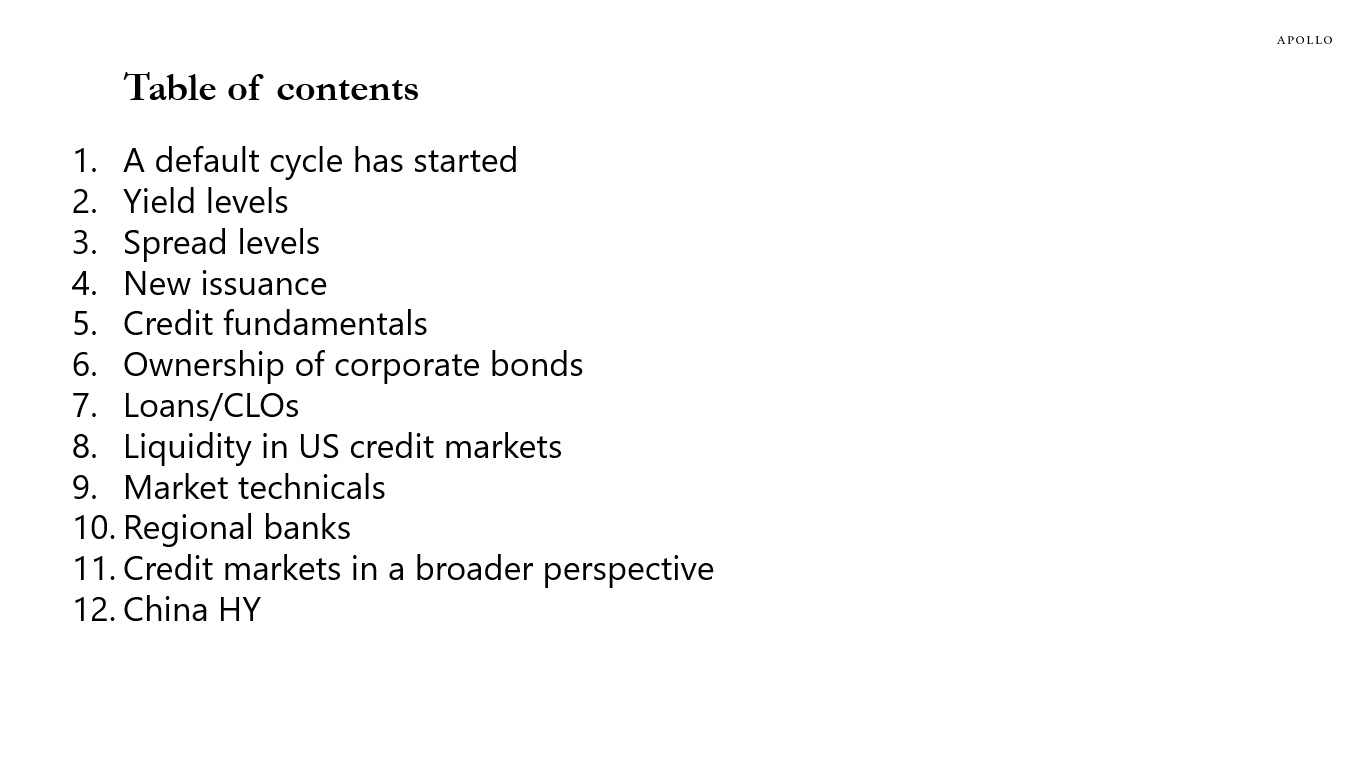
Source: Apollo Chief Economist 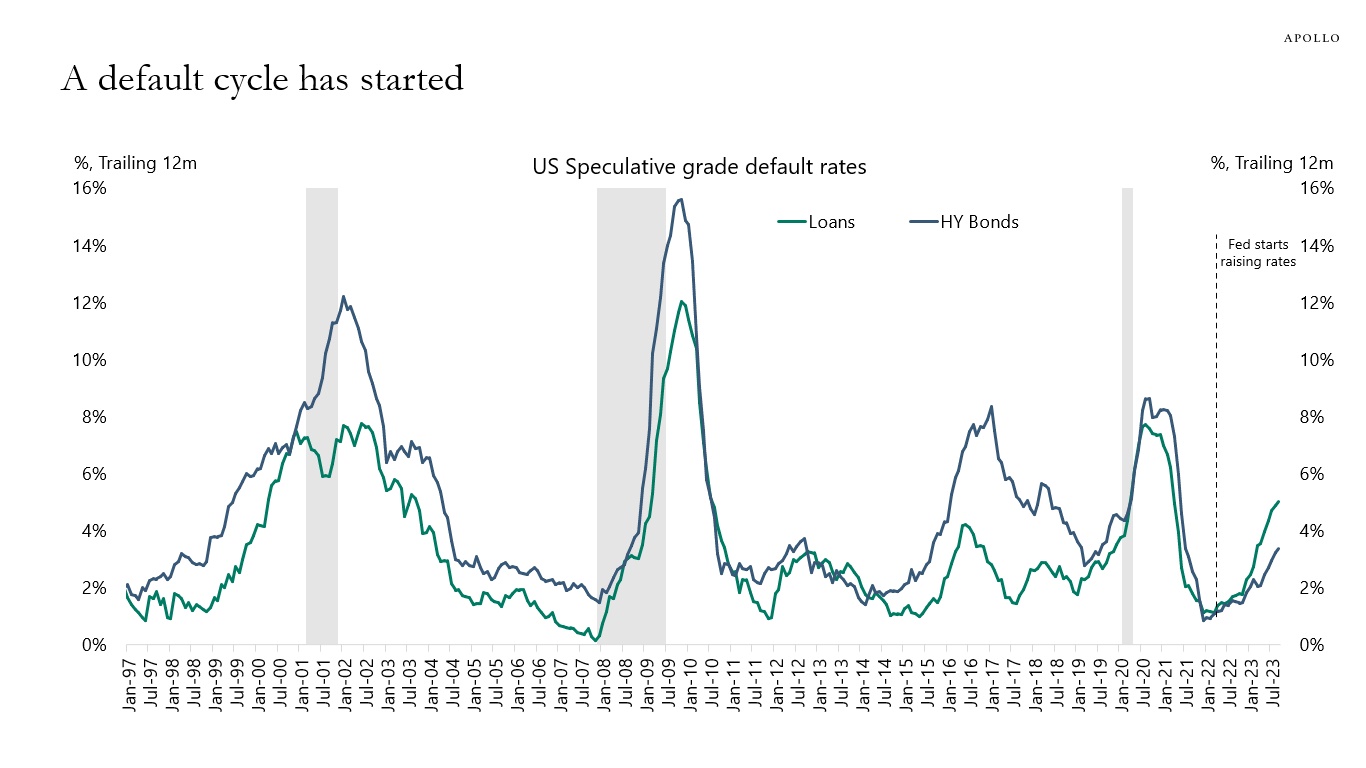
Source: Moody’s Analytics, Apollo Chief Economist 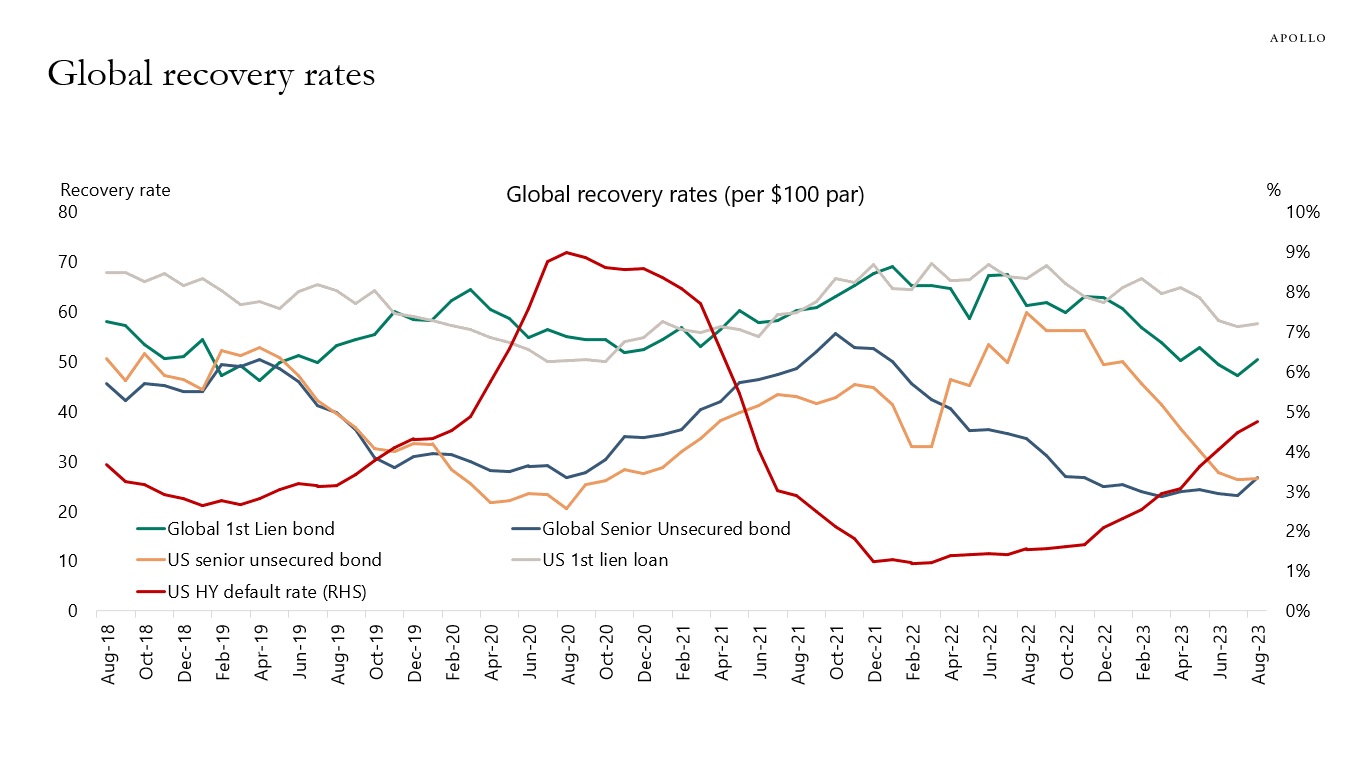
Source: Moody’s Analytics, Apollo Chief Economist 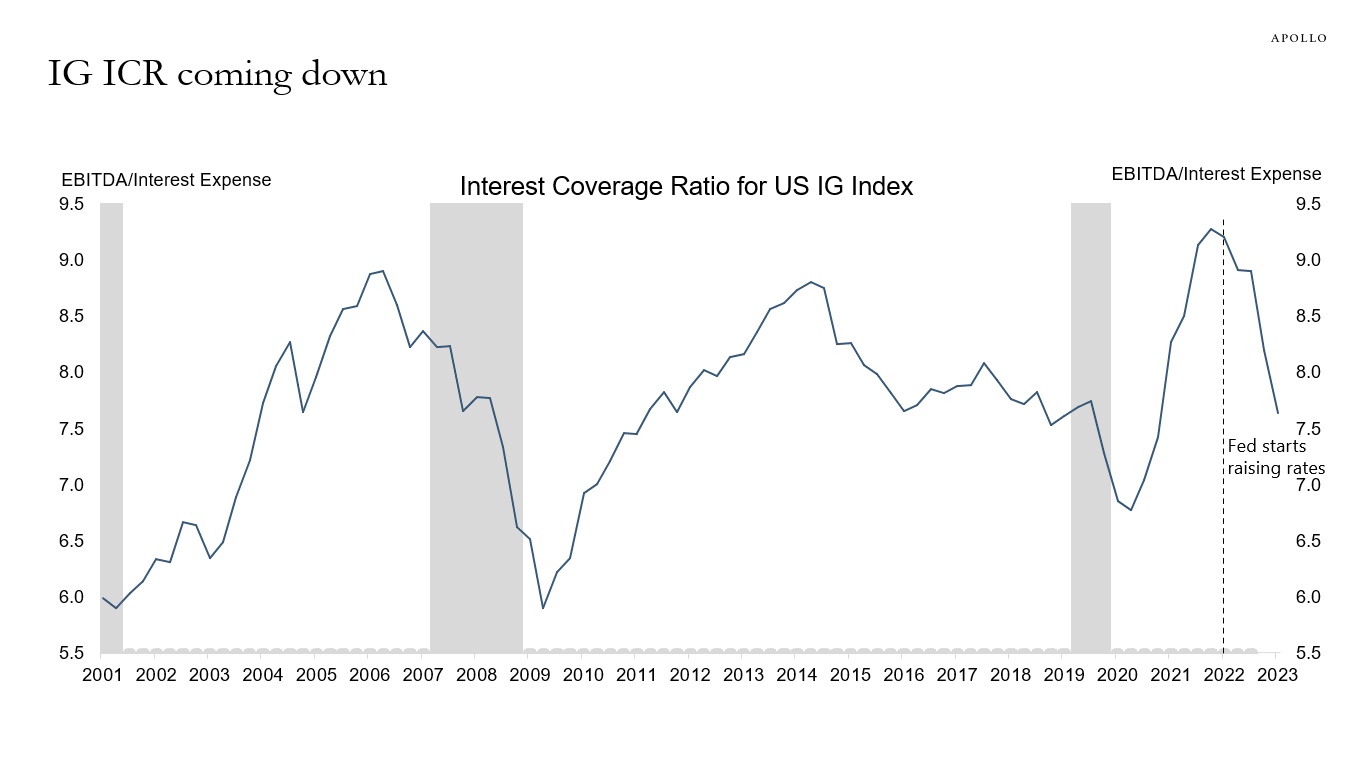
Source: Bloomberg, Apollo Chief Economist 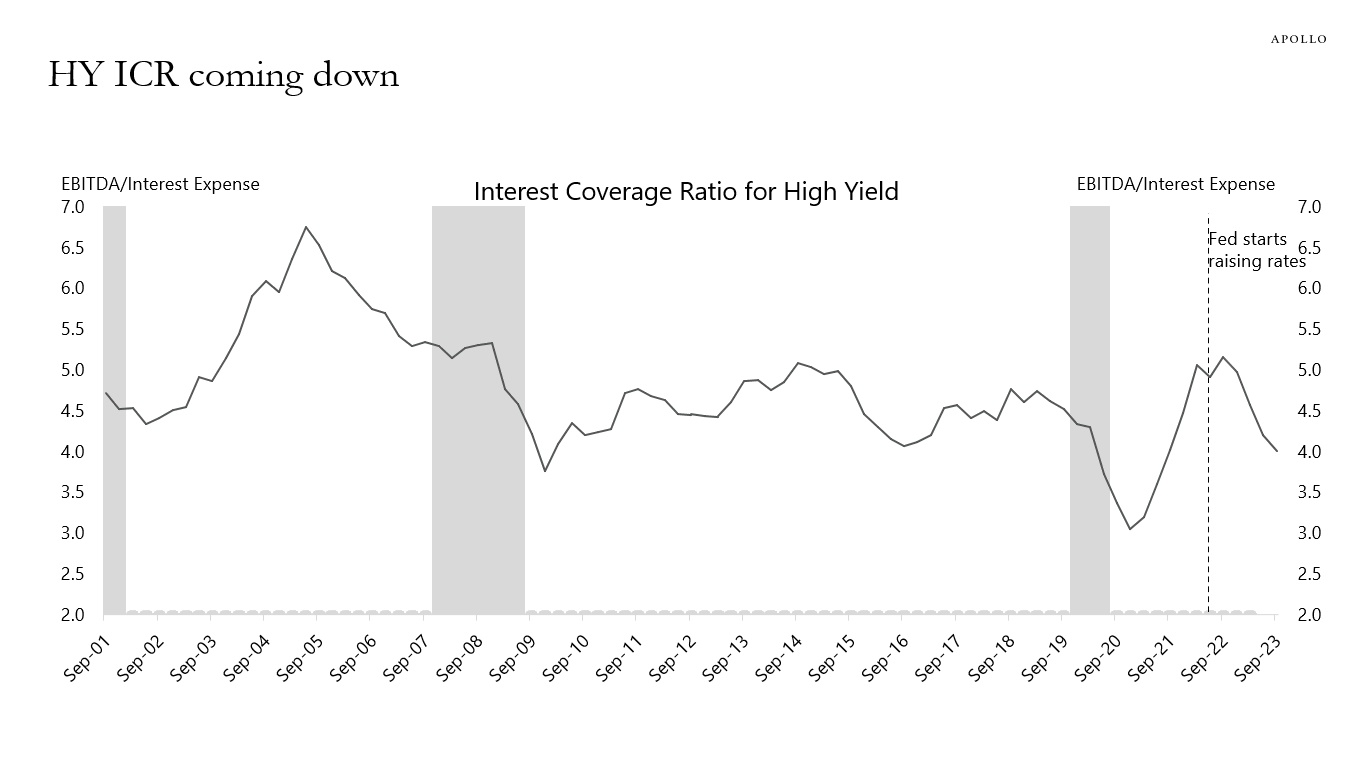
Source: Bloomberg, Apollo Chief Economist 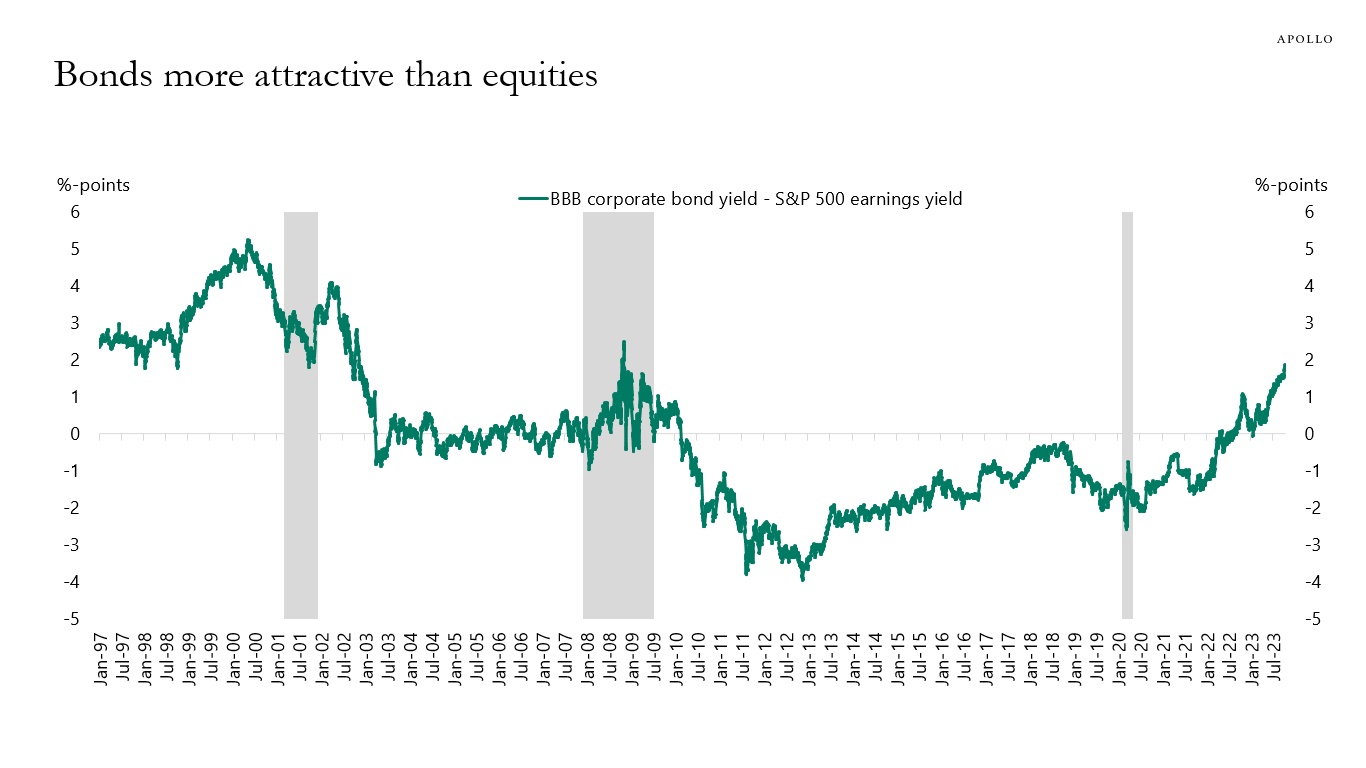
Source: Bloomberg, Apollo Chief Economist 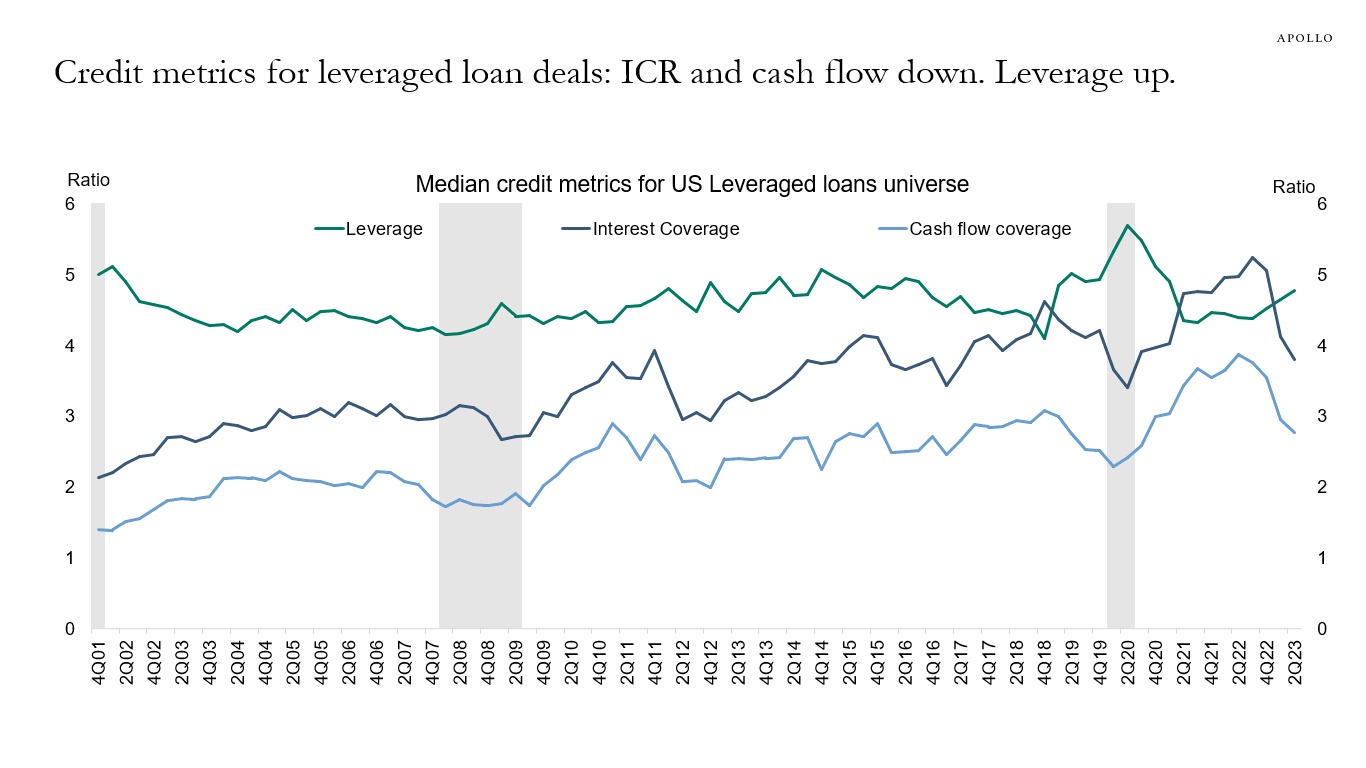
Source: Pitchbook LCD, Apollo Chief Economist 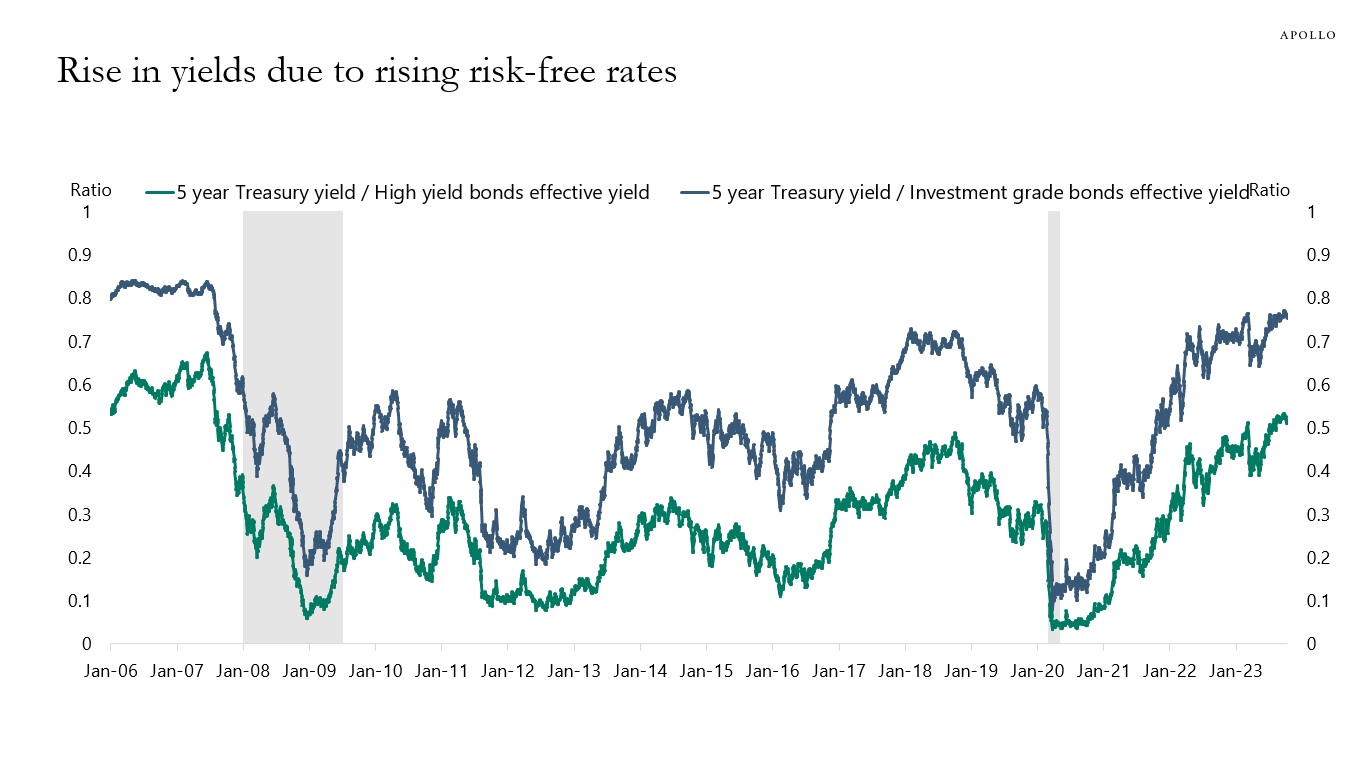
Source: ICE BofA, Haver Analytics, Apollo Chief Economist 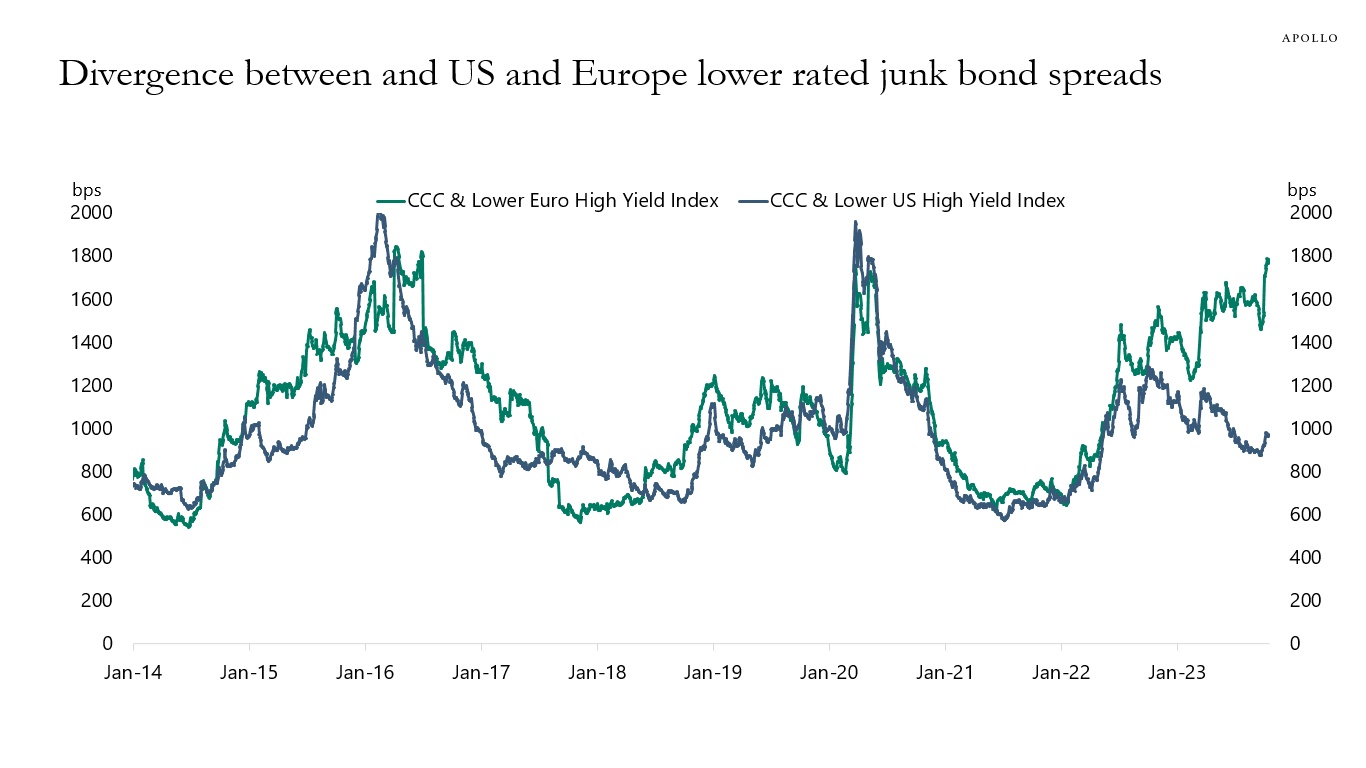
Source: Bloomberg, Apollo Chief Economist 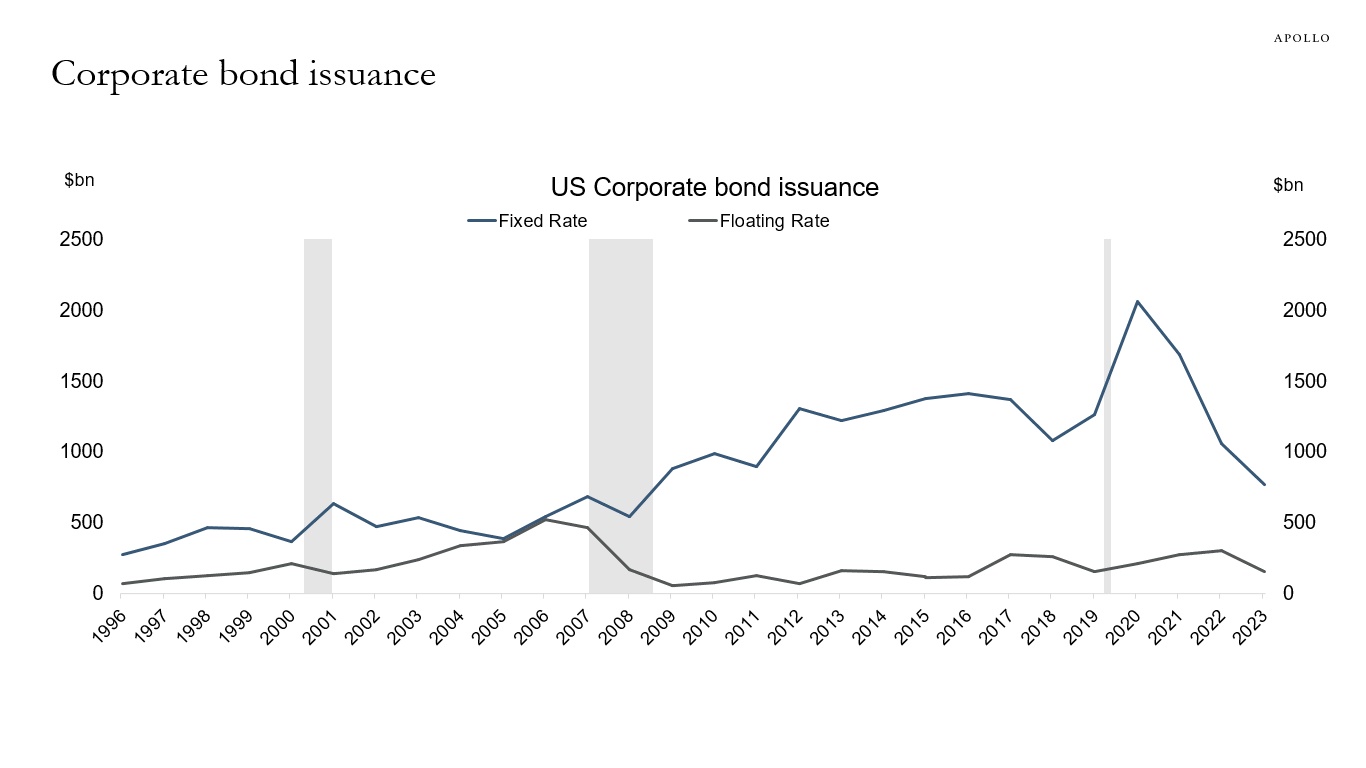
Source: SIFMA, Apollo Chief Economist 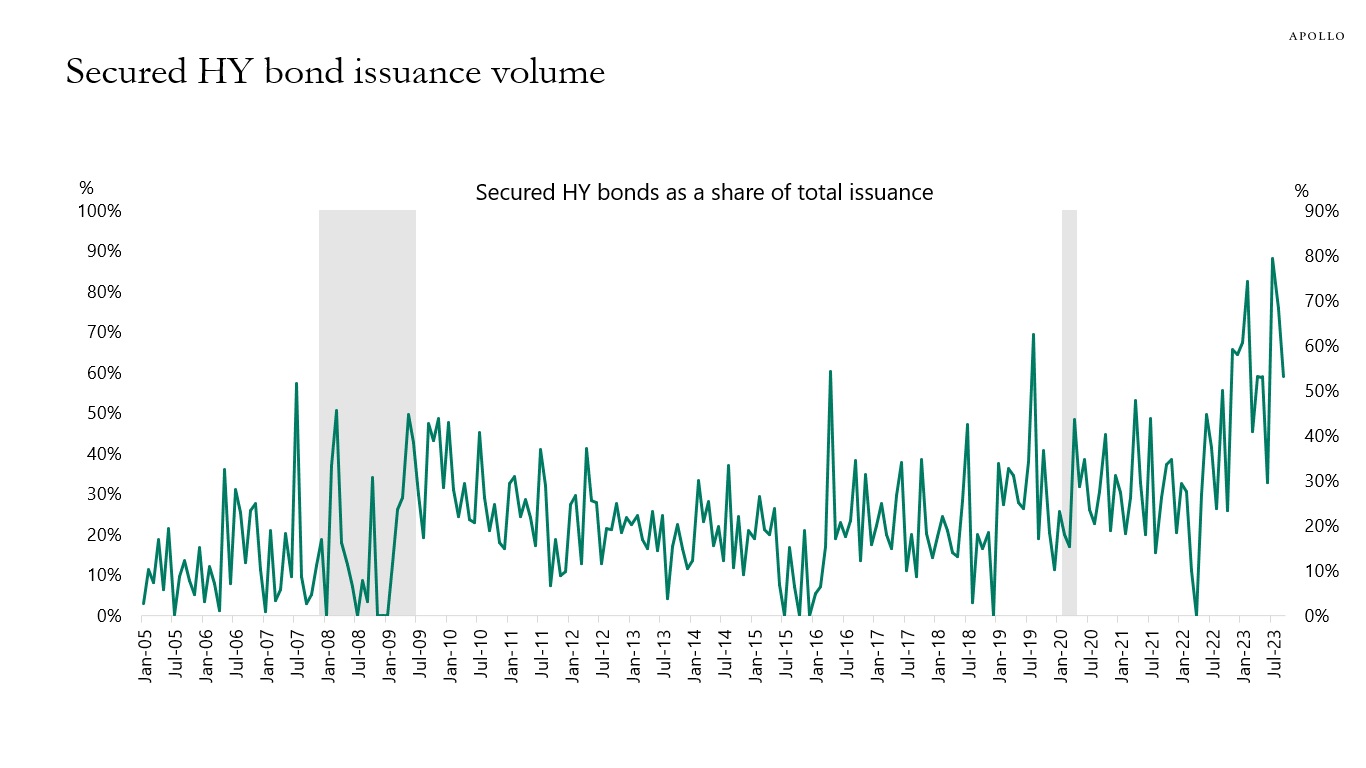
Source: Pitchbook LCD, Apollo Chief Economist. Note: A secured bond is a bond backed by collateral. 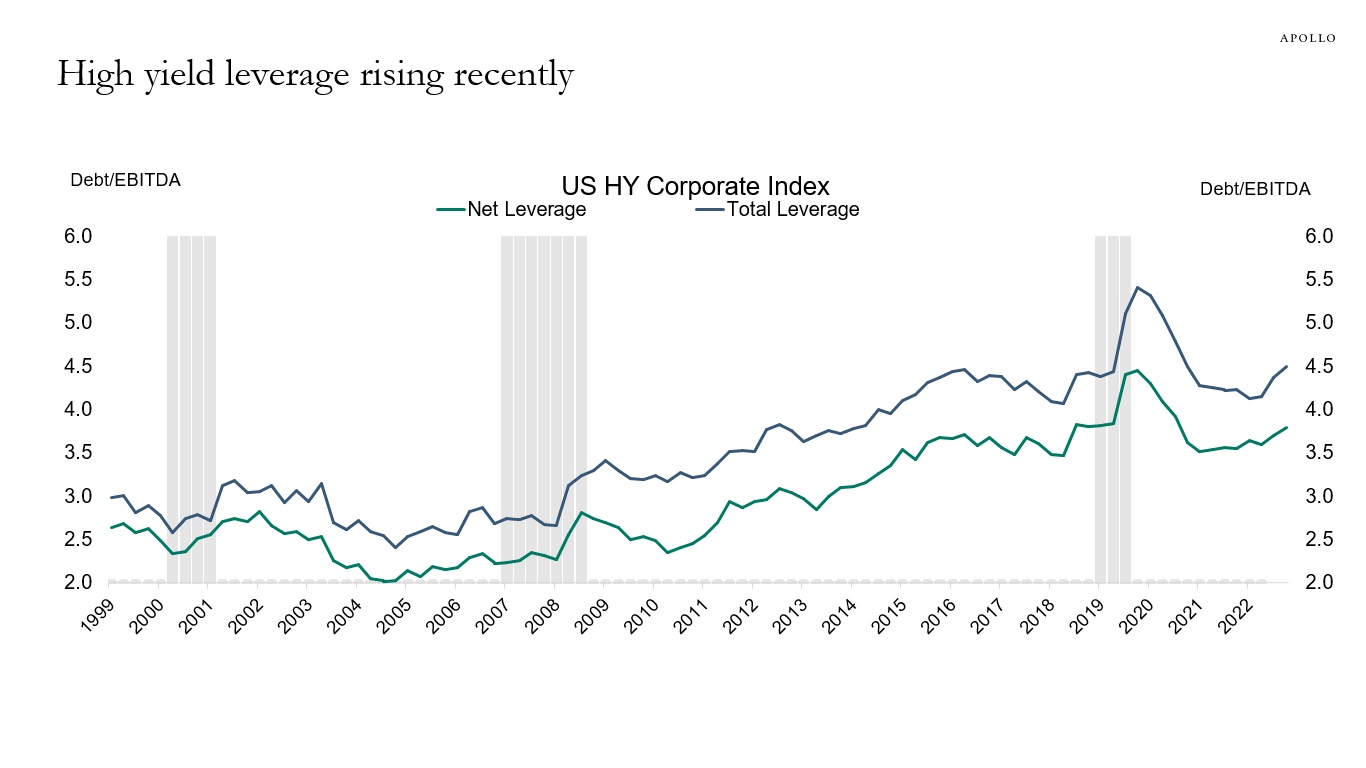
Source: Bloomberg, Apollo Chief Economist. Note: The lines show net leverage and total leverage for the median companies in the H0AO index.
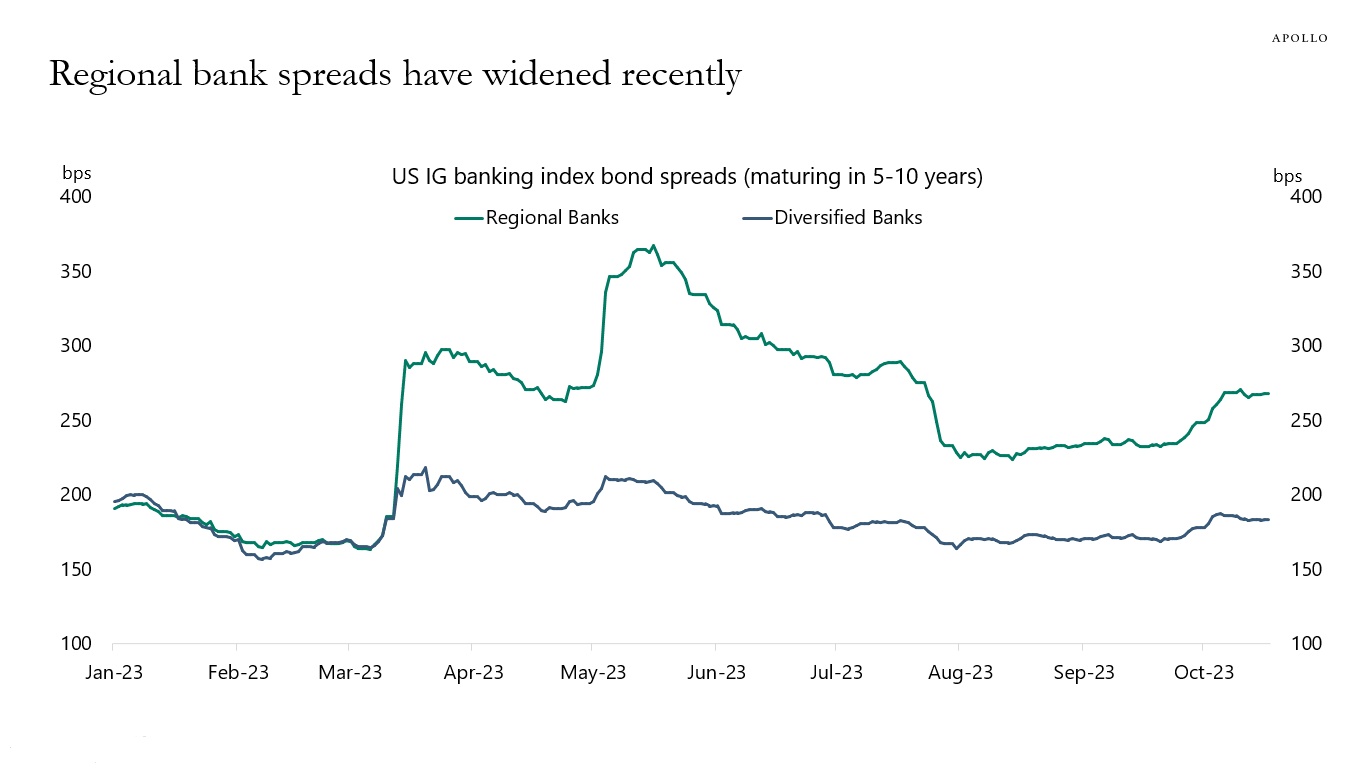
Source: ICE BofA, Bloomberg, Apollo Chief Economist. Note: Unweighted average spreads of bonds from ICE 5-10 Year US Banking Index, C6PX Index for bonds issued before Jan 1, 2023. There are eight banks in the Regional index and 41 banks in the Diversified index. Regional banks include BankUnited Inc, Citizens Financial Group, Huntington Bancshares Incorporated, Regions Financial Corporation, Truist Financial Corporation, Webster Financial Corp, Wintrust Financial Corp, Zions. Diversified banks include JP Morgan, Citibank, Bank of America, etc. See important disclaimers at the bottom of the page.
-
The CBOE has launched two new measures of implied volatility for IG and HY, and they show that credit vol has increased recently and remains above pre-pandemic levels, see chart below. These new indicators are calculated daily, and the Bloomberg tickers are VIXIG and VIXHY.
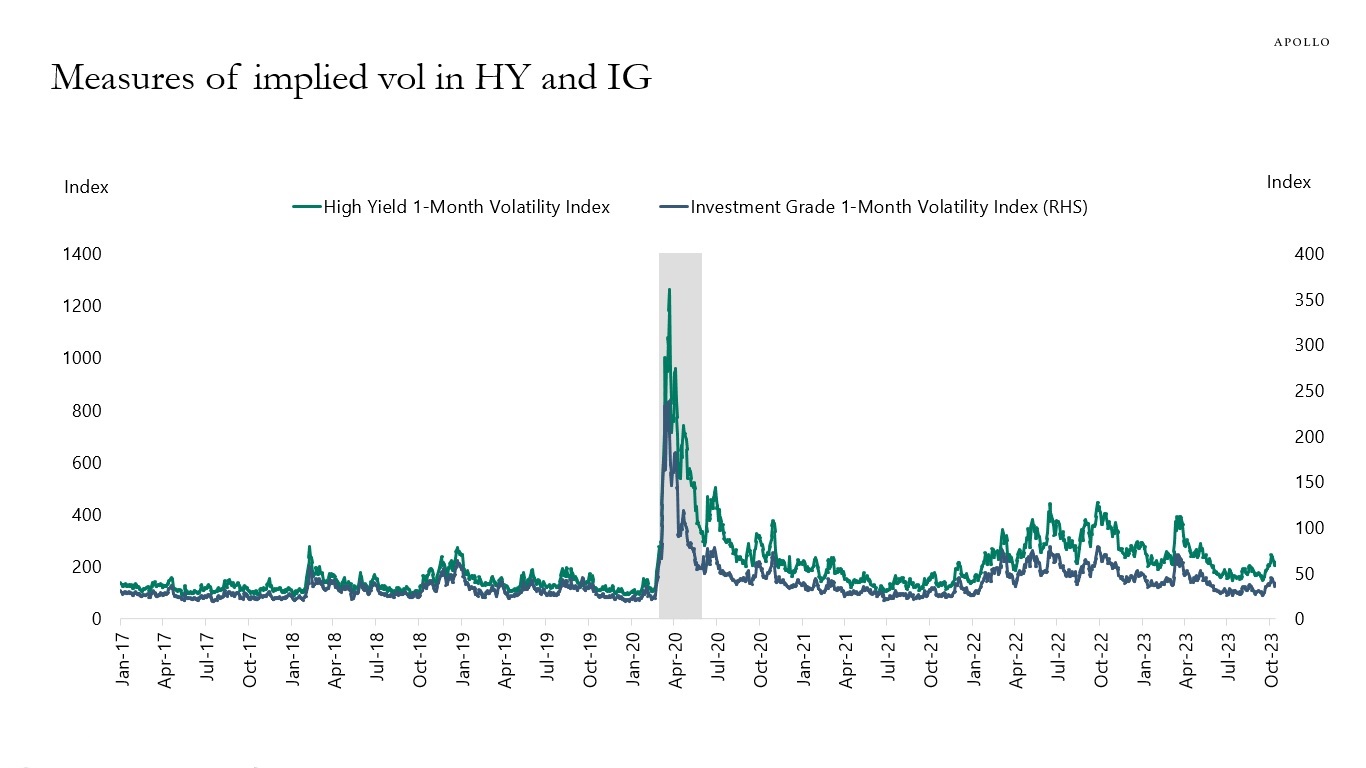
Source: CBOE, Bloomberg, Apollo Chief Economist See important disclaimers at the bottom of the page.
-
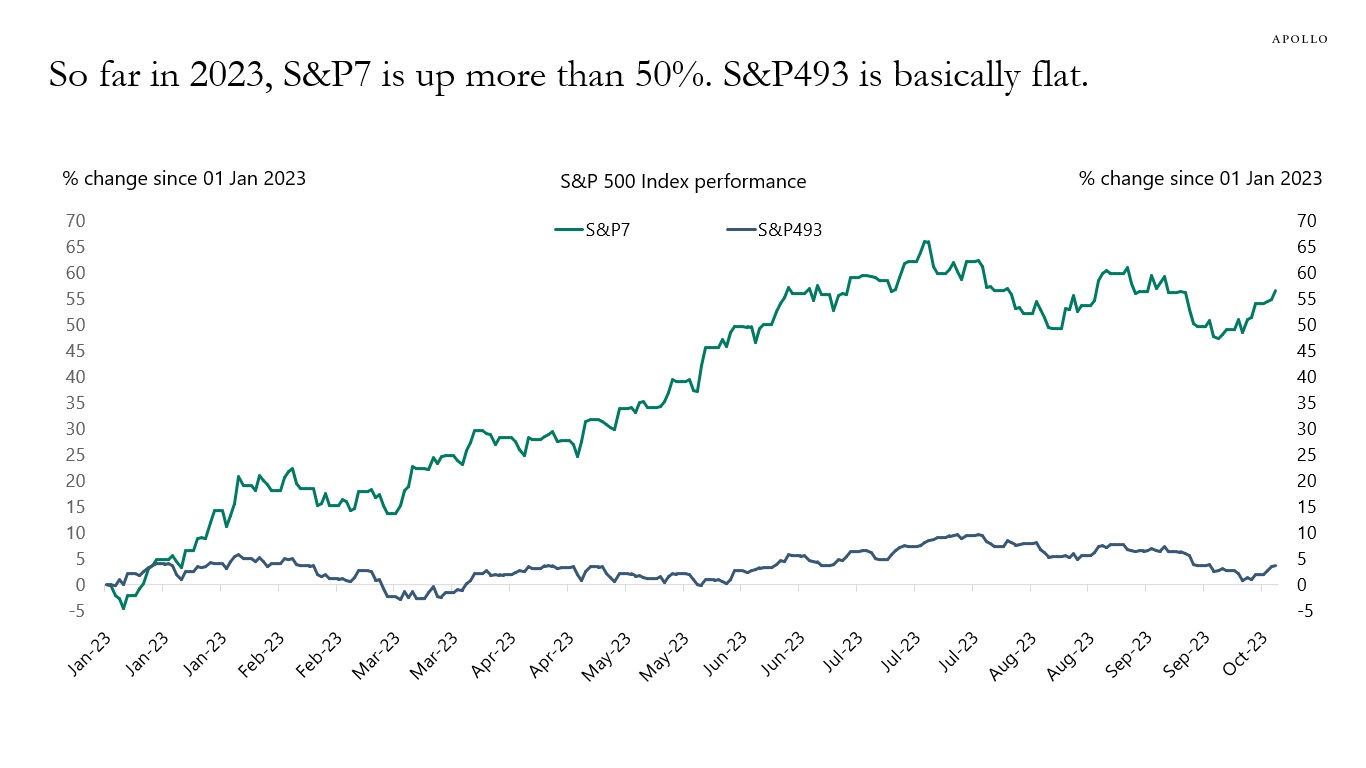
The P/E ratio for the S&P493 has fluctuated around 19 in 2023.
And the P/E ratio for the S&P7 has increased from 29 to 45, see the first chart below.
The bottom line is that returns this year in the S&P500 have been driven entirely by returns in the seven biggest stocks, and these seven stocks have become more and more overvalued.
What is particularly remarkable is that the ongoing overvaluation of tech stocks has happened during a year when long-term interest rates have increased significantly. Remember, tech companies have cash flows far out in the future, which should be more negatively impacted by increases in the discount rate.
The conclusion is that tech valuations are very high and inconsistent with the significant rise in long-term interest rates, see the second chart.
In short, something has to give. Either stocks have to go down to be consistent with the current level of interest rates. Or long-term interest rates have to go down to be consistent with the current level of stock prices.
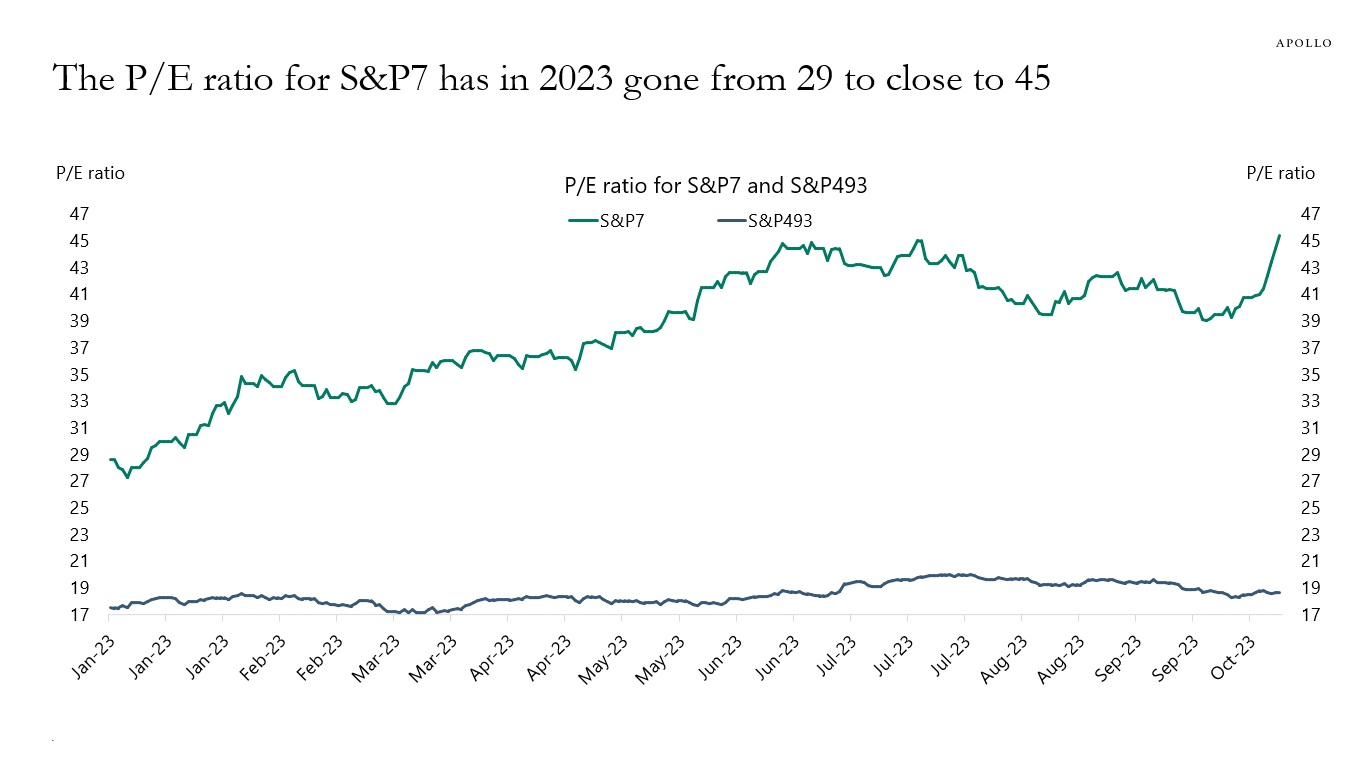
Source: Bloomberg, Apollo Chief Economist. Note: 12-month trailing P/E ratio used. 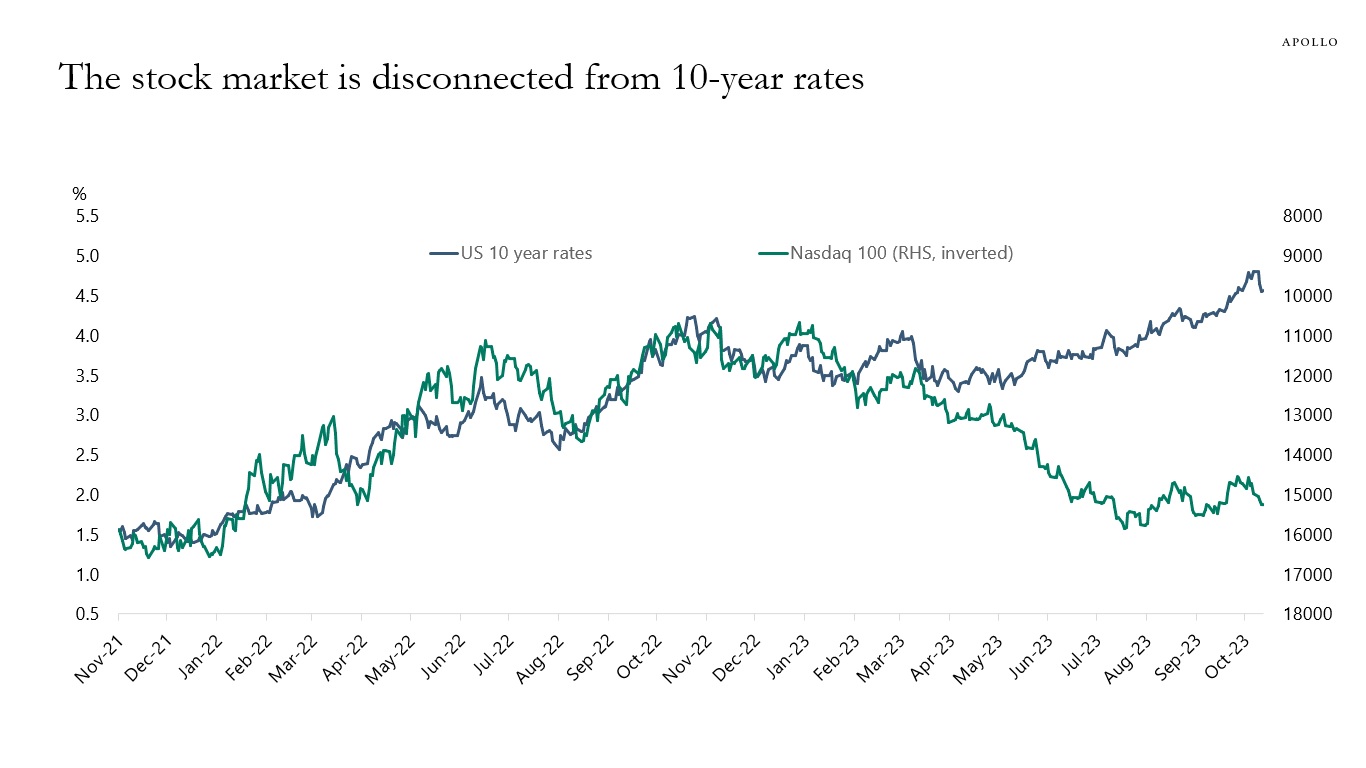
Source: Bloomberg, Apollo Chief Economist See important disclaimers at the bottom of the page.
-
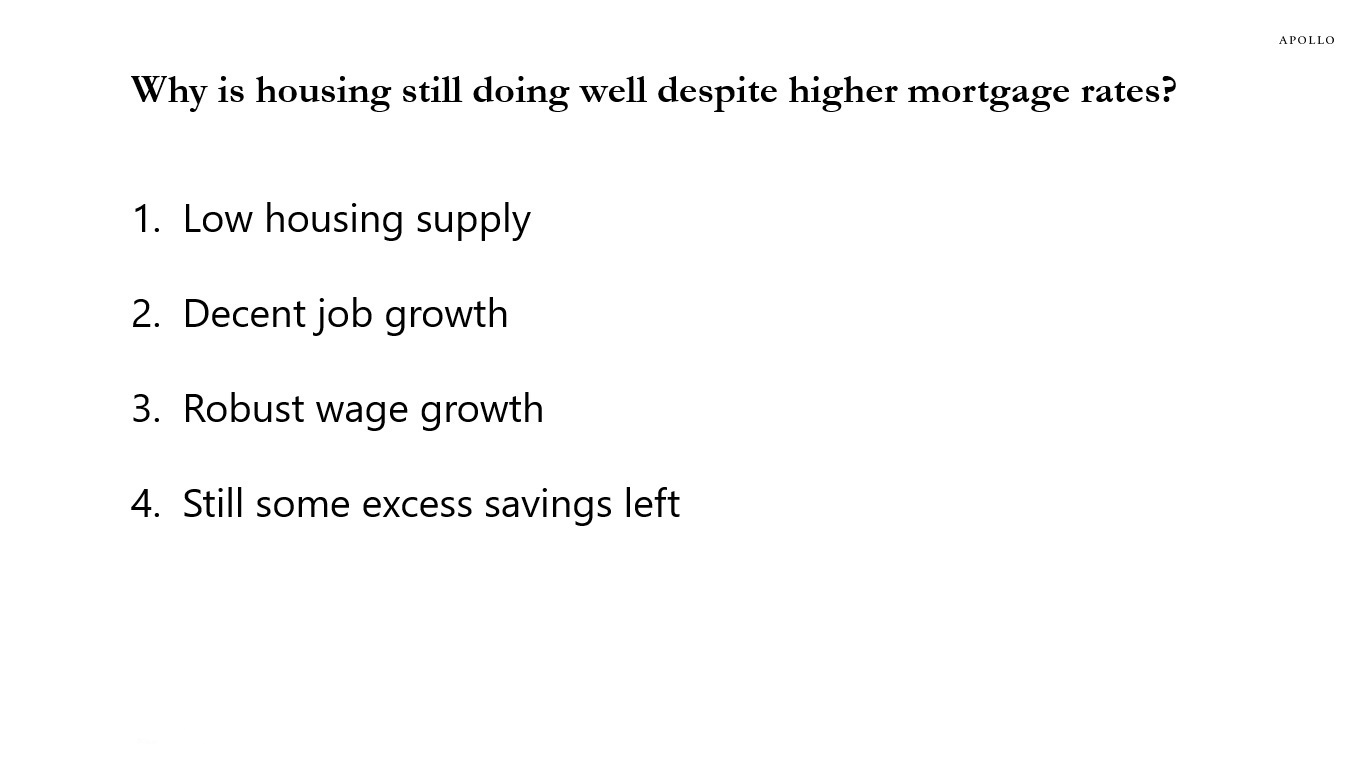
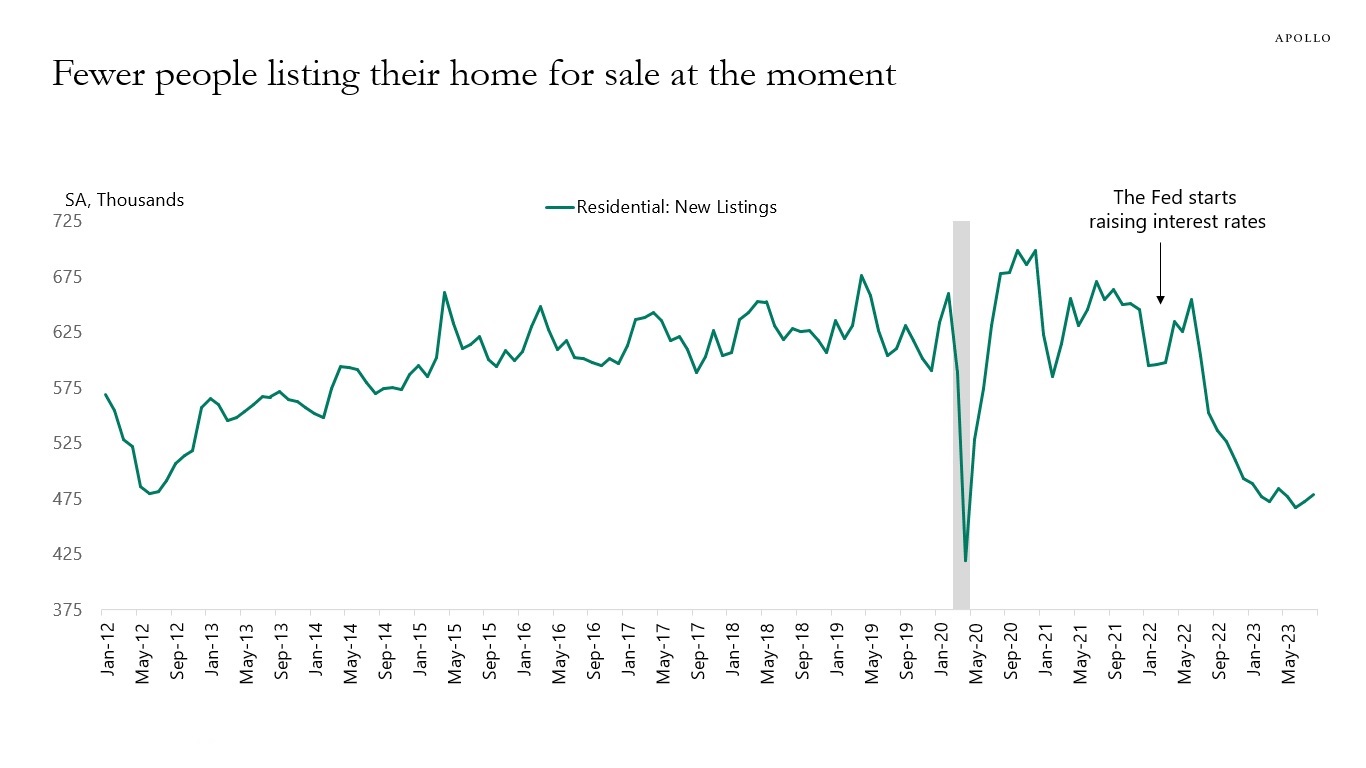
Our latest outlook for the housing market is available here, key charts below.
Source: Apollo Chief Economist 
Source: Redfin, Haver Analytics, Apollo Chief Economist 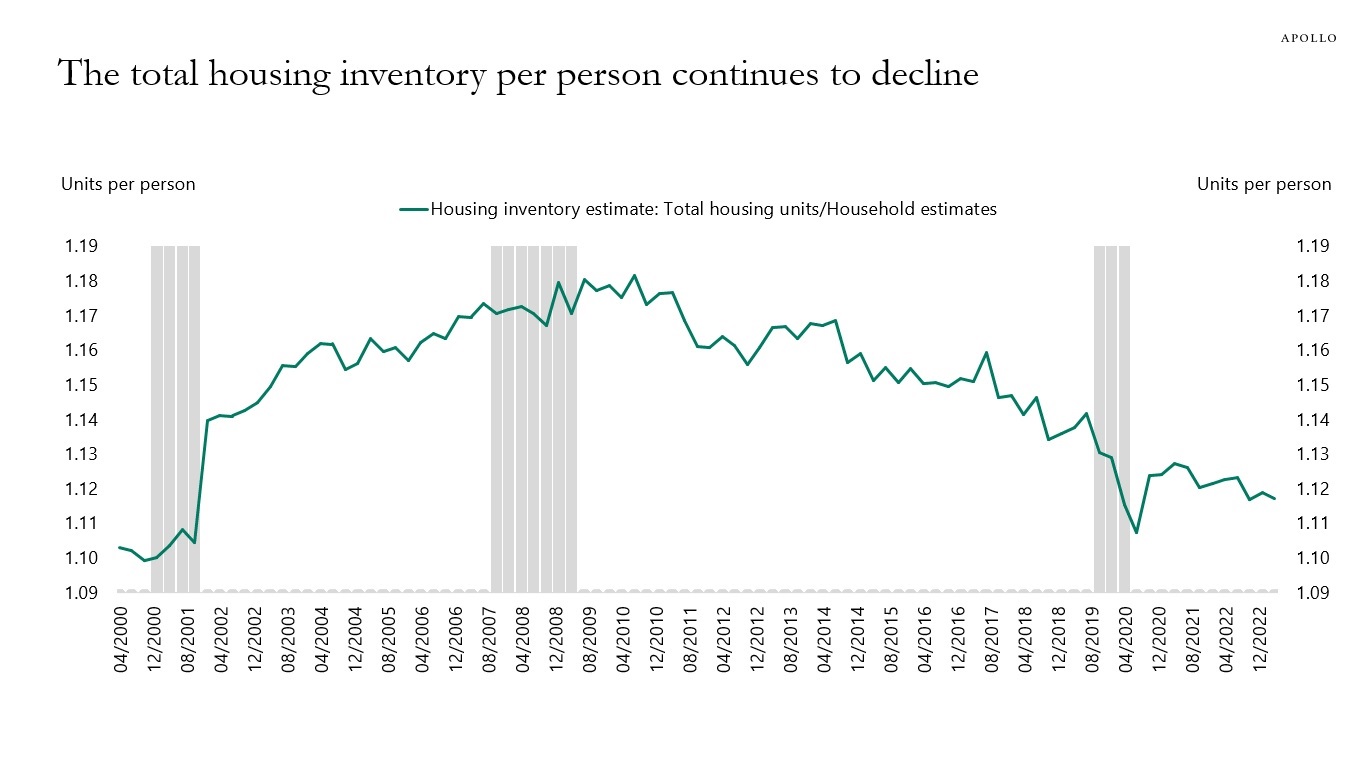
Source: Census Bureau, FRED, Apollo Chief Economist 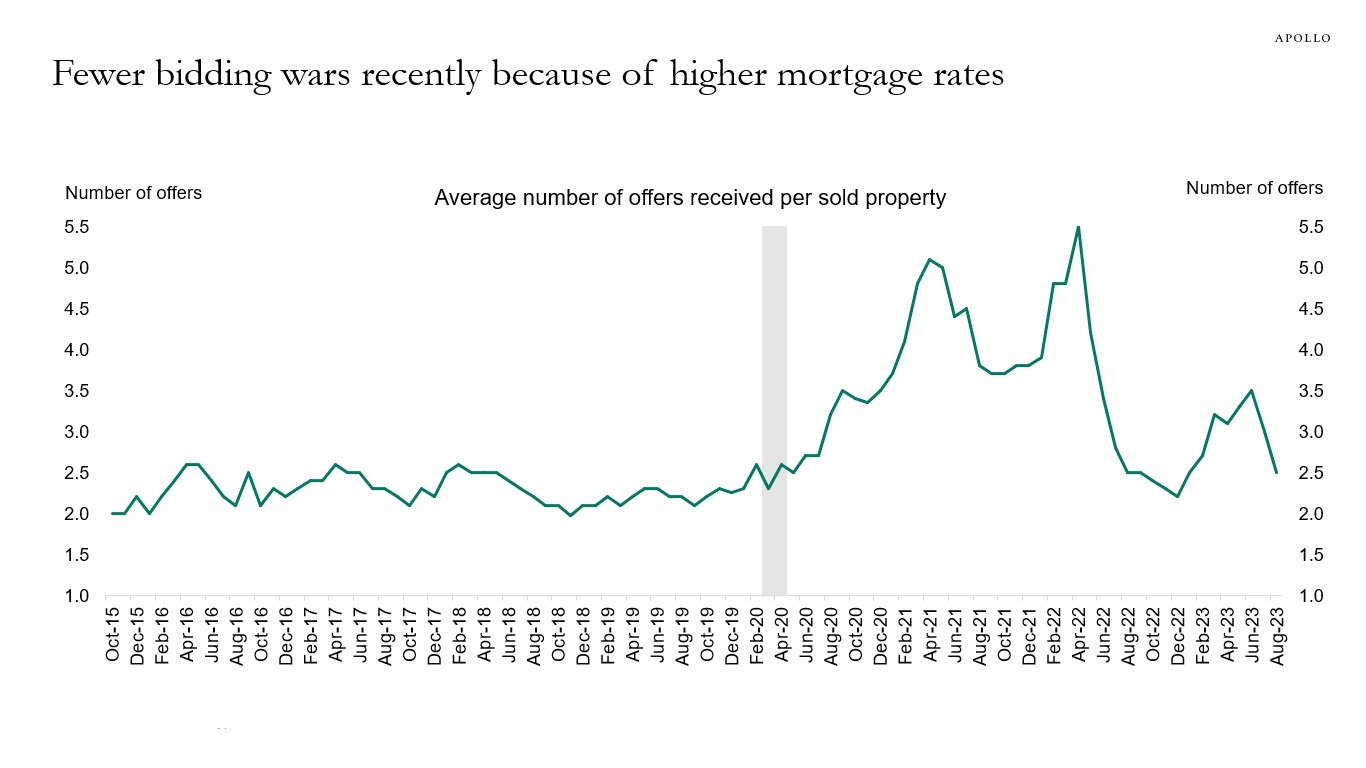
Source: NAR, Apollo Chief Economist 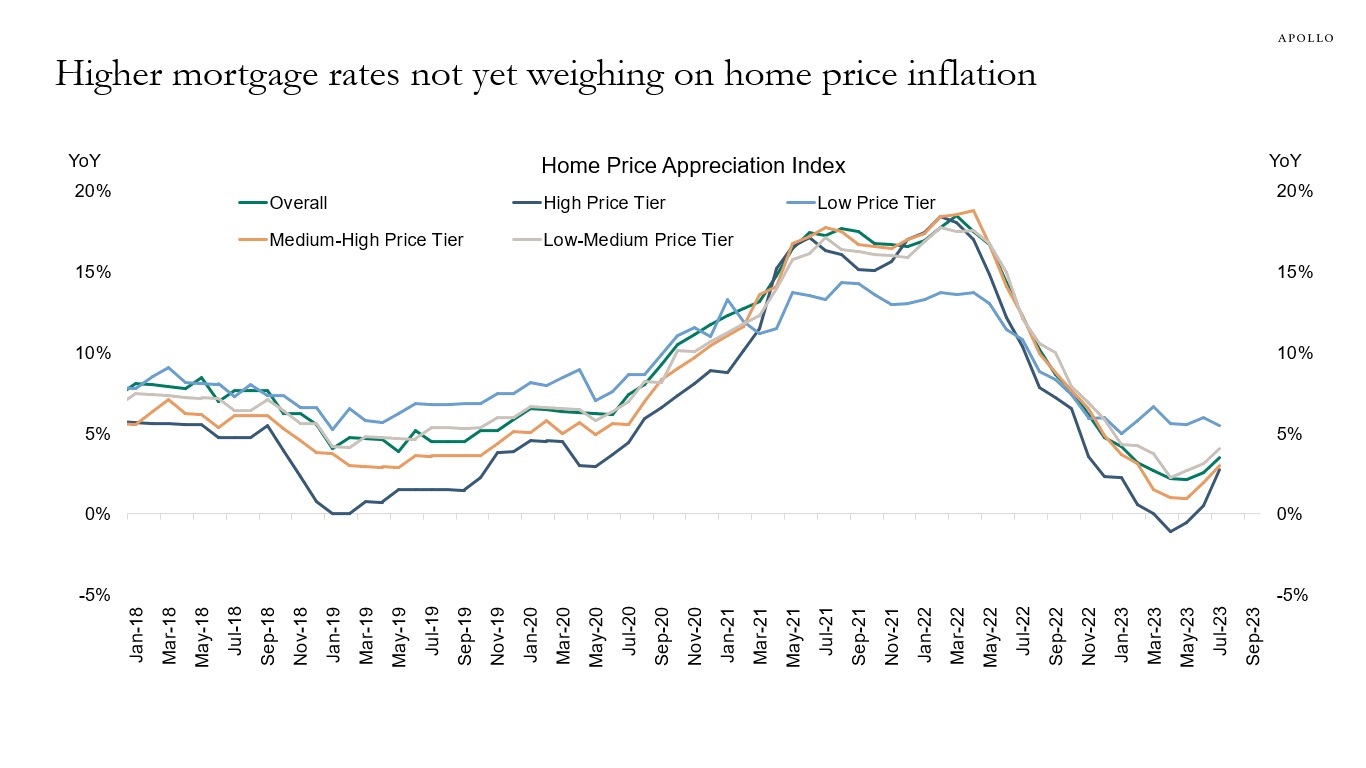
Source: American Enterprise Institute, Haver, Apollo Chief Economist 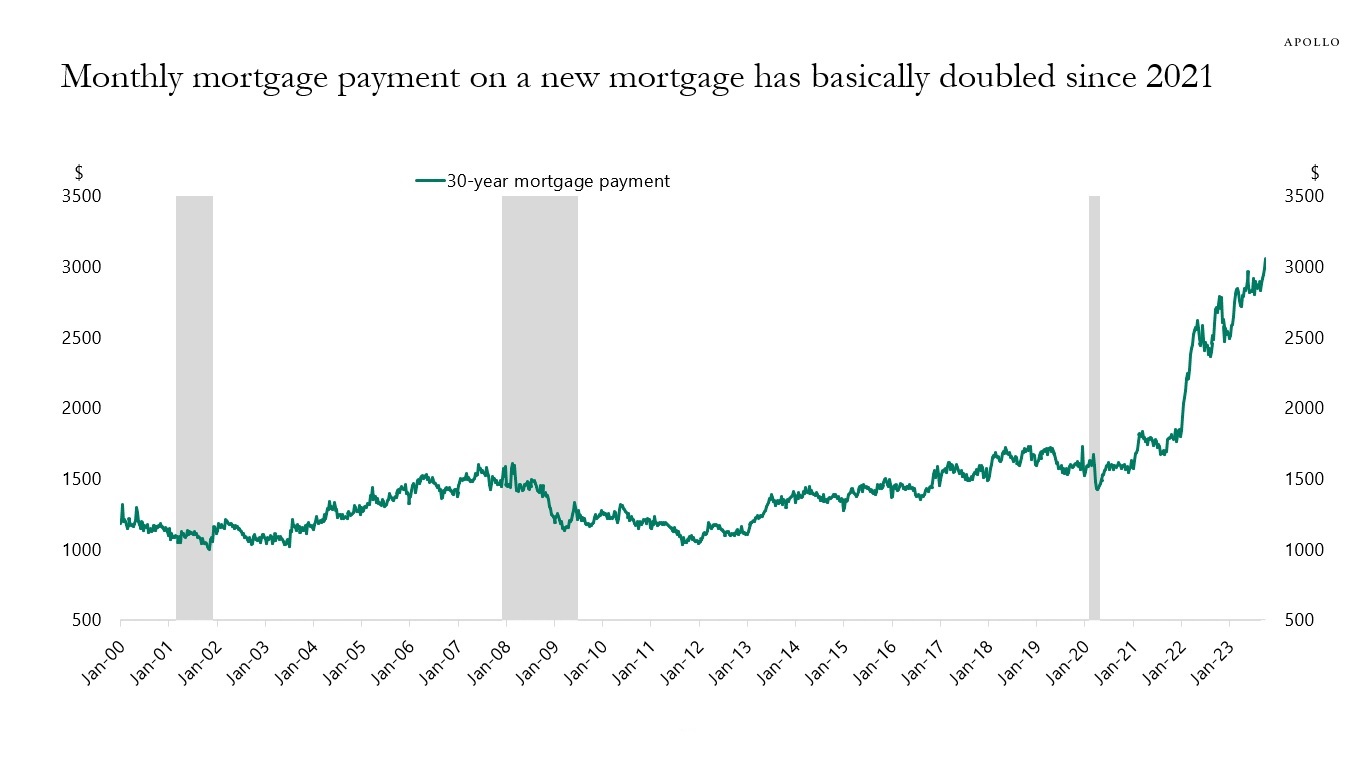
Source: Bloomberg L.P., Apollo Chief Economist (Note: Calculation of monthly payment using the 30-year purchase loan application size and the 30-year effective rate.) 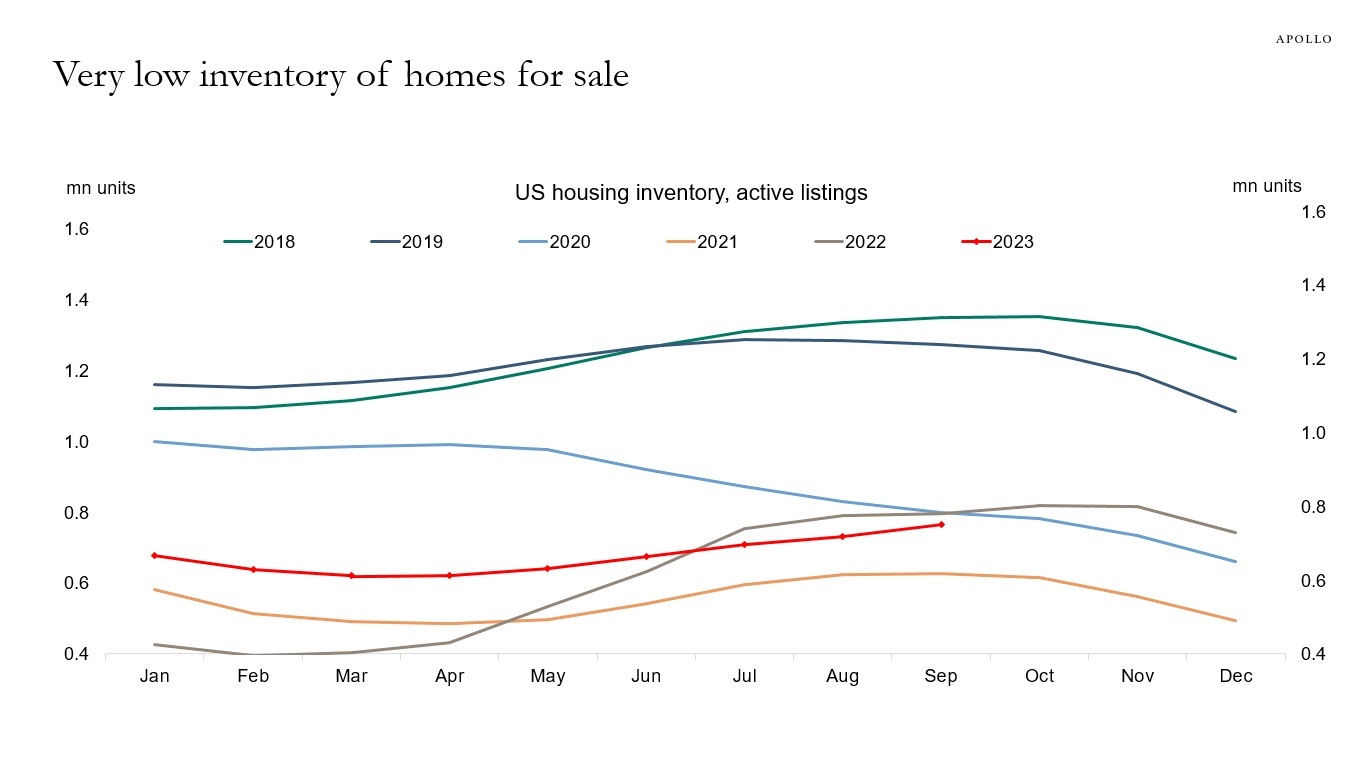
Source: Realtor.com, Apollo Chief Economist 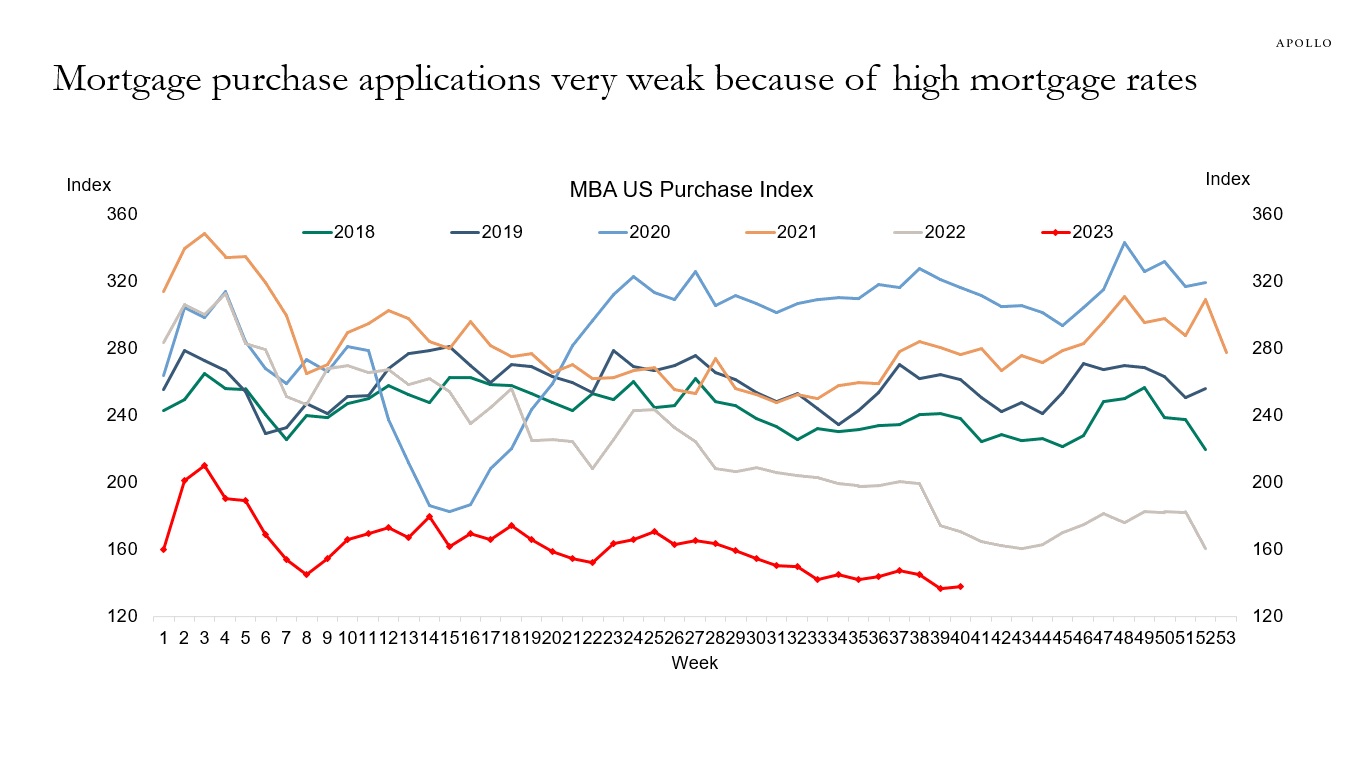
Source: Mortgage Bankers Association, Bloomberg, Apollo Chief Economist 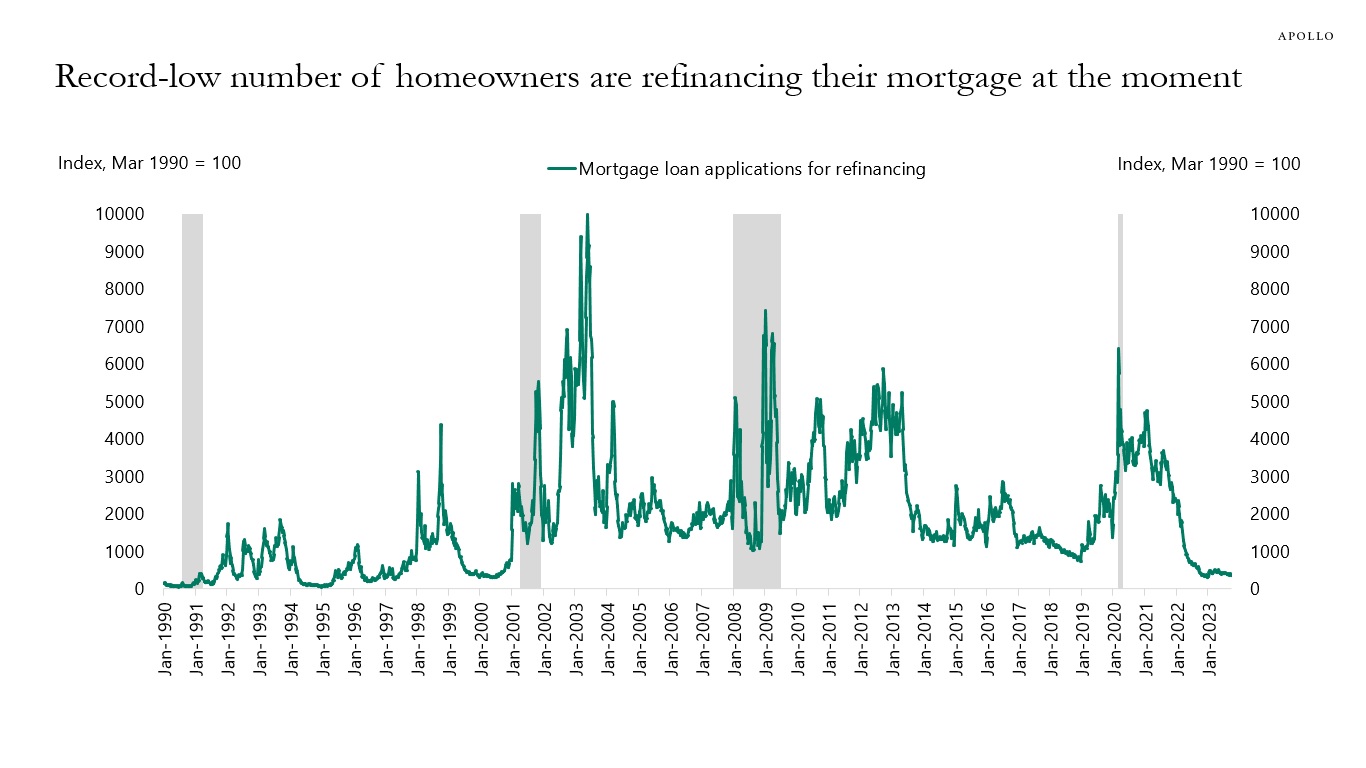
Source: Mortgage Bankers Association, Bloomberg, Apollo Chief Economist 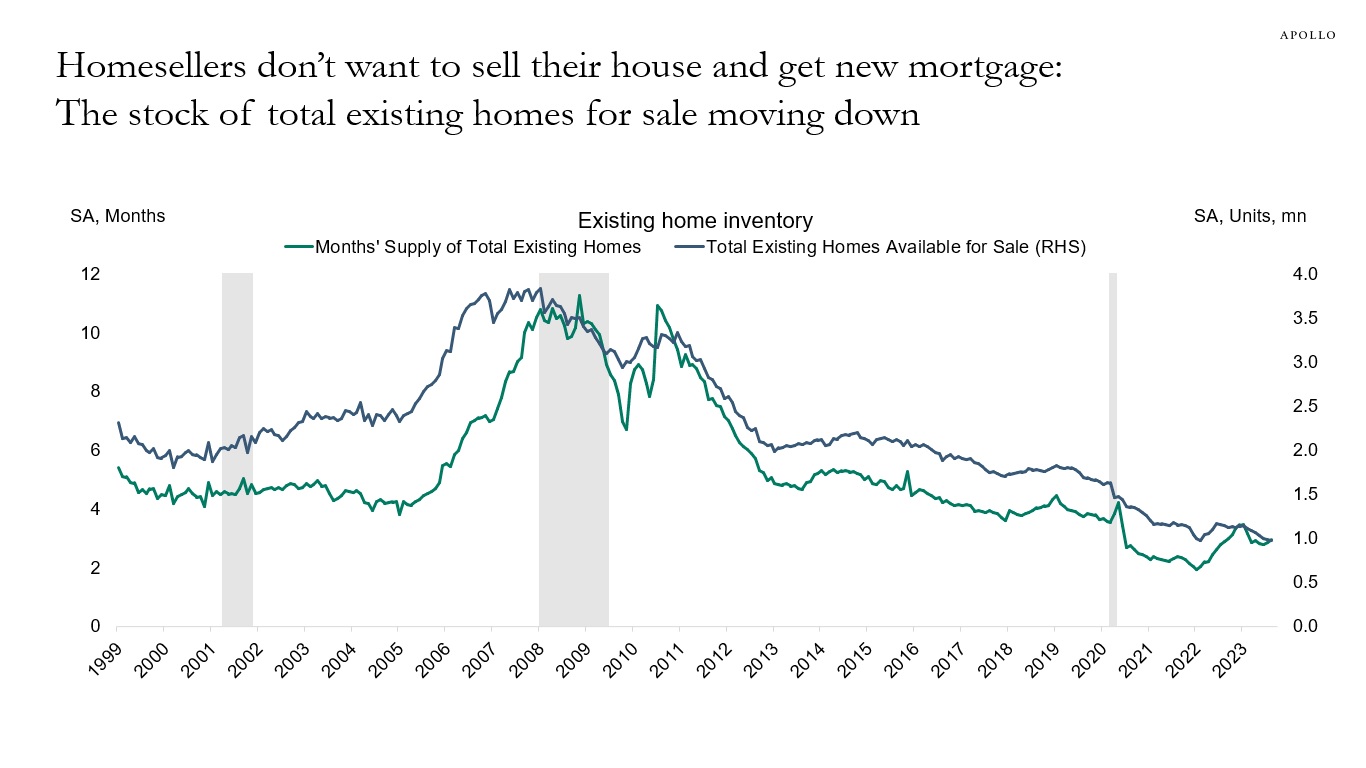
Source: NAR, Apollo Chief Economist 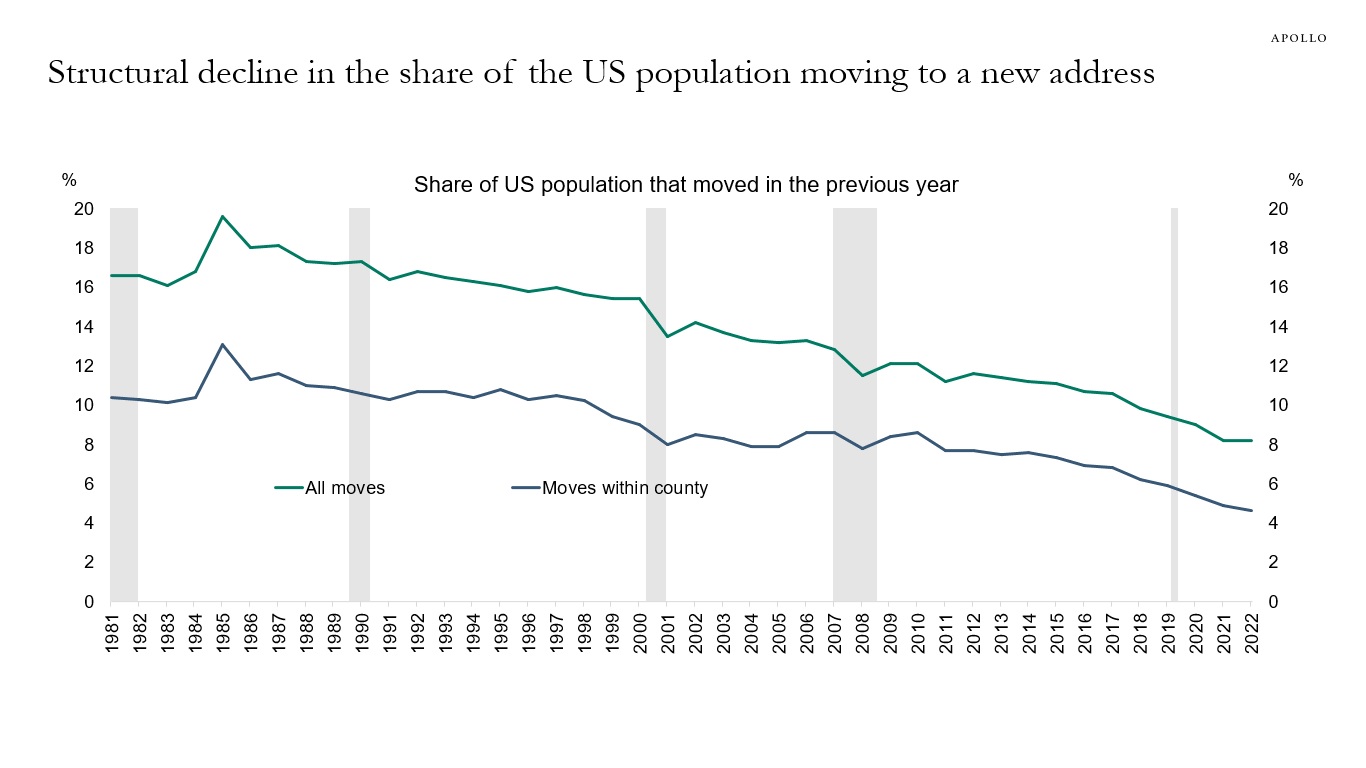
Source: Census CPS, Apollo Chief Economist 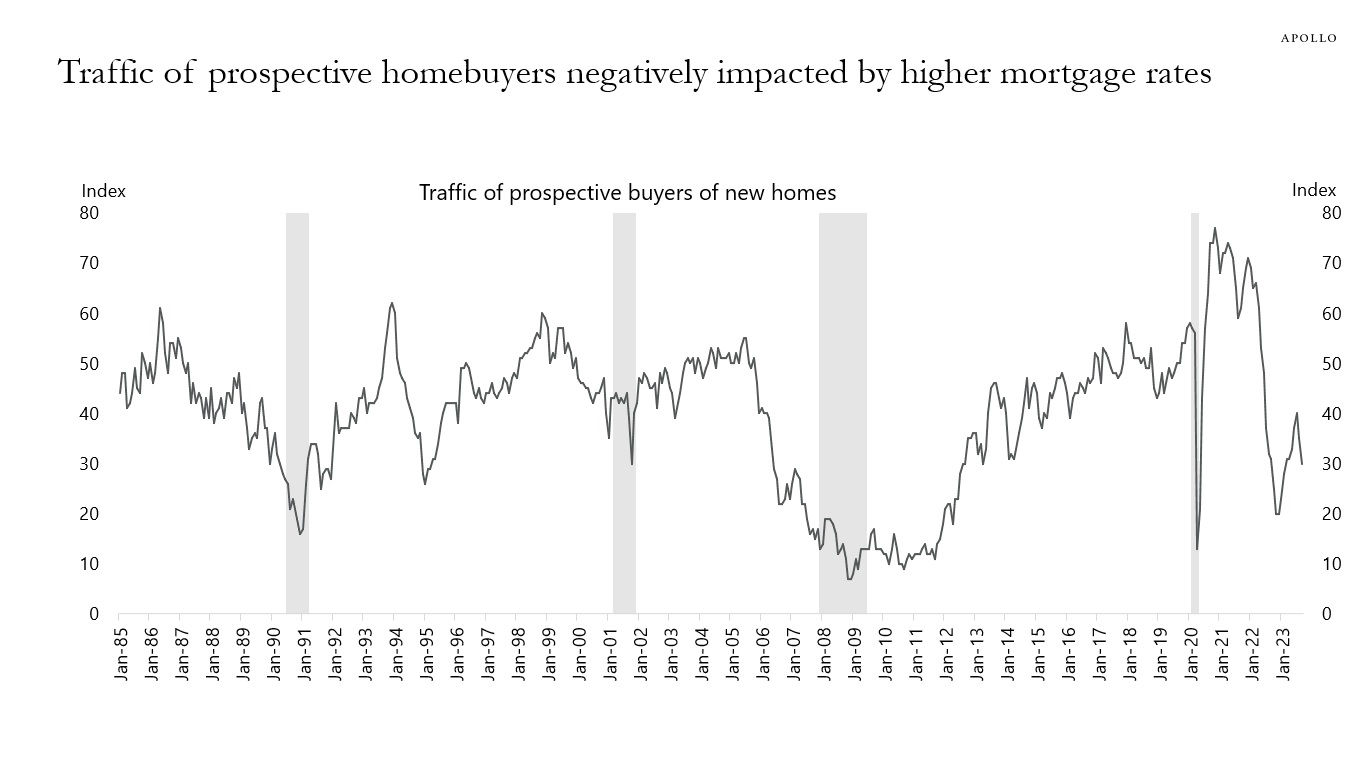
Source: National Association of Homebuilders, Bloomberg, Apollo Chief Economist 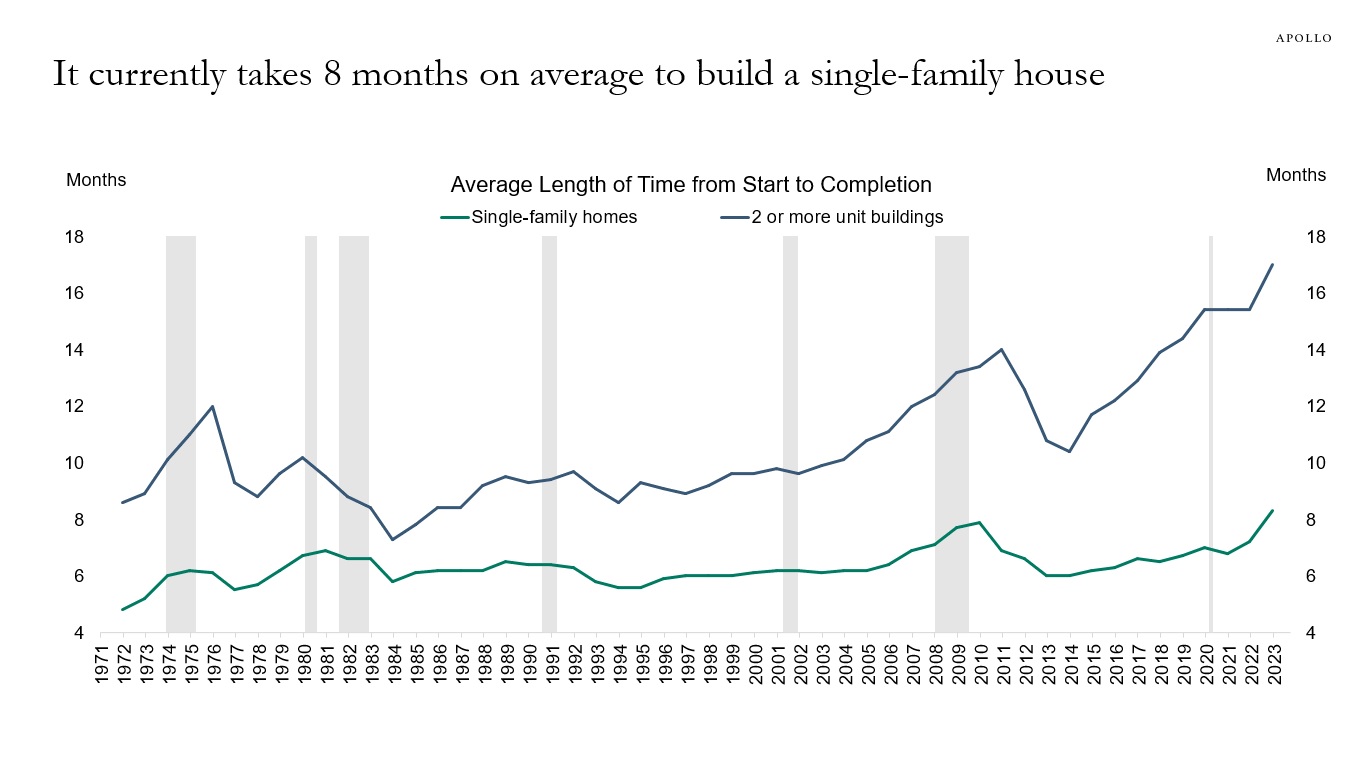
Source: Census, Haver Analytics, Apollo Chief Economist. Note: Single-family homes are one-unit buildings. See important disclaimers at the bottom of the page.
-
The Worker Adjustment and Retraining Notification (WARN) Act gives 60 to 90 days advance notice in cases of plant closings and mass layoffs, and the latest data shows a significant move higher in WARN notices recently, see chart below.
In other words, the WARN data is telling us that more companies are giving advance warnings about plant closings and mass layoffs.
Running a regression using WARN notices to predict unemployment shows that initial jobless claims in October will rise over the coming weeks to a level between 250K and 300K, see chart below.
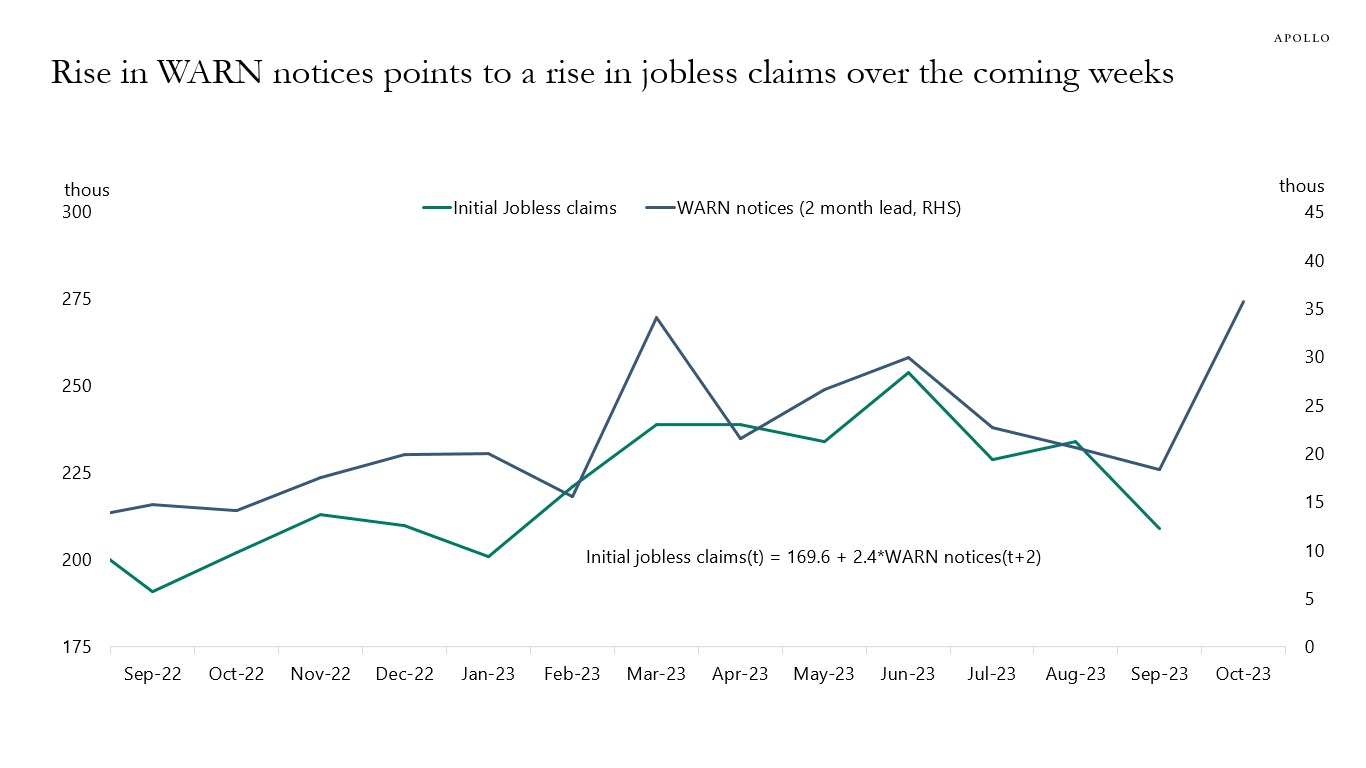
Source: Department of Labor, Haver Analytics, Federal Reserve Bank of Cleveland, Apollo Chief Economist. Note: The Worker Adjustment and Retraining Notification (WARN) Act helps ensure 60 to 90 days advance notice in cases of qualified plant closings and mass layoffs. WARN factor is the Cleveland Fed estimate for WARN notices. See important disclaimers at the bottom of the page.
-
Our monthly outlook for public and private markets is available here.
Source: Bloomberg, Apollo Chief Economist 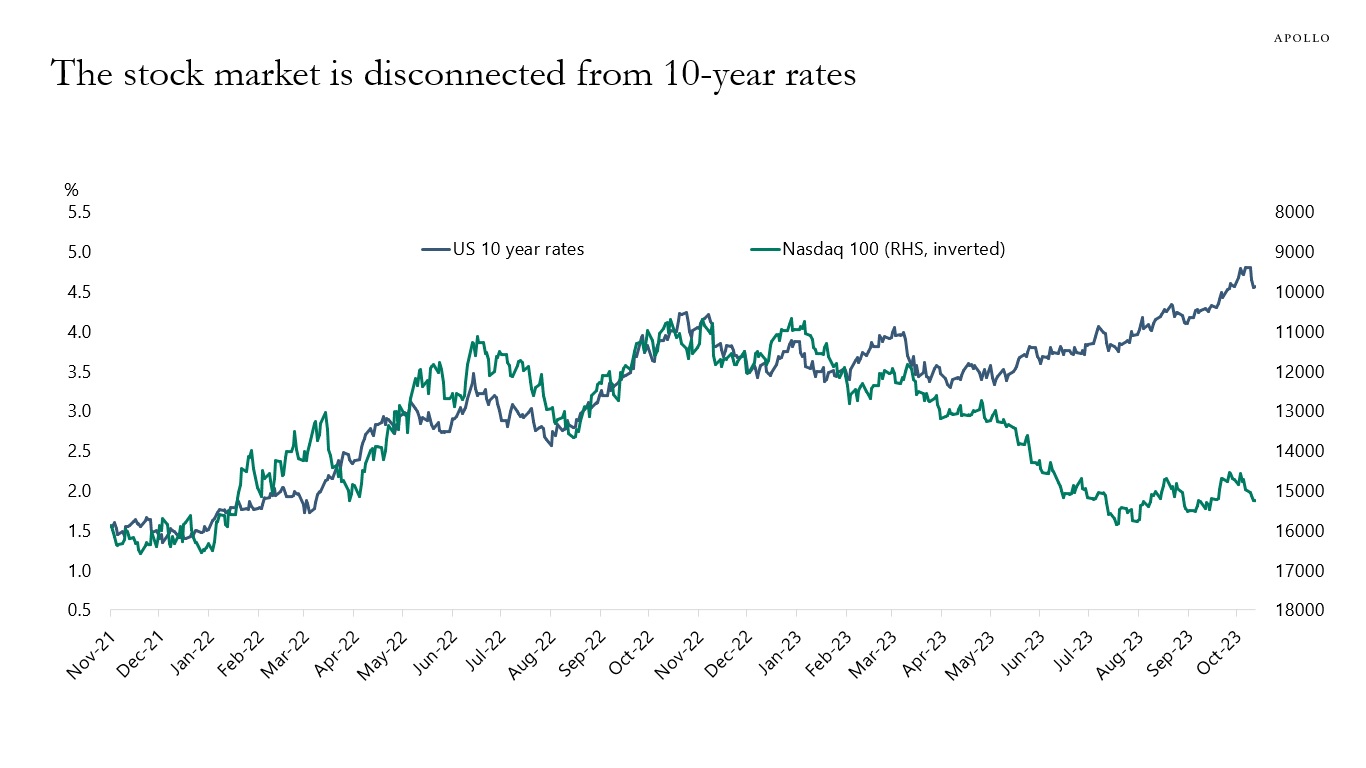
Source: Bloomberg, Apollo Chief Economist 
Source: Bloomberg, Apollo Chief Economist 
Source: Bloomberg, Apollo Chief Economist 
See important disclaimers at the bottom of the page.

This presentation may not be distributed, transmitted or otherwise communicated to others in whole or in part without the express consent of Apollo Global Management, Inc. (together with its subsidiaries, “Apollo”).
Apollo makes no representation or warranty, expressed or implied, with respect to the accuracy, reasonableness, or completeness of any of the statements made during this presentation, including, but not limited to, statements obtained from third parties. Opinions, estimates and projections constitute the current judgment of the speaker as of the date indicated. They do not necessarily reflect the views and opinions of Apollo and are subject to change at any time without notice. Apollo does not have any responsibility to update this presentation to account for such changes. There can be no assurance that any trends discussed during this presentation will continue.
Statements made throughout this presentation are not intended to provide, and should not be relied upon for, accounting, legal or tax advice and do not constitute an investment recommendation or investment advice. Investors should make an independent investigation of the information discussed during this presentation, including consulting their tax, legal, accounting or other advisors about such information. Apollo does not act for you and is not responsible for providing you with the protections afforded to its clients. This presentation does not constitute an offer to sell, or the solicitation of an offer to buy, any security, product or service, including interest in any investment product or fund or account managed or advised by Apollo.
Certain statements made throughout this presentation may be “forward-looking” in nature. Due to various risks and uncertainties, actual events or results may differ materially from those reflected or contemplated in such forward-looking information. As such, undue reliance should not be placed on such statements. Forward-looking statements may be identified by the use of terminology including, but not limited to, “may”, “will”, “should”, “expect”, “anticipate”, “target”, “project”, “estimate”, “intend”, “continue” or “believe” or the negatives thereof or other variations thereon or comparable terminology.