


Want it delivered daily to your inbox?
-
Slowing global growth would argue for falling commodity prices. That is also what we are seeing for industrial metals such as copper.
Slowing global growth combined with extreme weather and inventory situations have created a more mixed situation for agricultural commodities. The agriculture price index has been moving sideways, with some components (such as orange juice, cocoa, and sugar) going up and others (such as soybean, corn, and coffee) going down.
For energy, slowing global growth and rising US production would argue for lower oil prices. But OPEC+ production cuts have pushed oil prices higher in recent months.
The sideways movement in the broad commodity price index is likely a welcome development for the Fed. However, a continued rise in oil prices could magnify the ongoing slowdown in growth and reverse the ongoing decline in inflation.
Our latest outlook for commodity prices is available here.
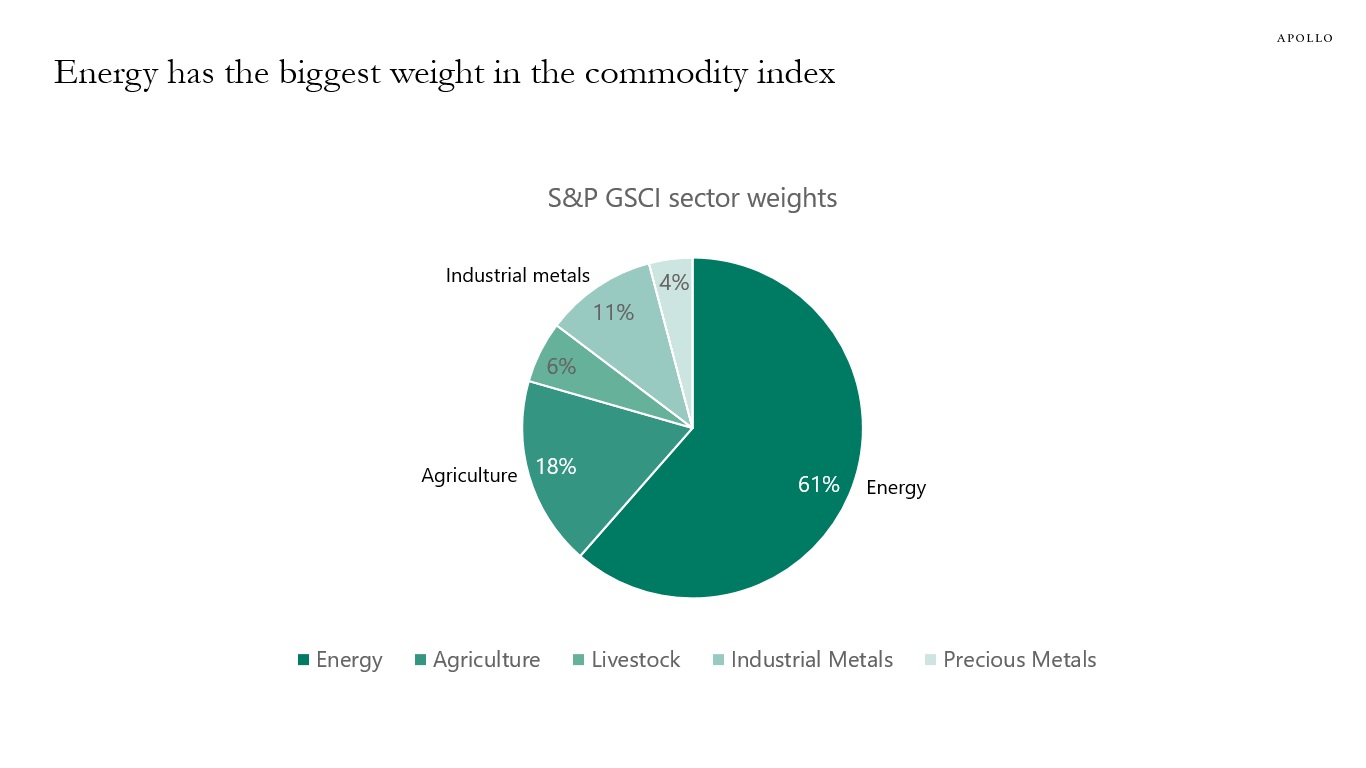
Source: S&P Global, Apollo Chief Economist 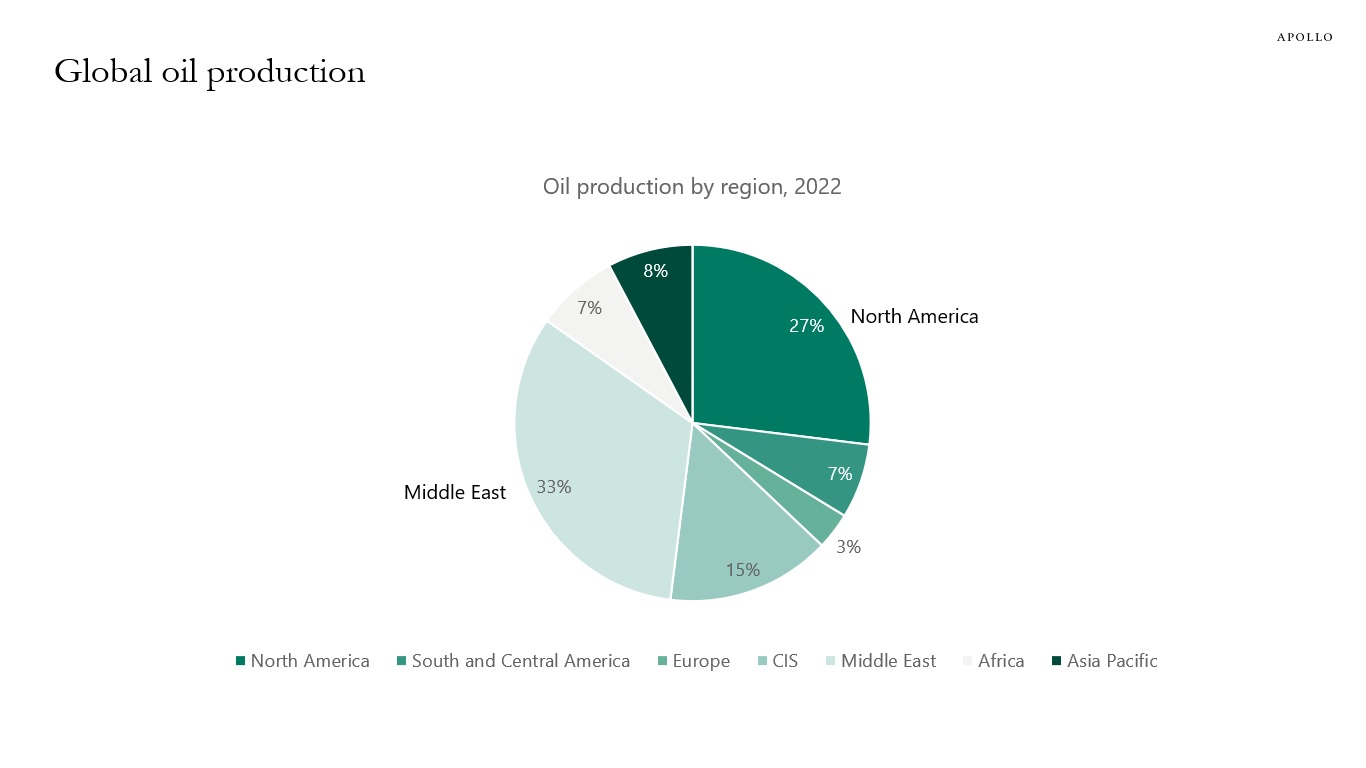
Source: Statistical Review of World Energy, Apollo Chief Economist See important disclaimers at the bottom of the page.
-
The divergence between different Fed forecasts for third-quarter GDP is significant.
The Atlanta Fed estimates that GDP this quarter is 4.9%, and the St. Louis Fed estimates that the US economy is currently in a recession.
Given this uncertainty, it makes sense for the FOMC to keep interest rates on hold at their meeting this week.
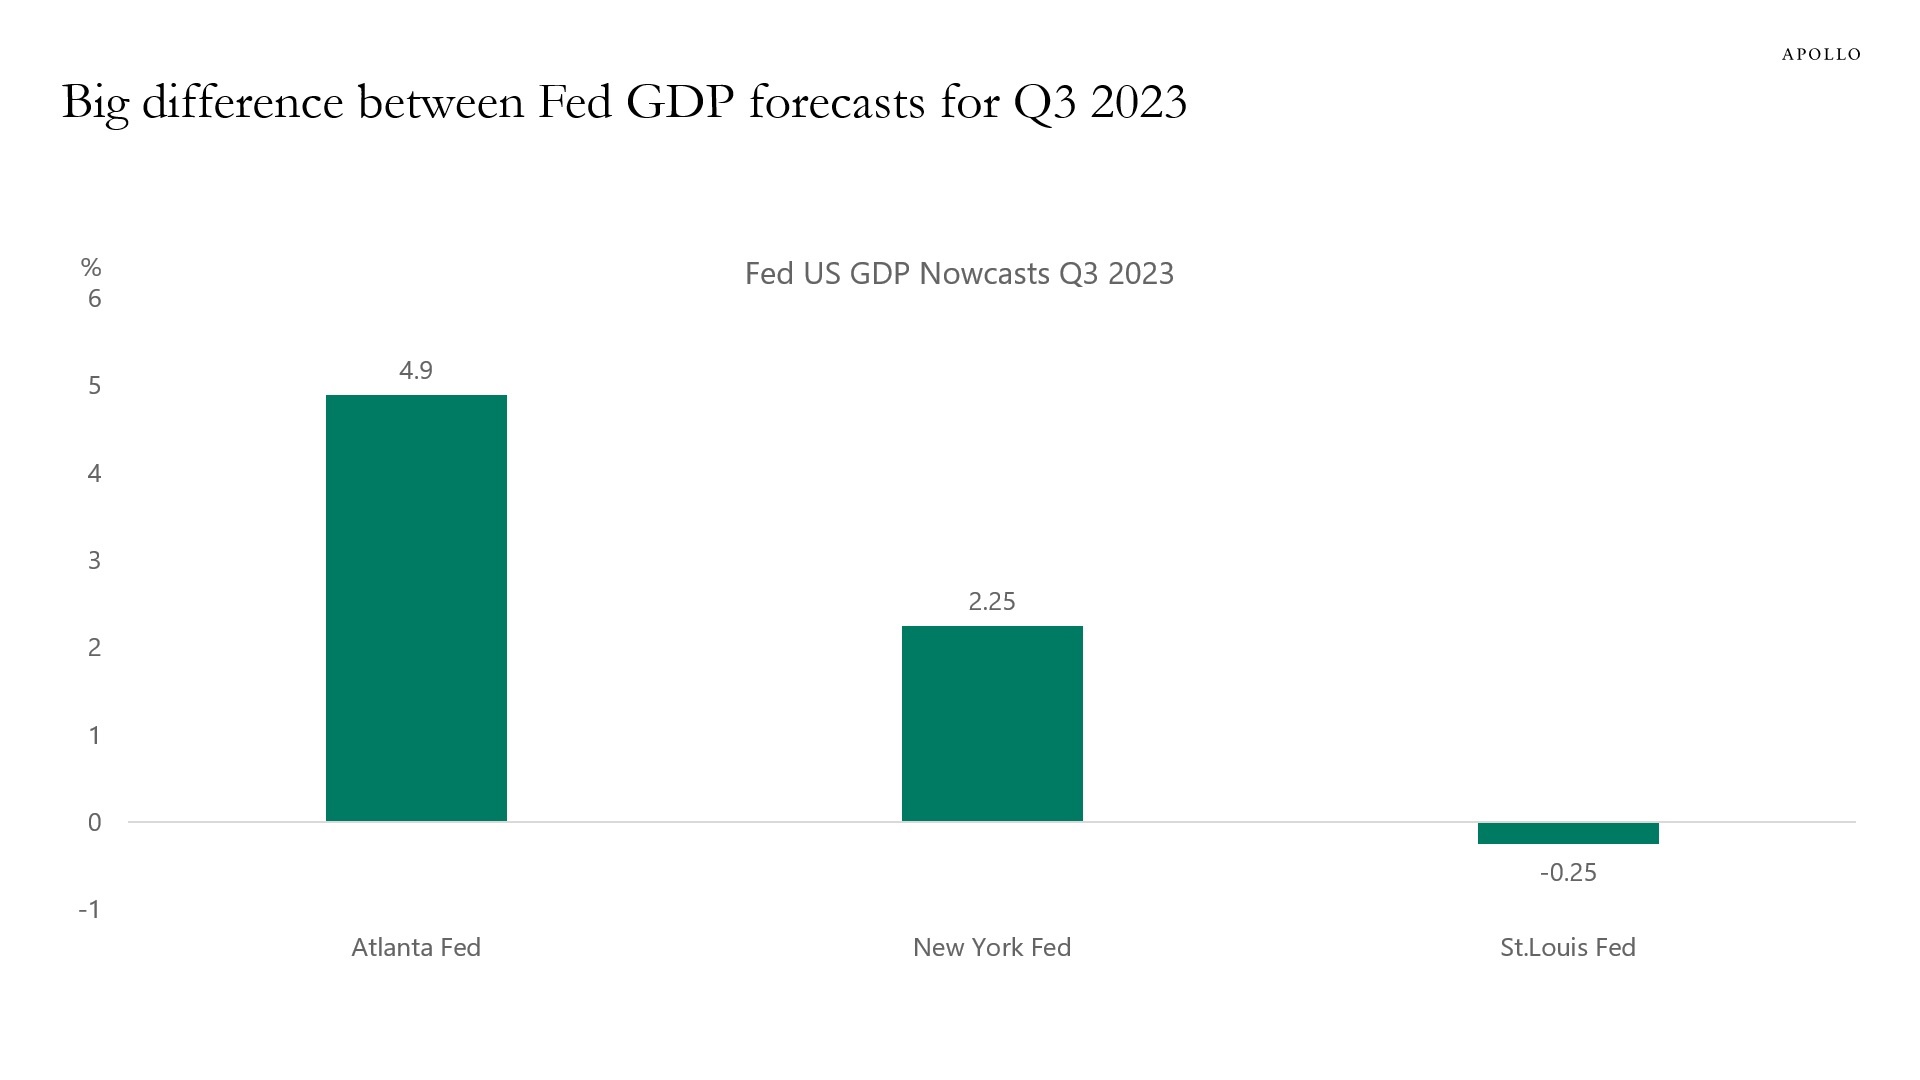
Source: Atlanta Fed, FRBNY, St. Louis Fed, Apollo Chief Economist See important disclaimers at the bottom of the page.
-
The number of people going to Broadway shows has in recent weeks been falling faster than normal, see chart below. We will over the coming weeks be closely monitoring whether Broadway attendance picks up like it normally does in the fall. For markets, this is important because consumer services continue to be the key reason why the economy, despite significant Fed hikes, is still holding up.
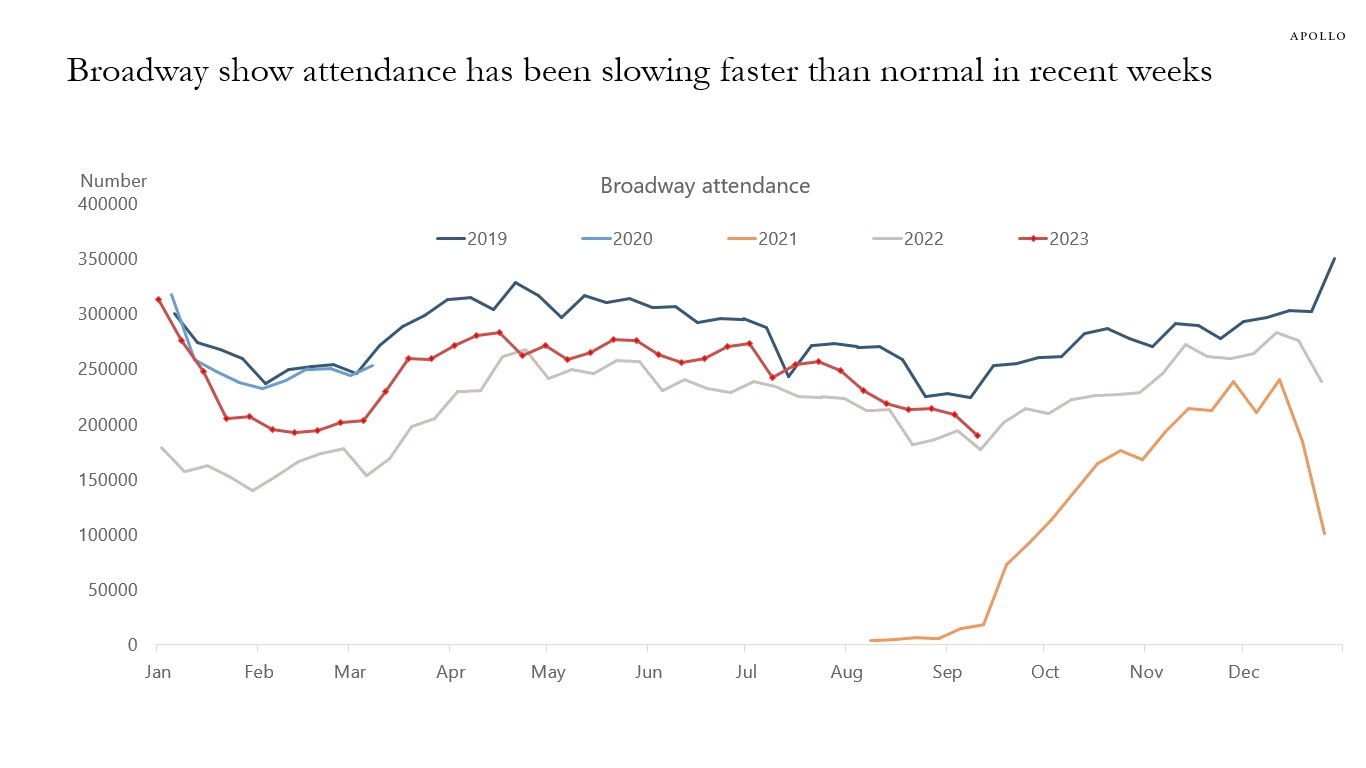
Source: Internet Broadway Database, Apollo Chief Economist See important disclaimers at the bottom of the page.
-
The 10 largest companies in the S&P500 make up 34% of the index, and these 10 mega-cap companies have an average P/E ratio of 50, see chart below.
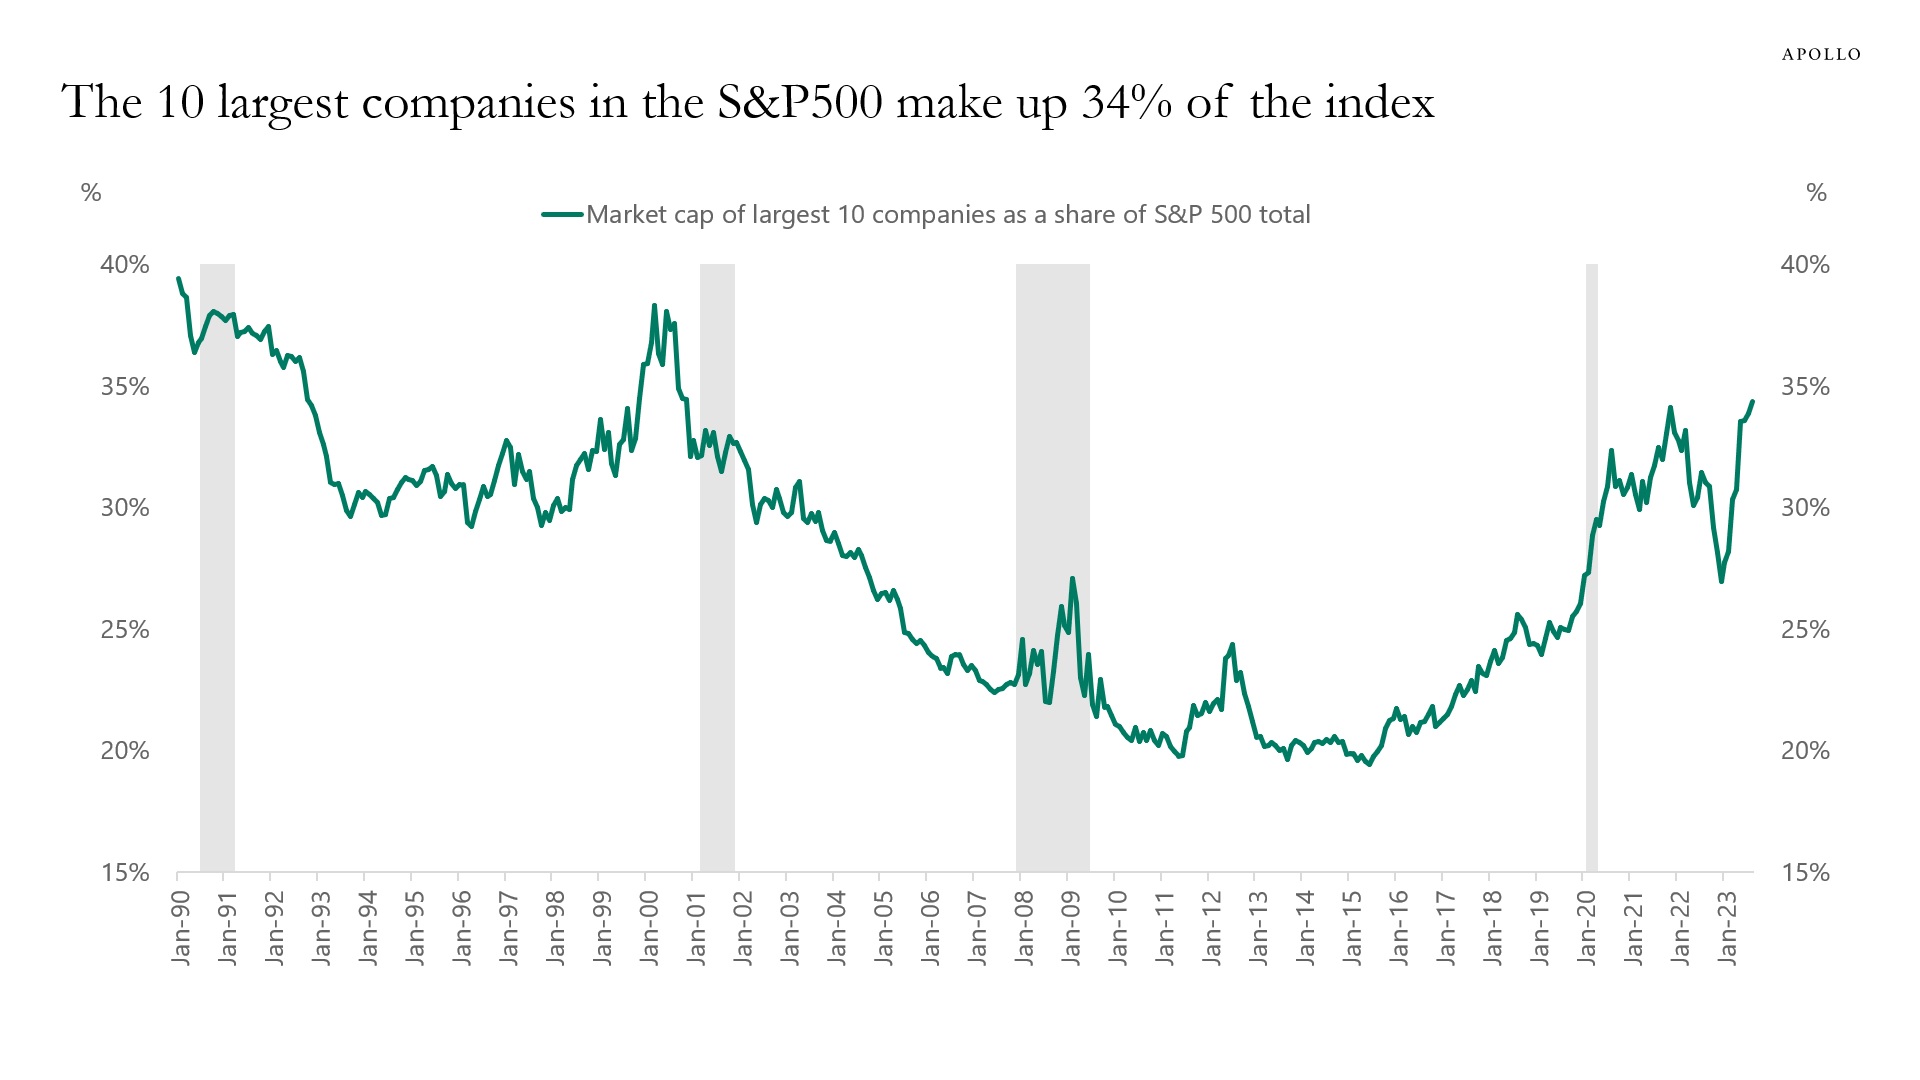
Source: Bloomberg, Apollo Chief Economist See important disclaimers at the bottom of the page.
-
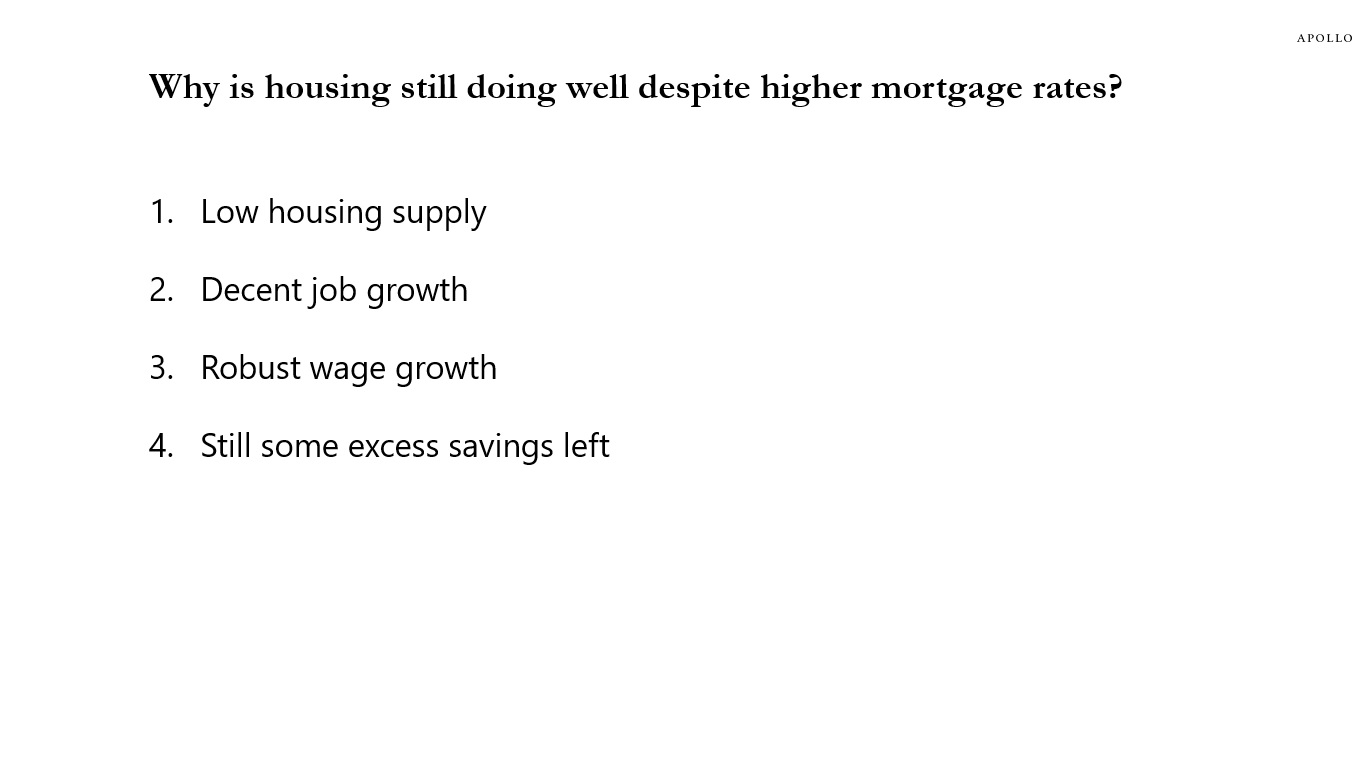
High mortgage rates continue to weigh on demand for housing.
But the inventory of new homes for sale remains very low.
Our latest outlook for the US housing market is available here, key charts inserted below.
Source: Apollo Chief Economist 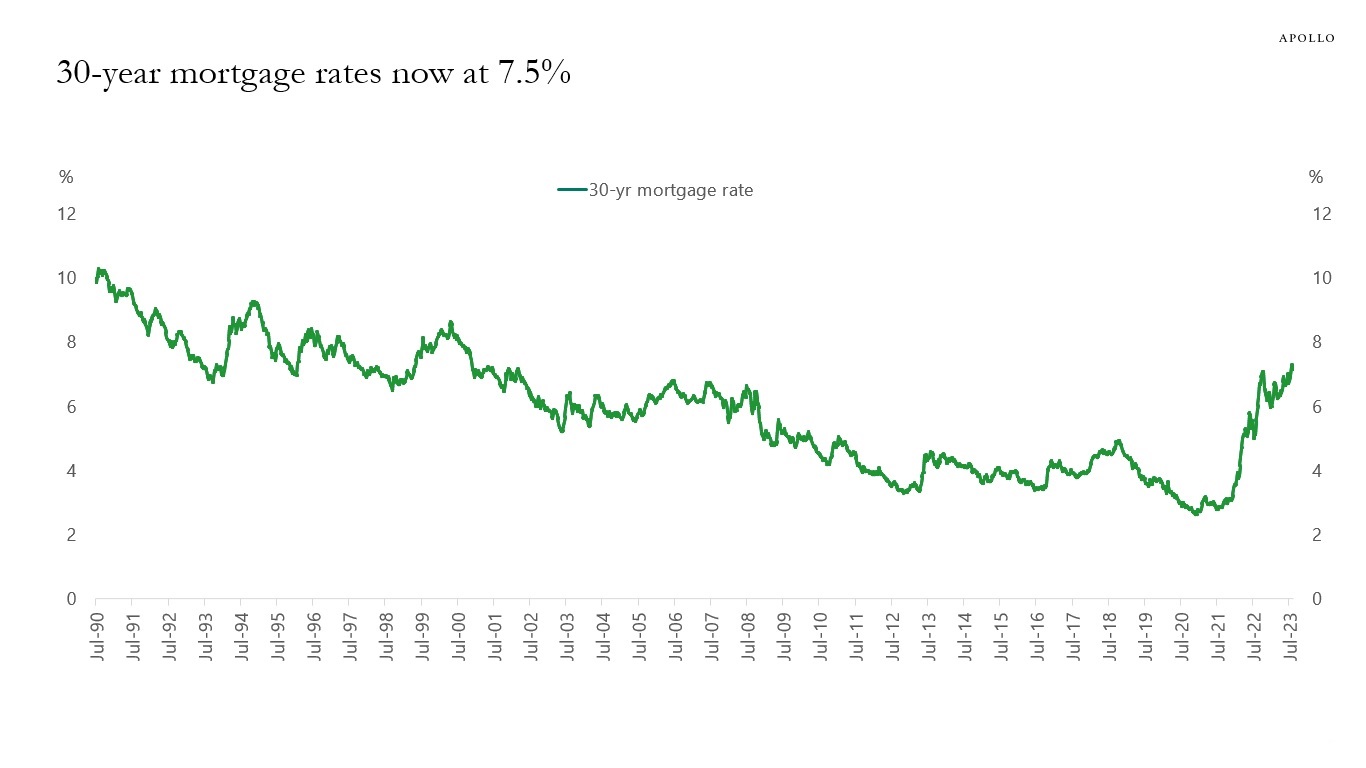
Source: Bloomberg, Apollo Chief Economist 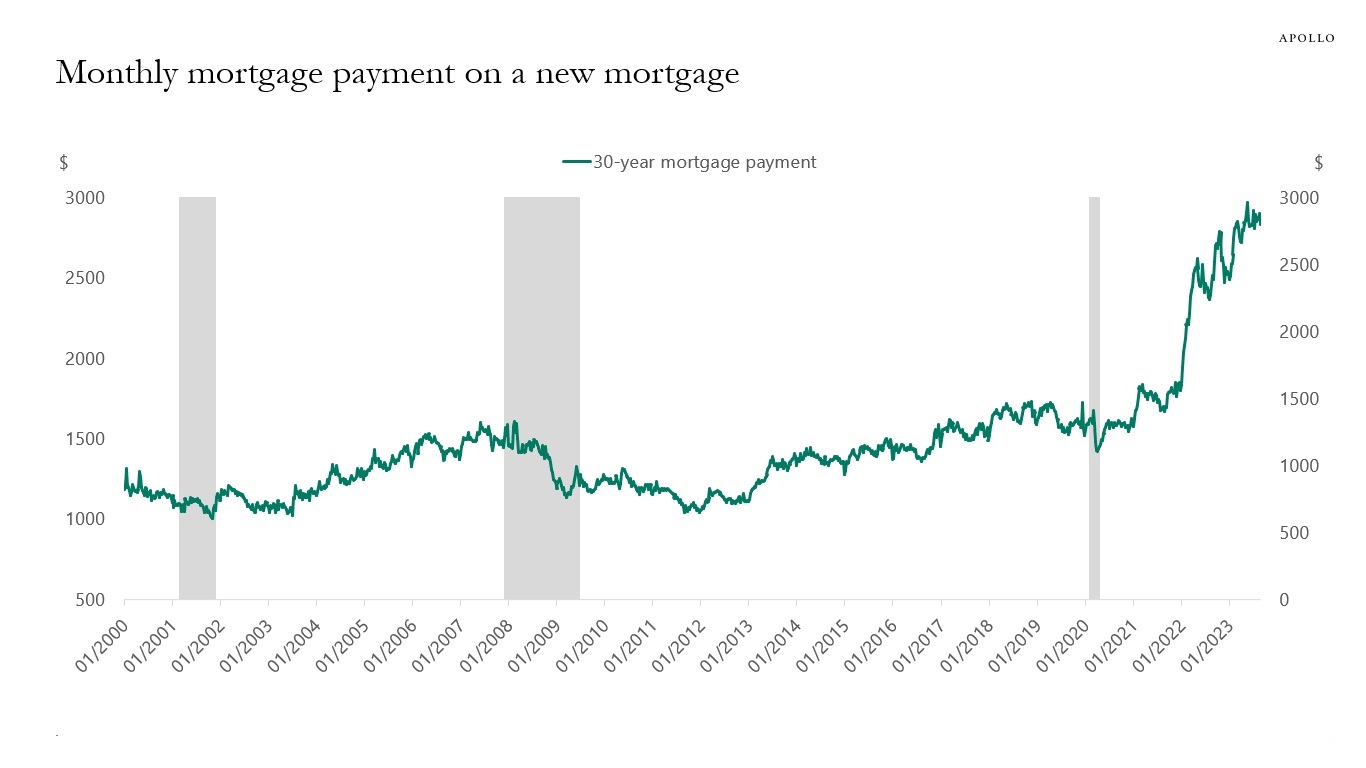
Source: Bloomberg L.P., Apollo Chief Economist. Note: Calculation of monthly payment using the 30-year purchase loan application size and the 30-year effective rate. 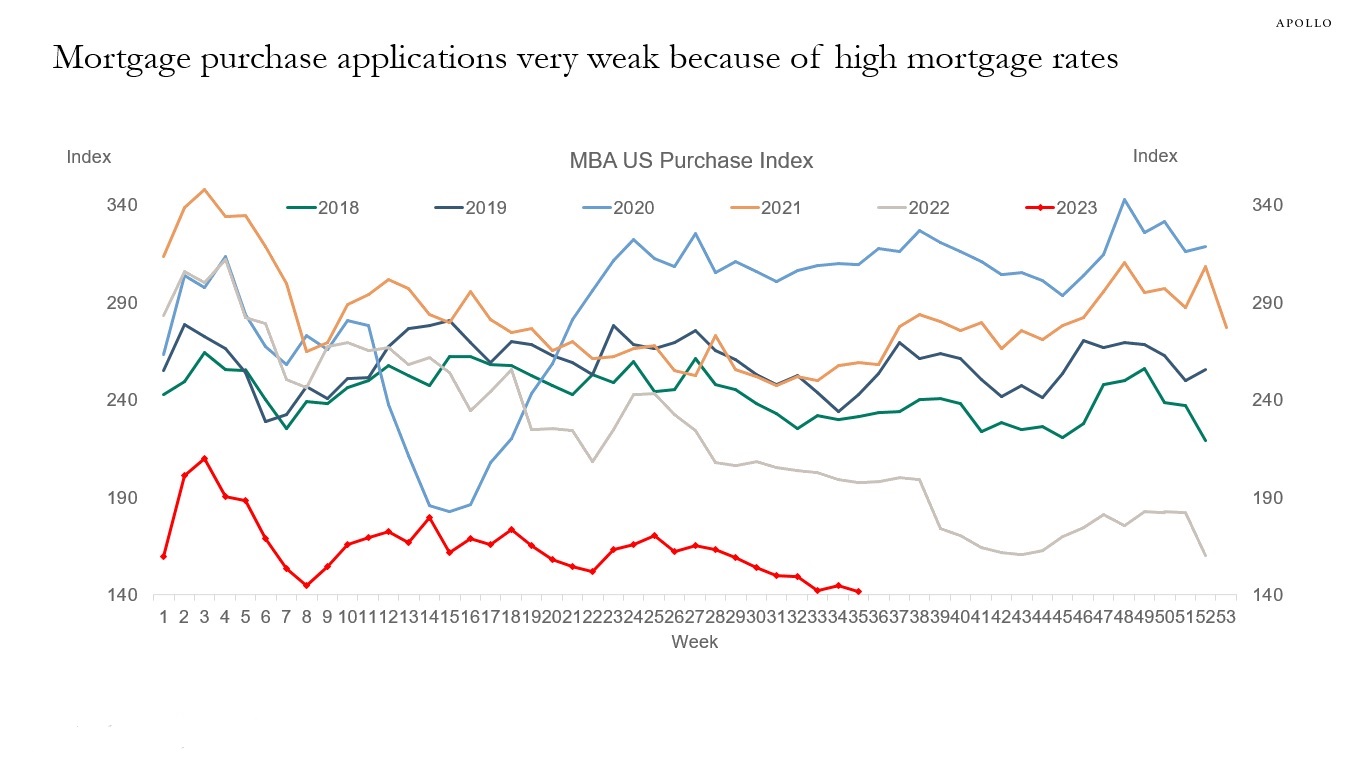
Source: Mortgage Bankers Association, Bloomberg, Apollo Chief Economist 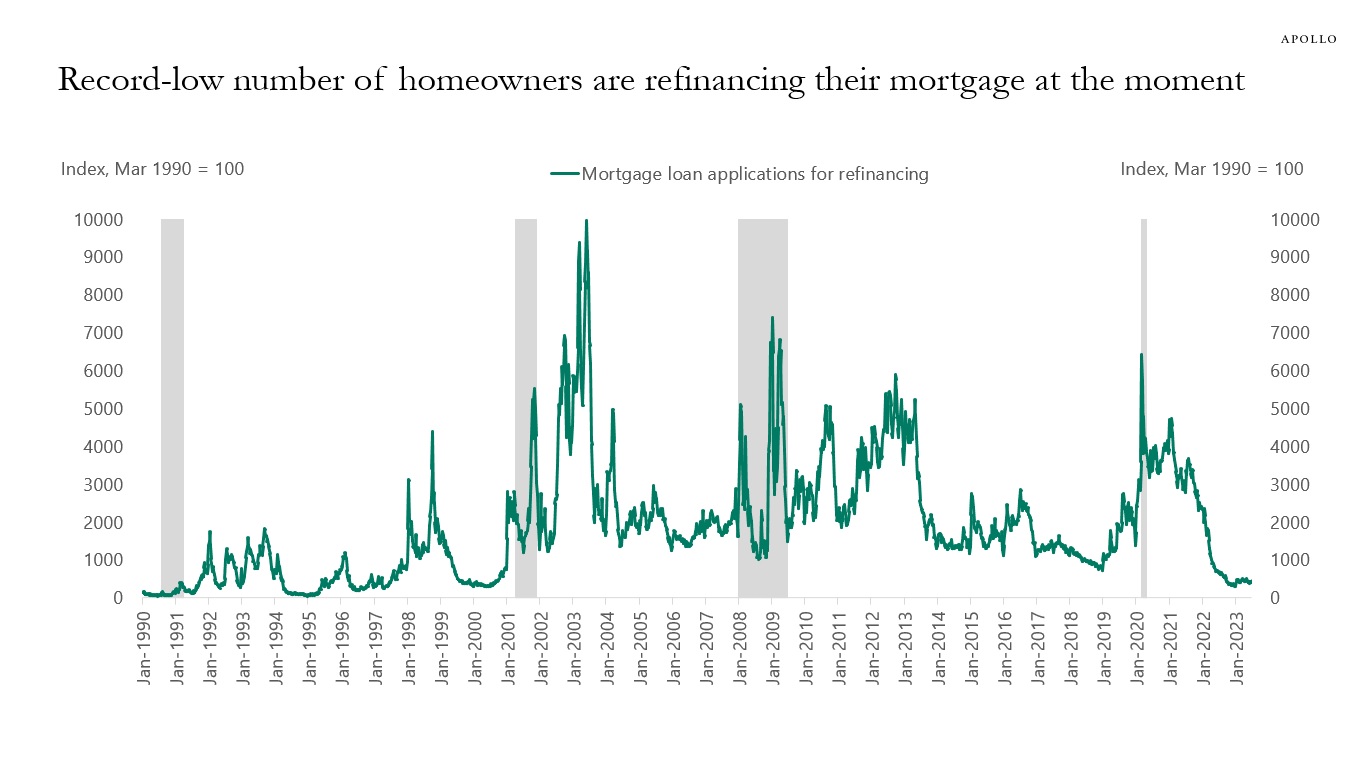
Source: Mortgage Bankers Association, Bloomberg, Apollo Chief Economist 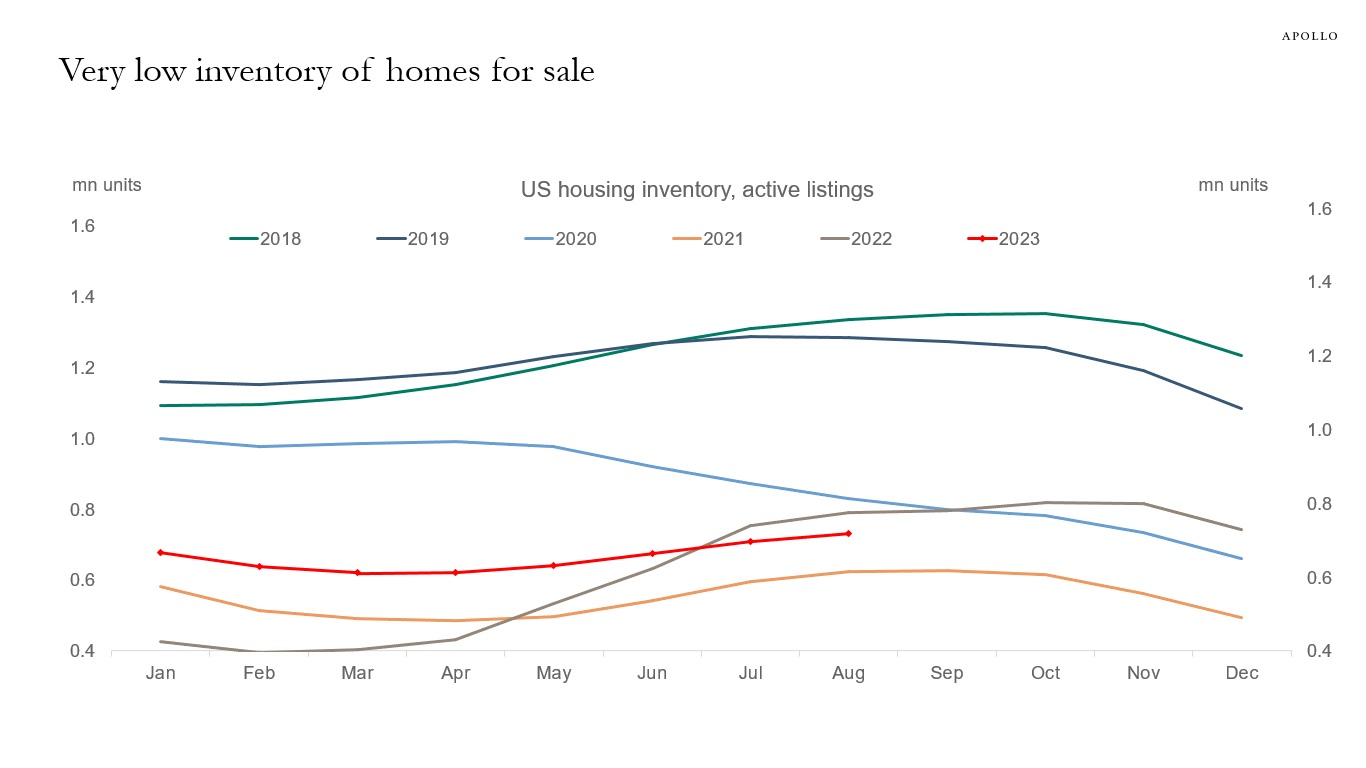
Source: Realtor.com, Apollo Chief Economist 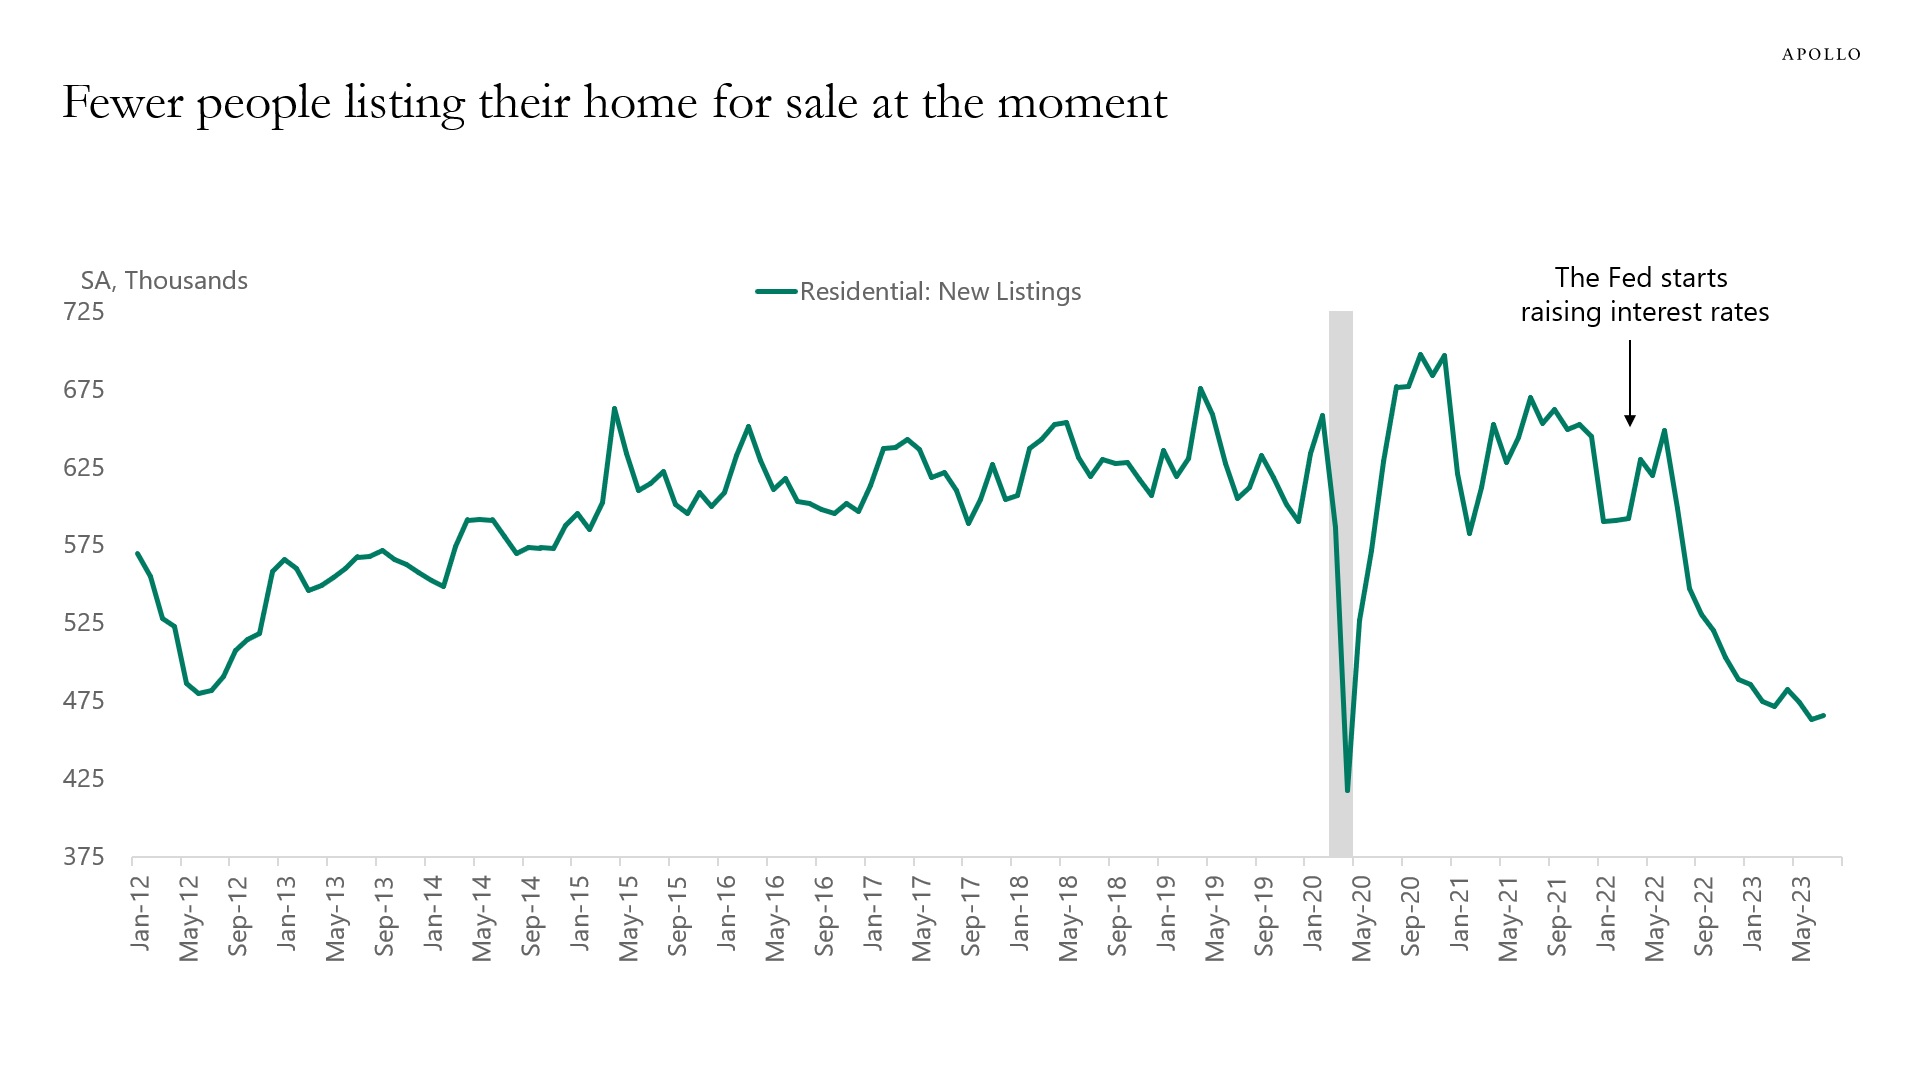
Source: Redfin, Haver Analytics, Apollo Chief Economist 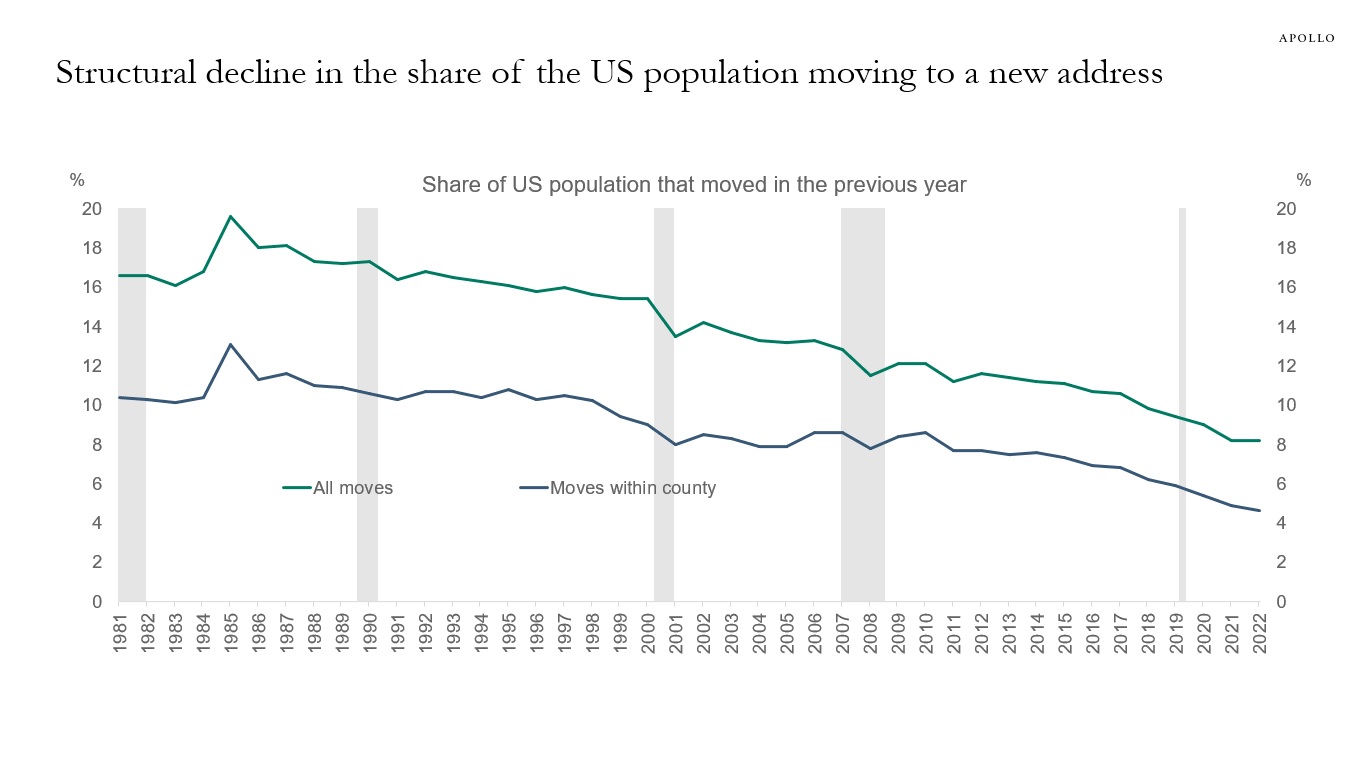
Source: Census CPS, Apollo Chief Economist 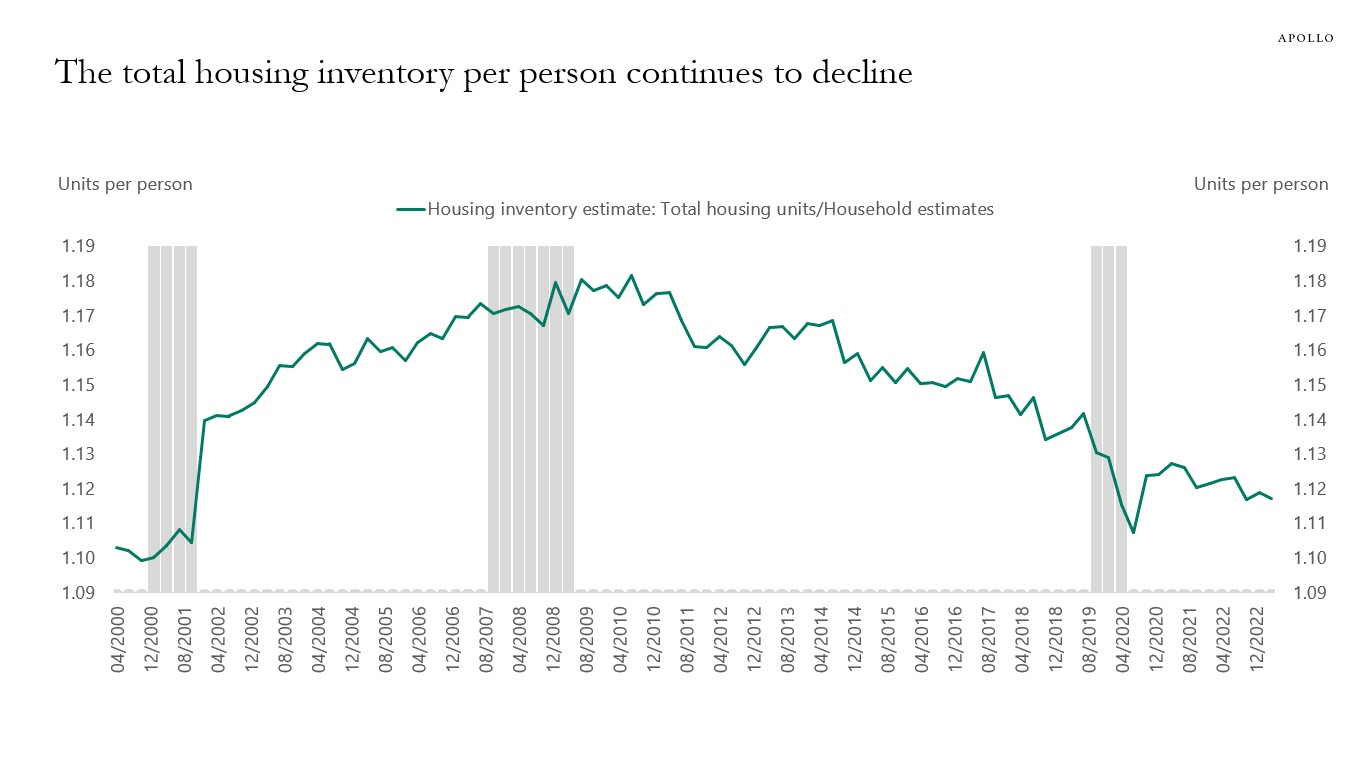
Source: Census Bureau, FRED, Apollo Chief Economist 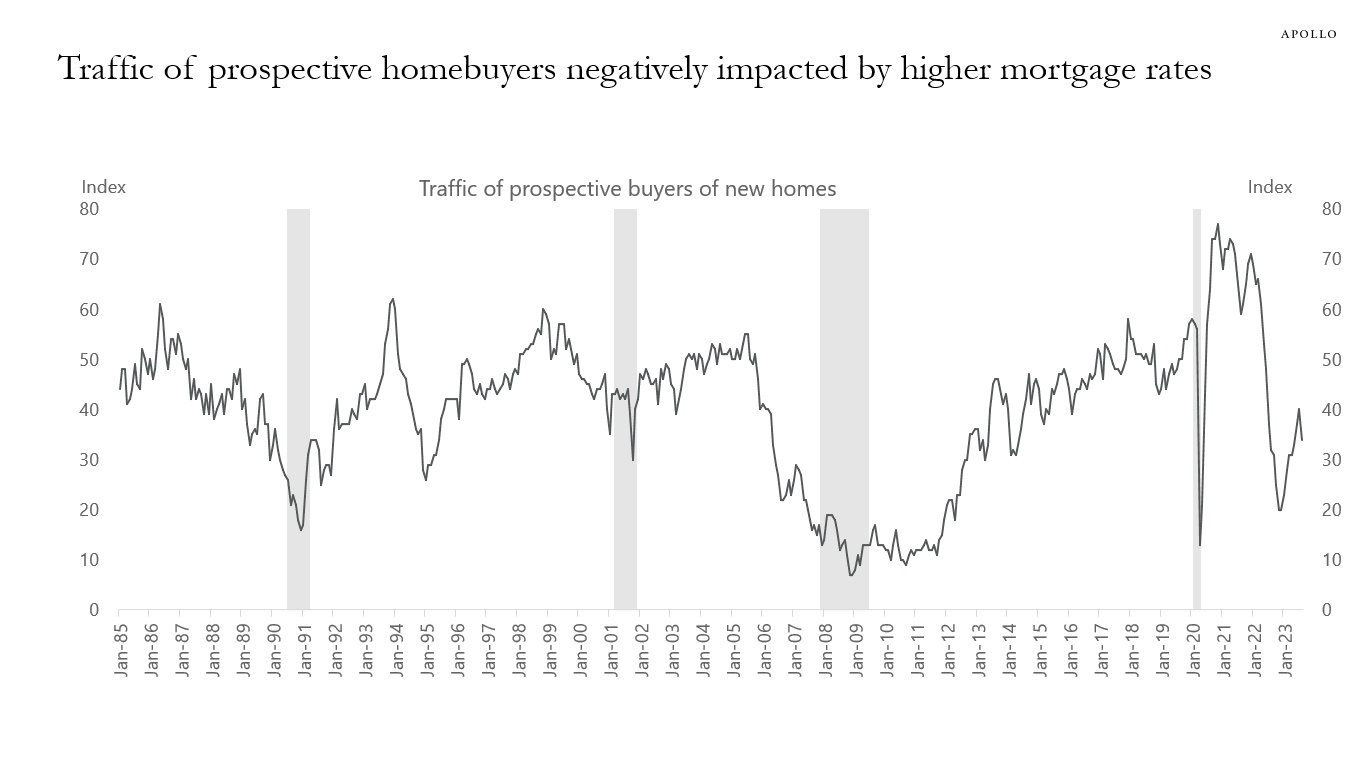
Source: National Association of Homebuilders, Bloomberg, Apollo Chief Economist 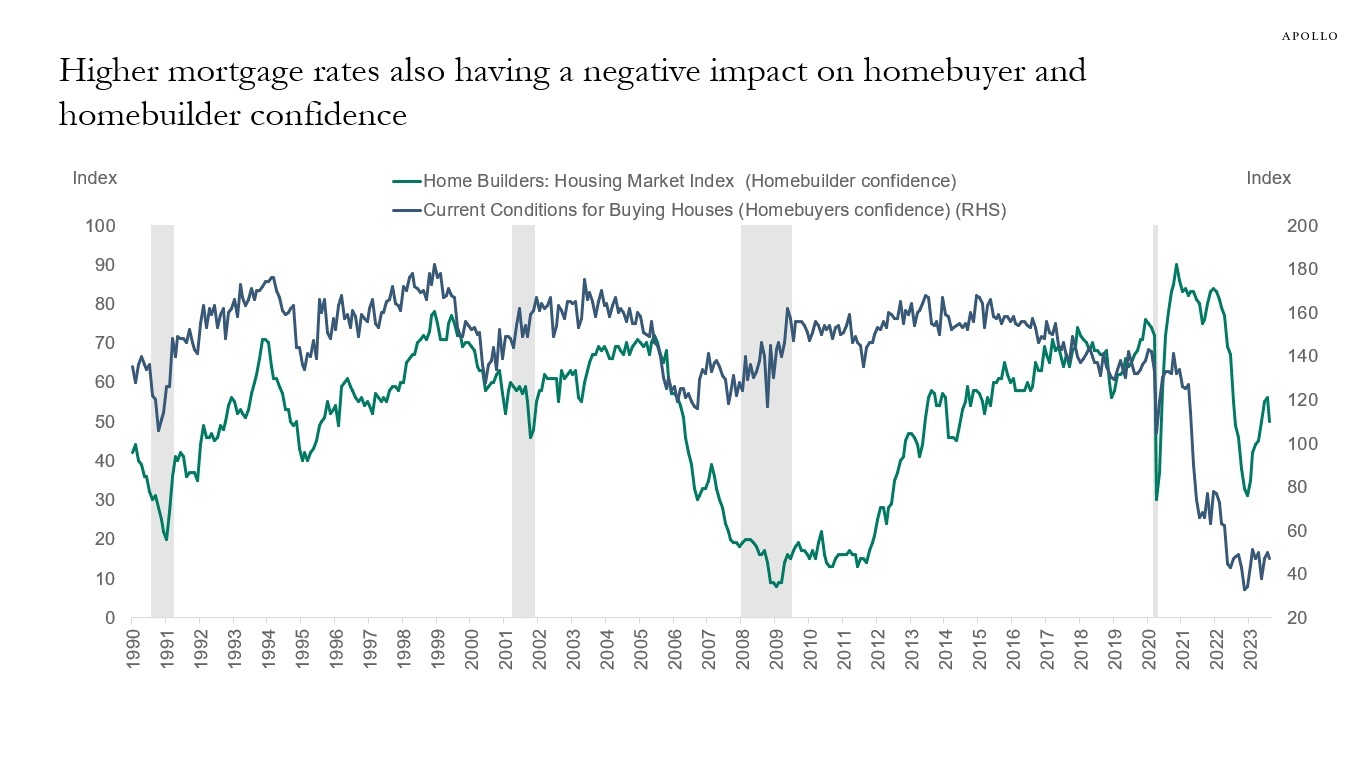
Source: University of Michigan, NAHB, Haver Analytics, Apollo Chief Economist 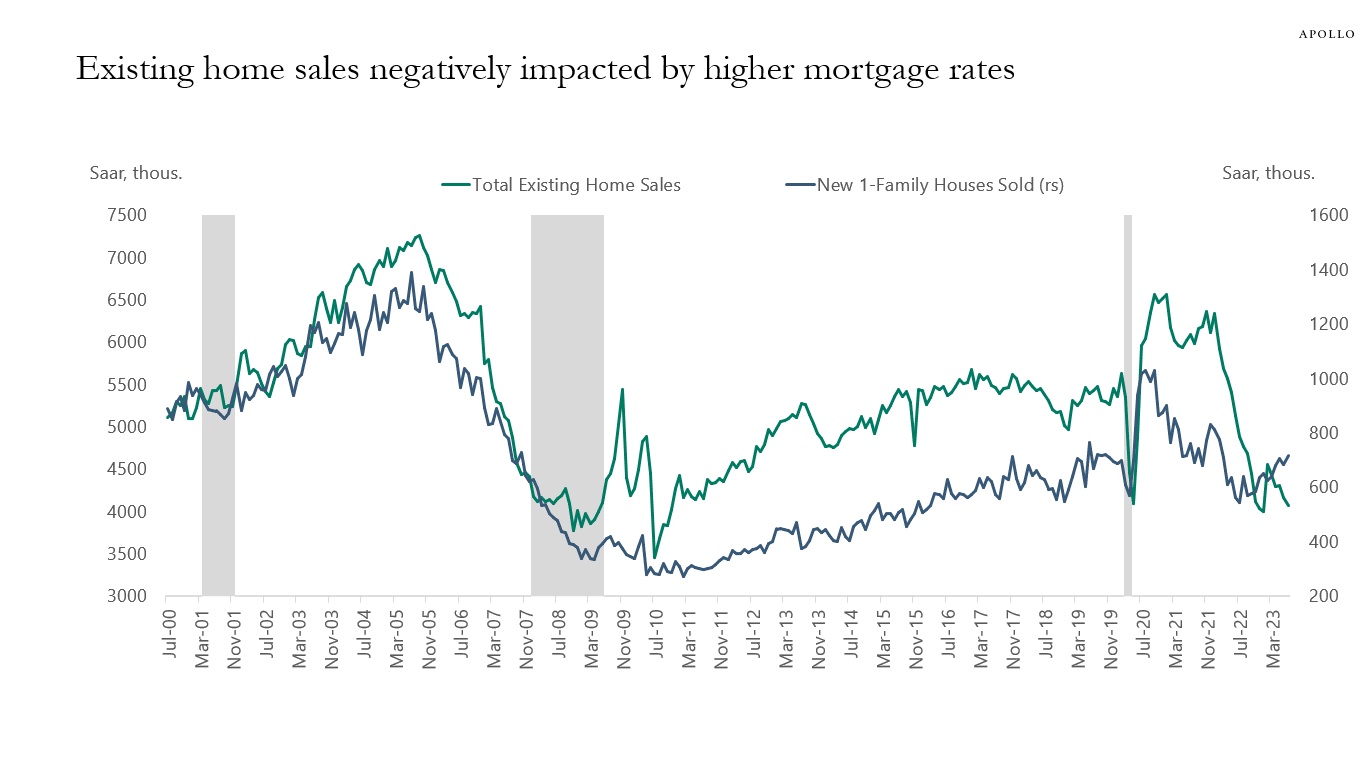
Source: Census Bureau, NAR, Haver, Apollo Chief Economist. Forecast is Bloomberg consensus. 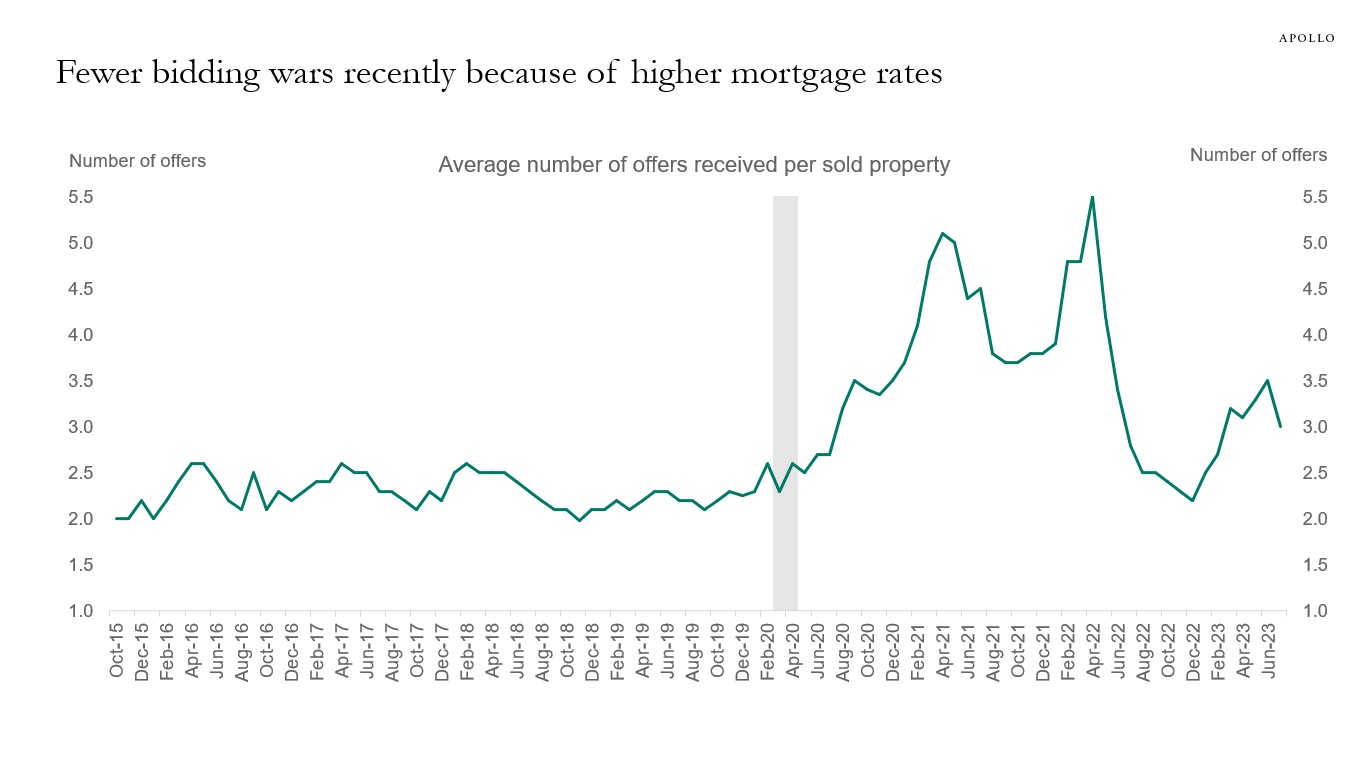
Source: NAR, Apollo Chief Economist 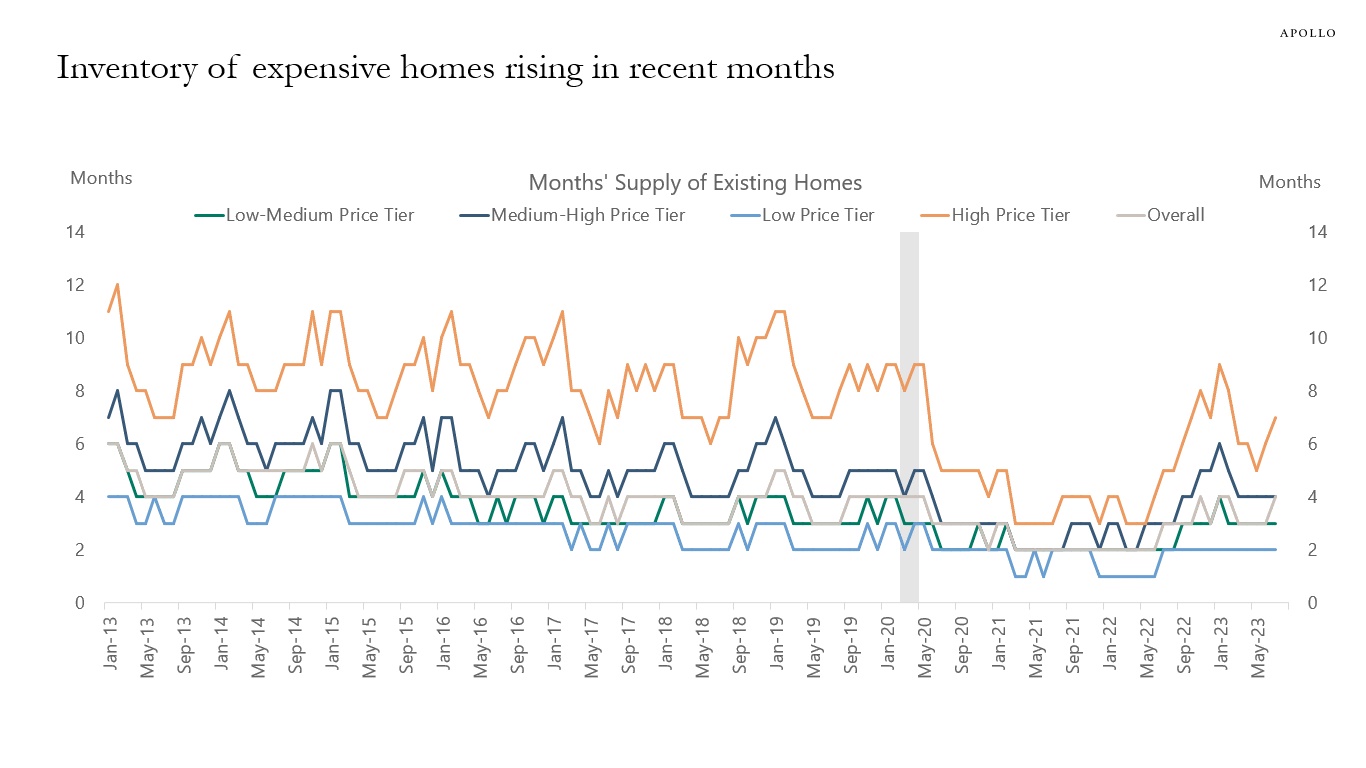
Source: American Enterprise Institute, Haver, Apollo Chief Economist 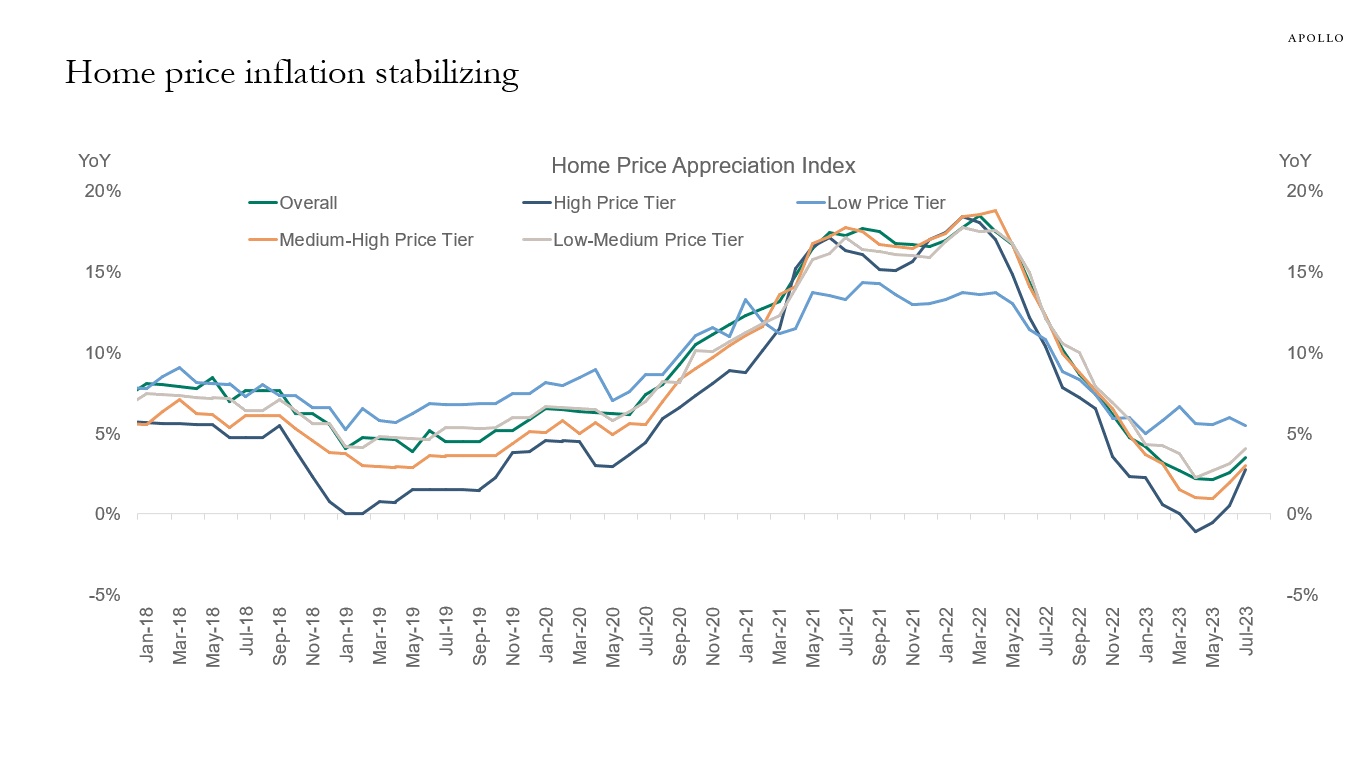
Source: American Enterprise Institute, Haver, Apollo Chief Economist 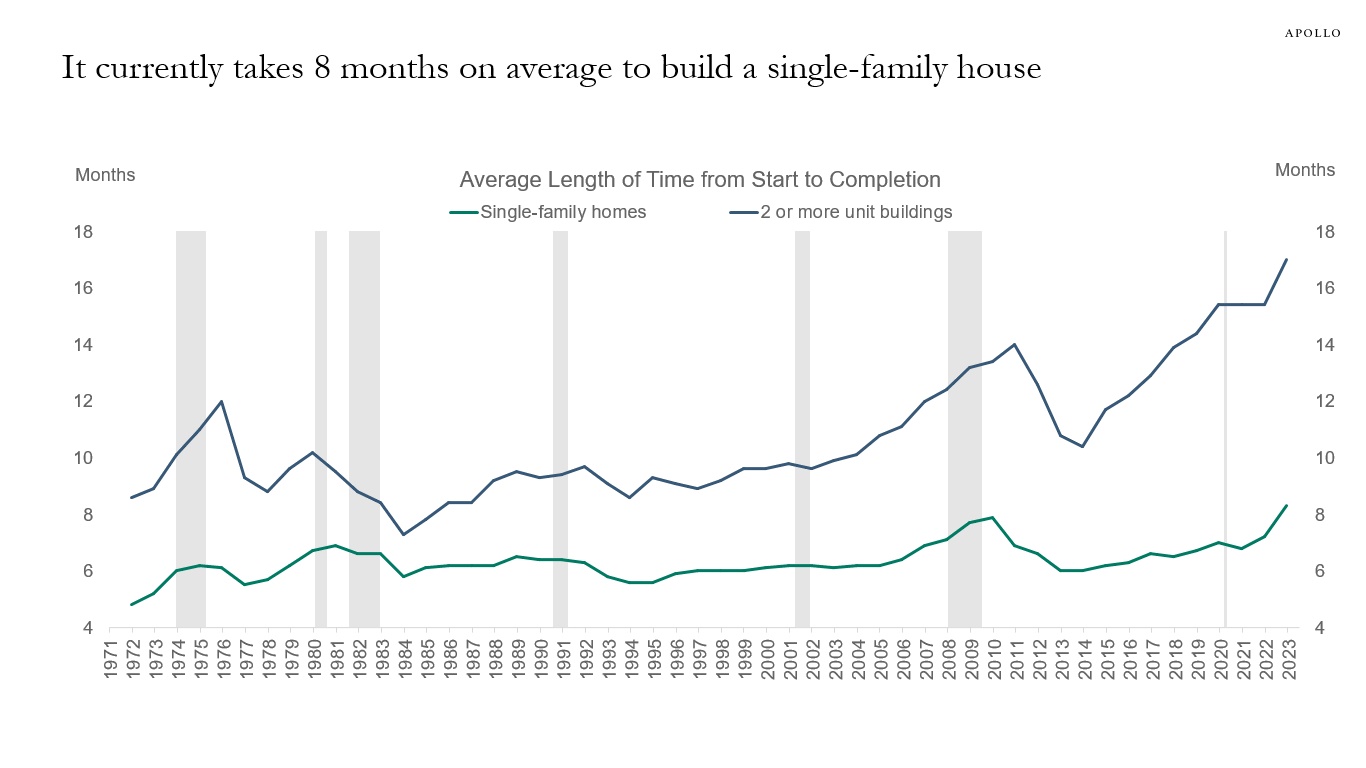
Source: Census, Haver Analytics, Apollo Chief Economist. Note: Single-family homes are one-unit buildings. 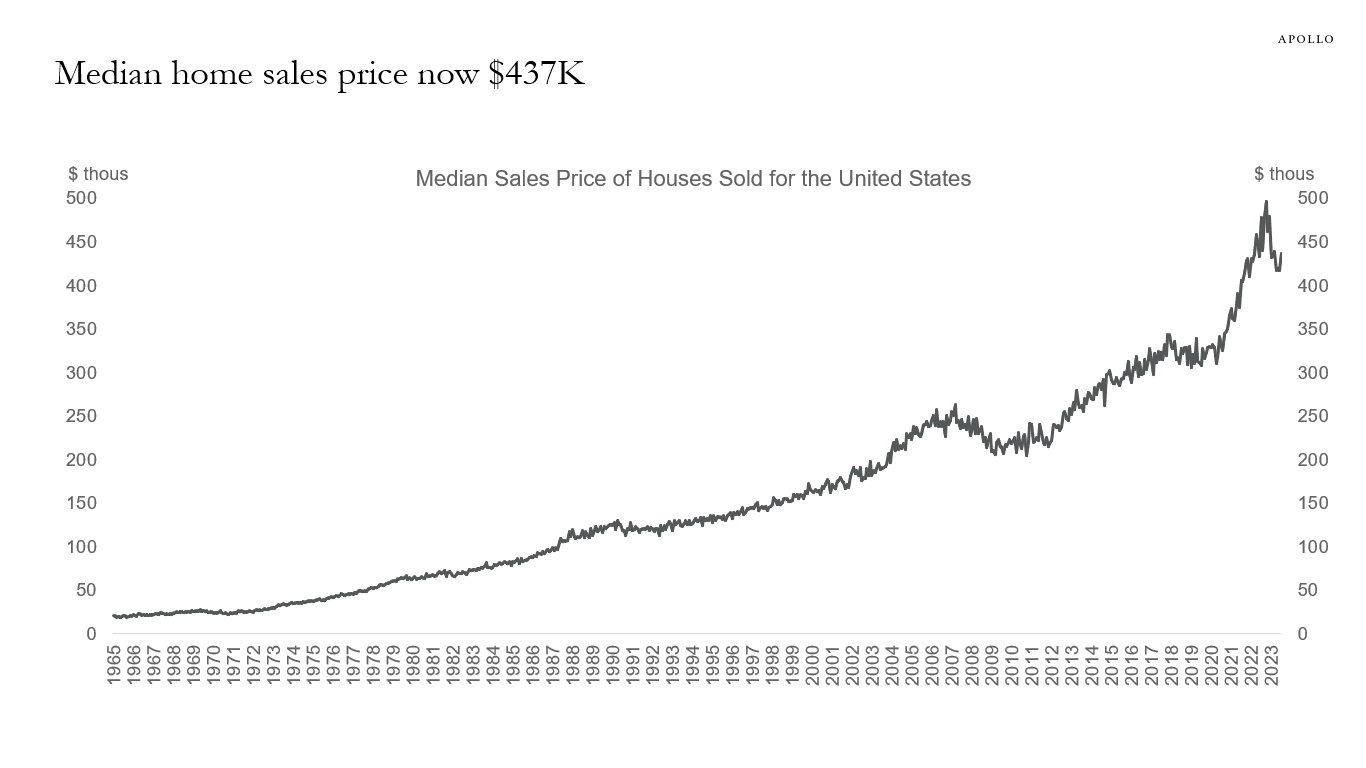
Source: Census Bureau, Apollo Chief Economist See important disclaimers at the bottom of the page.
-
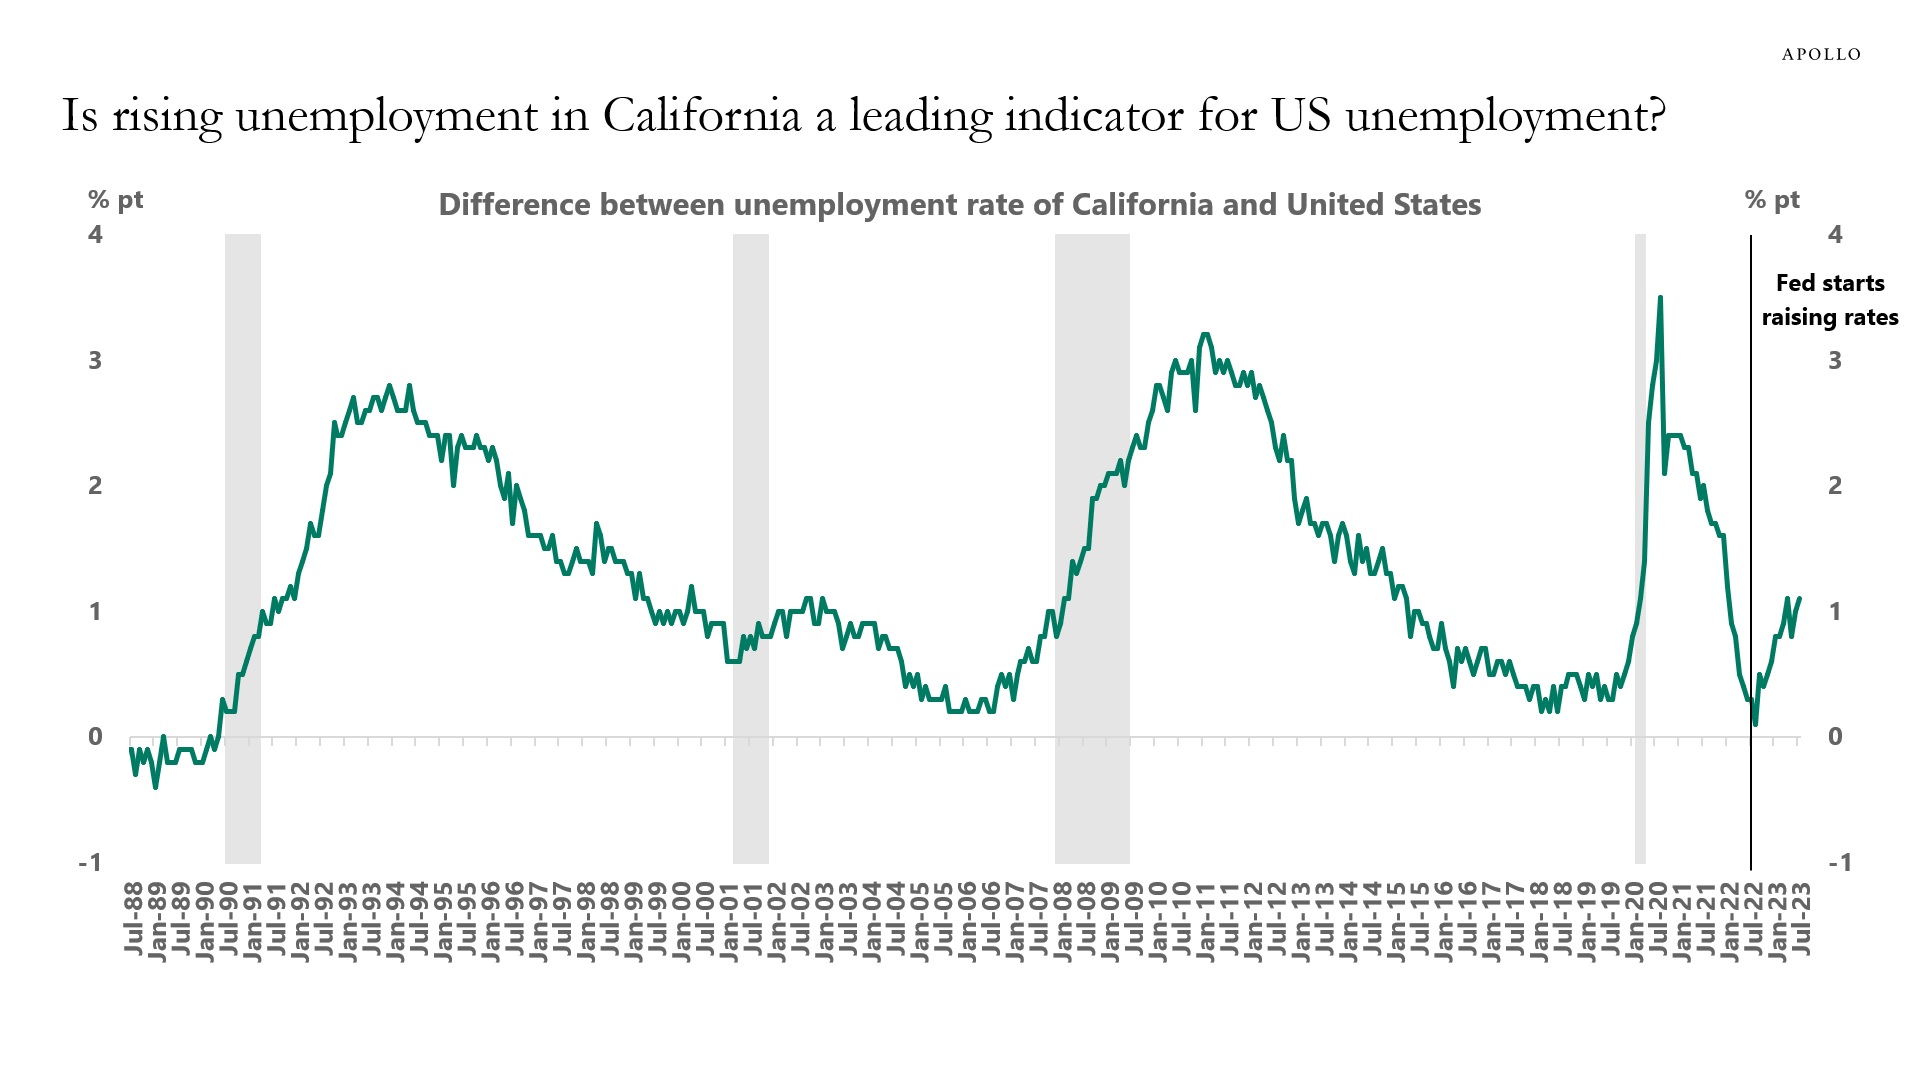
Fed hikes have had a very negative effect on venture capital and tech firms because they have little or no cash flows and require financing that has become much more expensive.
This is likely the reason why the unemployment rate since the Fed started raising rates has increased more in California than in the rest of the country, see chart below.
High costs of financing slows down capital formation. That is how monetary policy works. With the Fed on hold for another nine months, the ongoing softening in the labor market continues.
Source: BLS, Bloomberg, Apollo Chief Economist See important disclaimers at the bottom of the page.
-
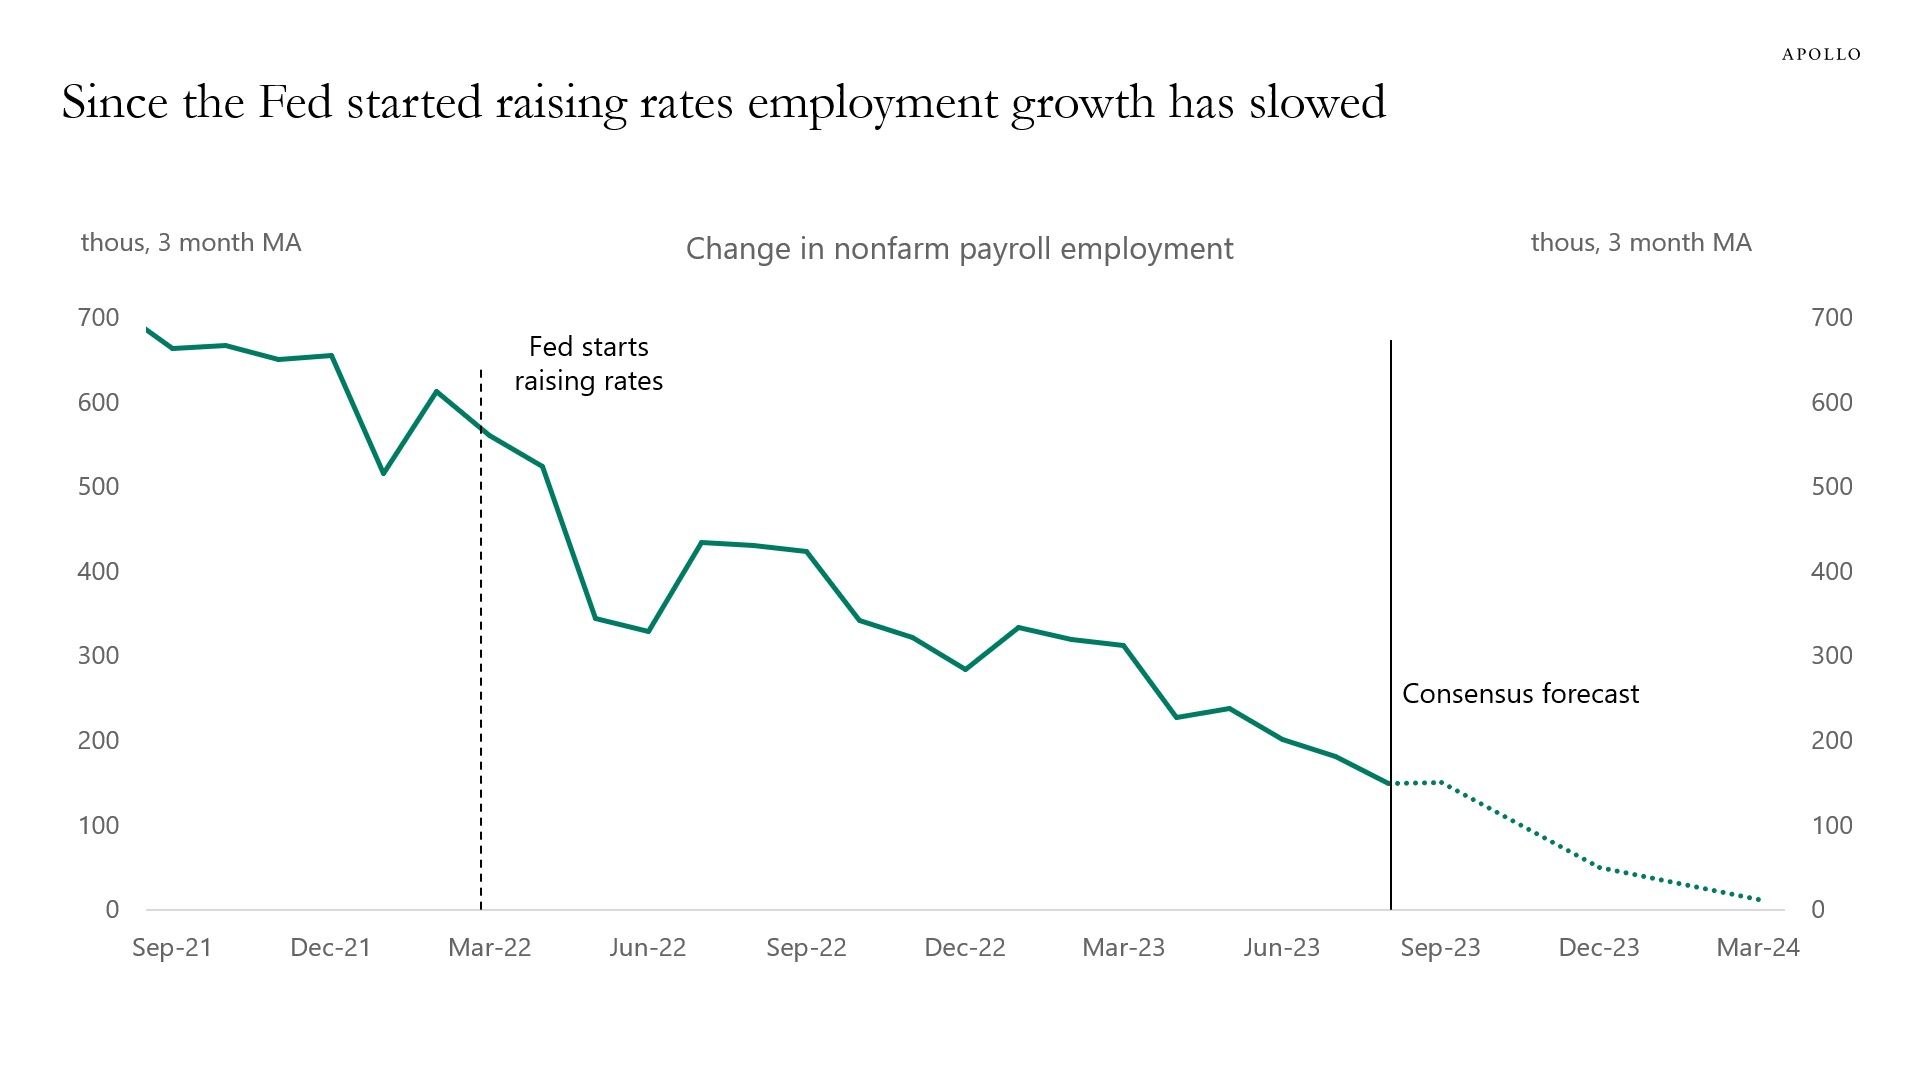
Since the Fed started raising interest rates, the labor market has gradually softened.
Specifically, employment growth is slowing, there are fewer job openings, the work week is shorter, the quits rate is lower, and wage growth is declining for job switchers, see charts below.
With the Fed keeping interest rates at these high levels for another nine months, it is unlikely that the lines in these charts will suddenly start moving sideways.
The likely scenario is that the trends in these charts continue. In short, more weakness in the economic data is coming as Fed hikes bite harder and harder on consumers and firms.
Source: BLS, Haver Analytics, Apollo Chief Economist 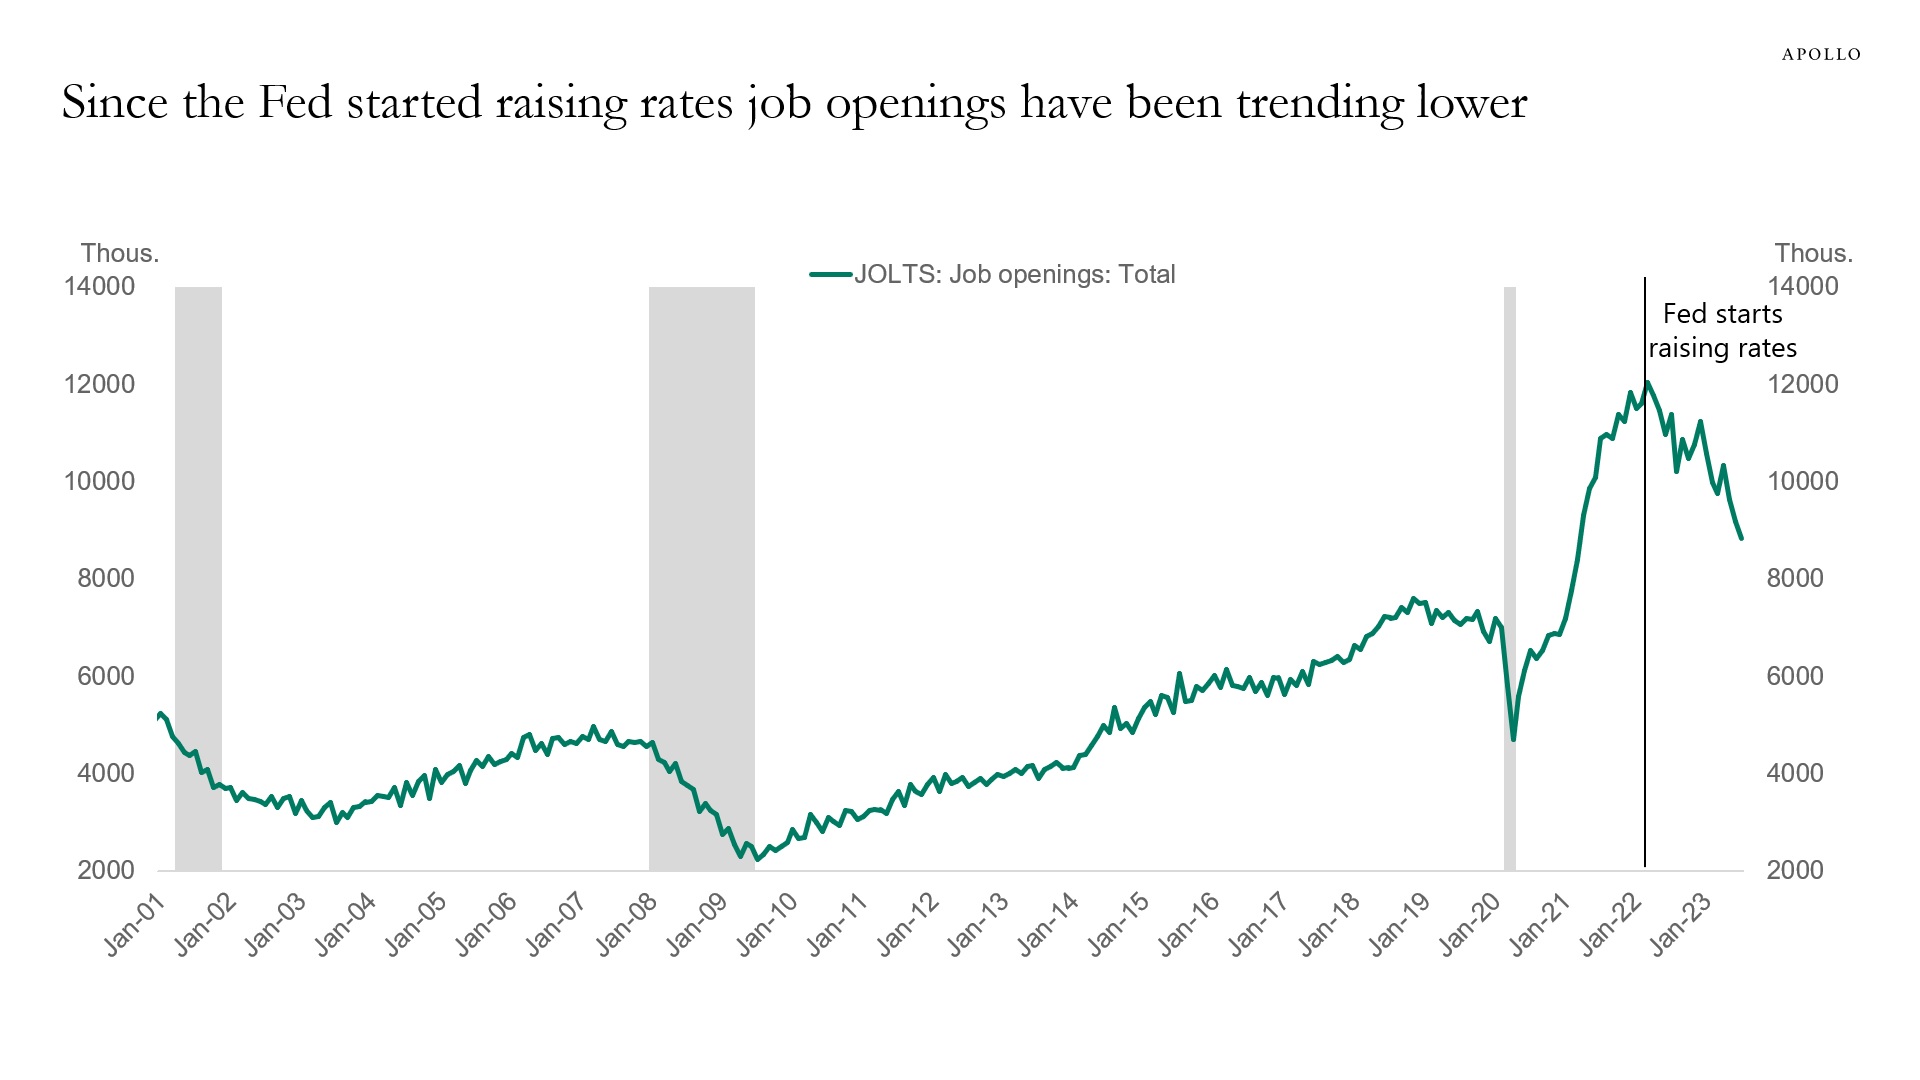
Source: BLS, Haver, Apollo Chief Economist 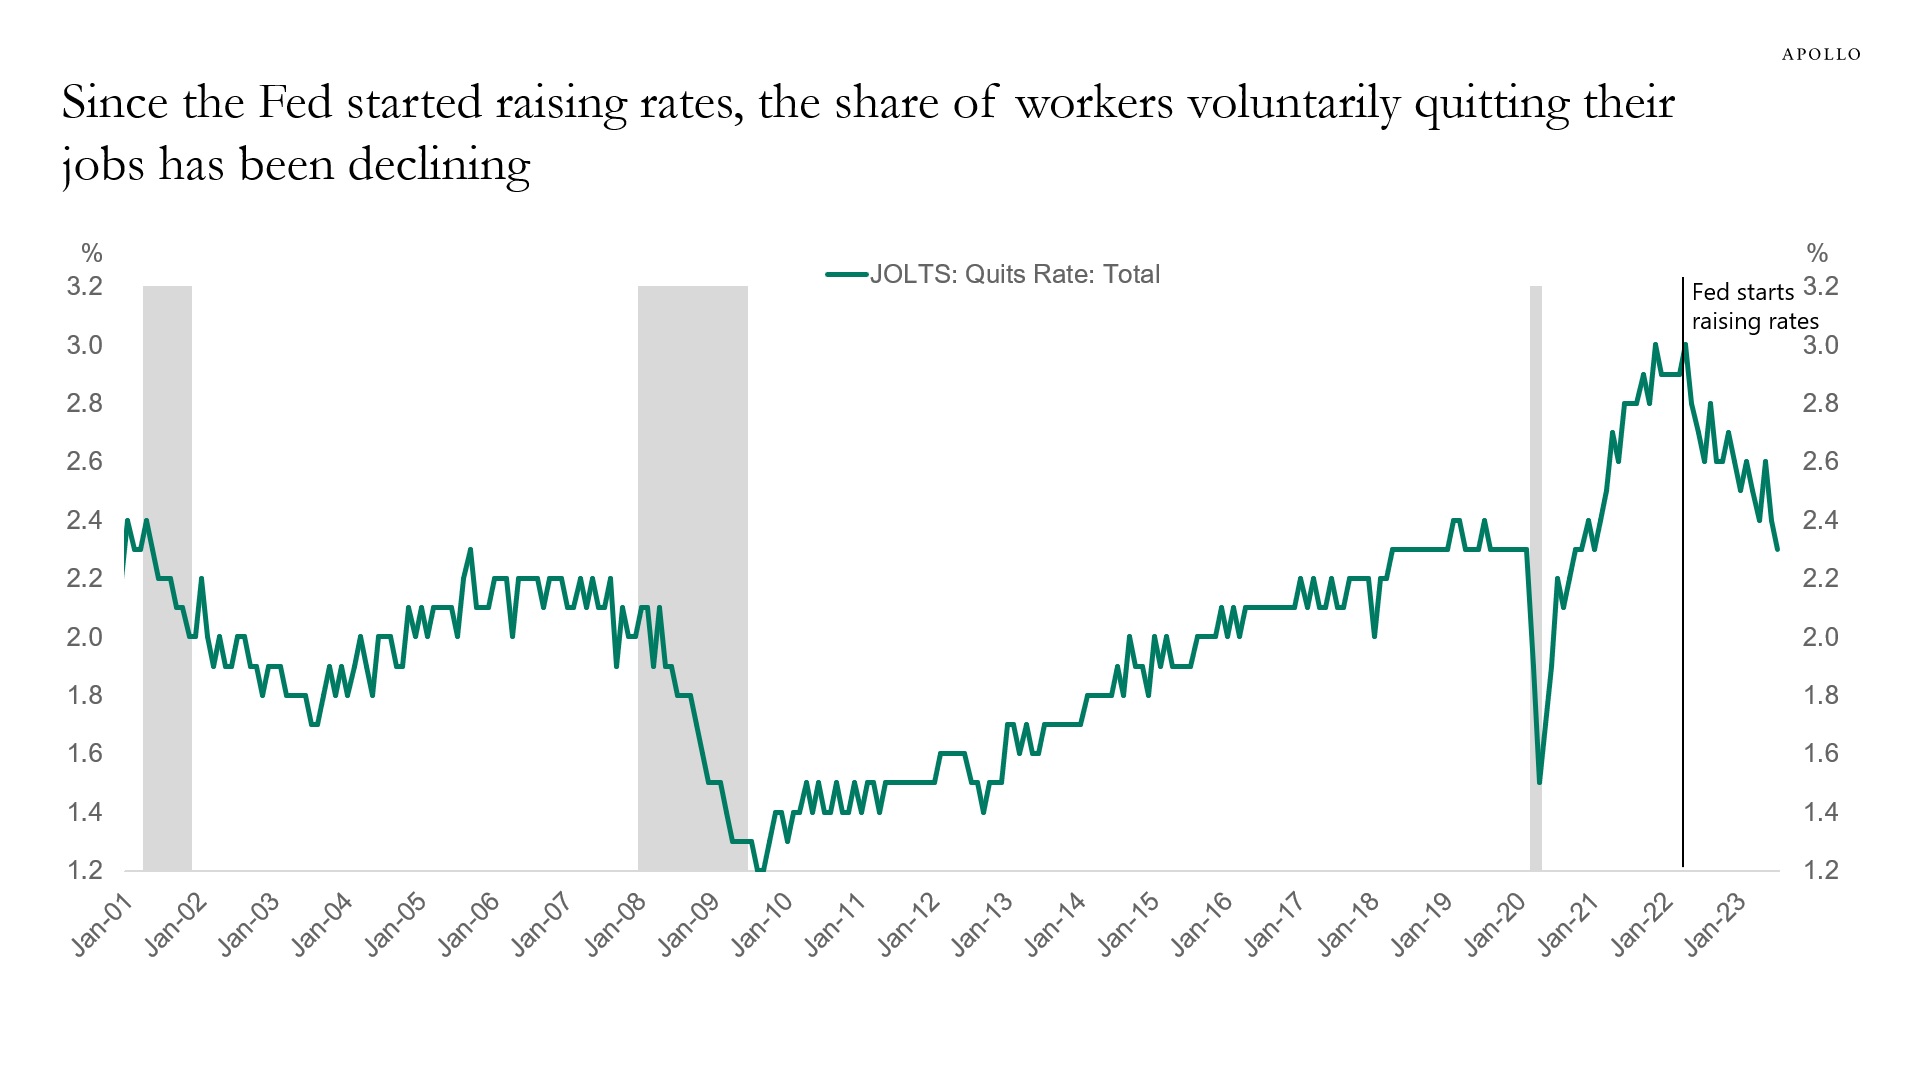
Source: BLS, Haver, Apollo Chief Economist 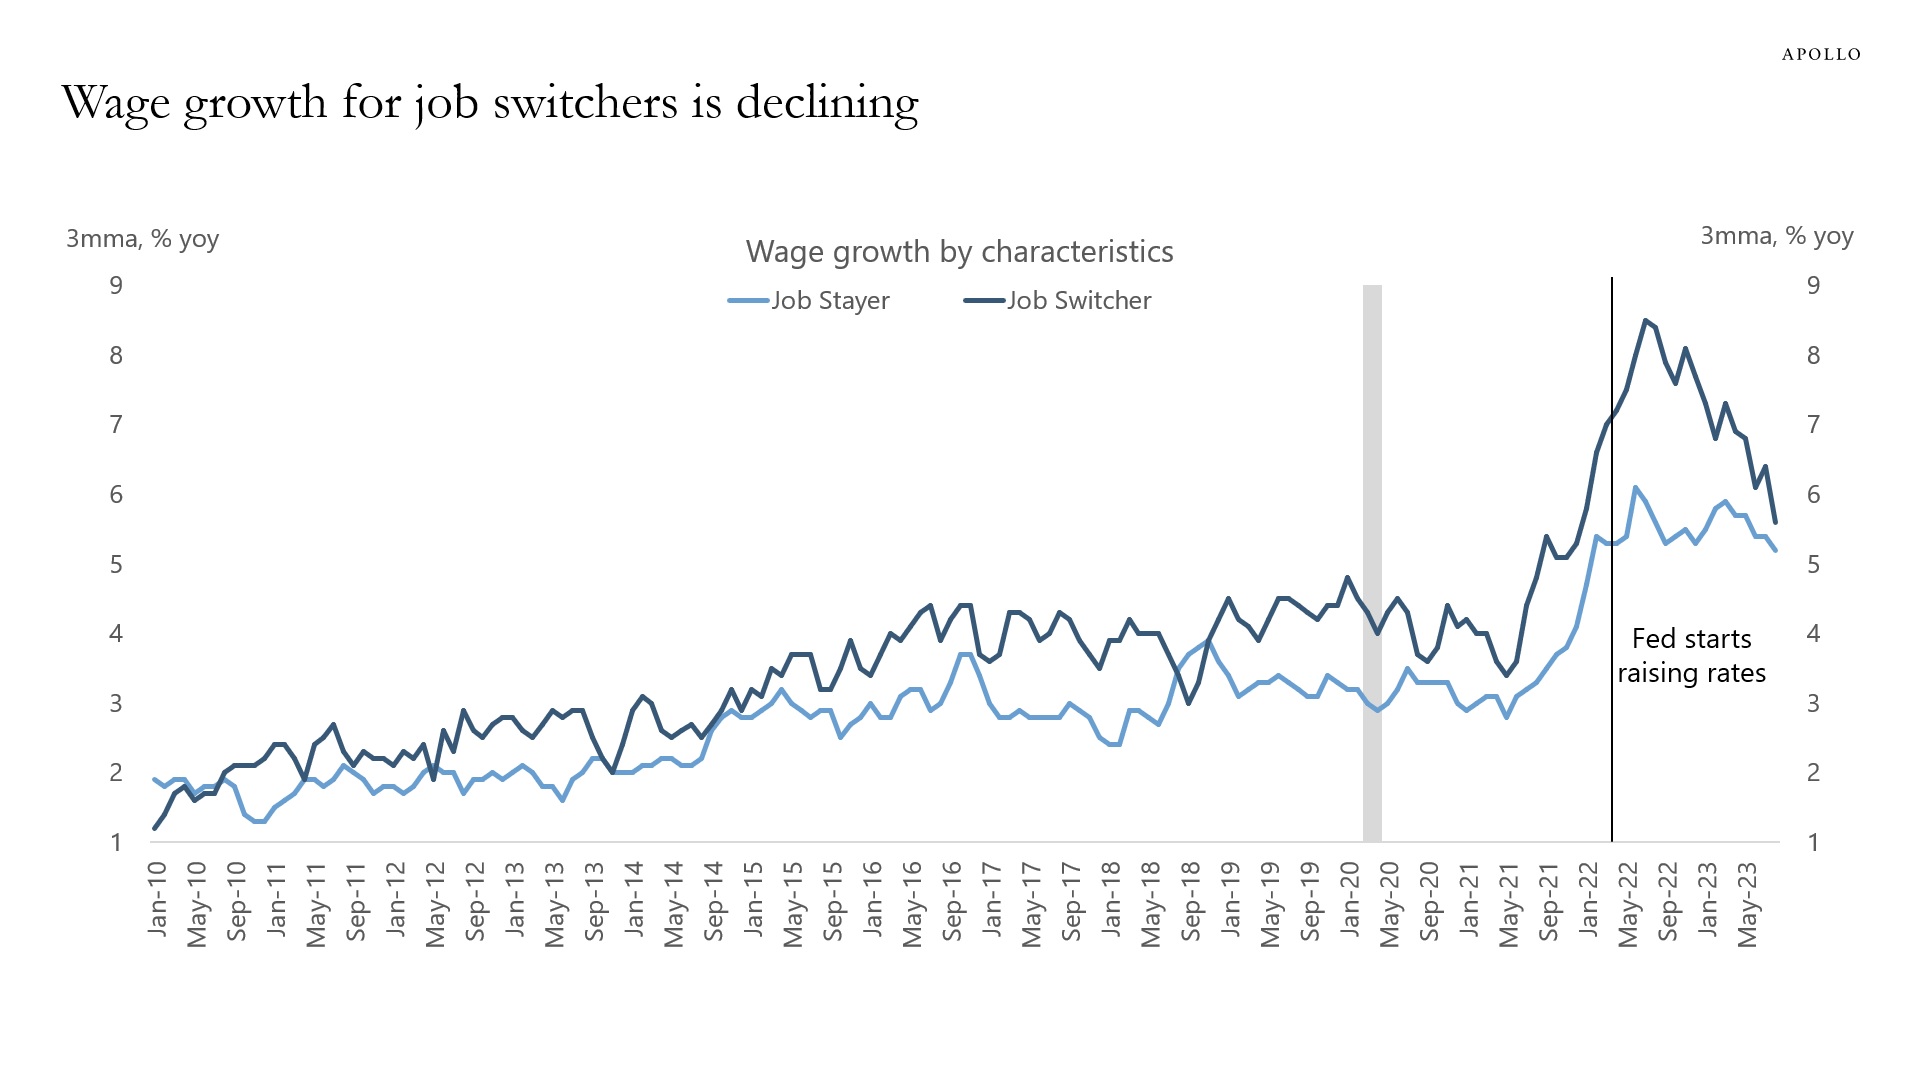
Source: FRB of Atlanta, Haver, Apollo Chief Economist 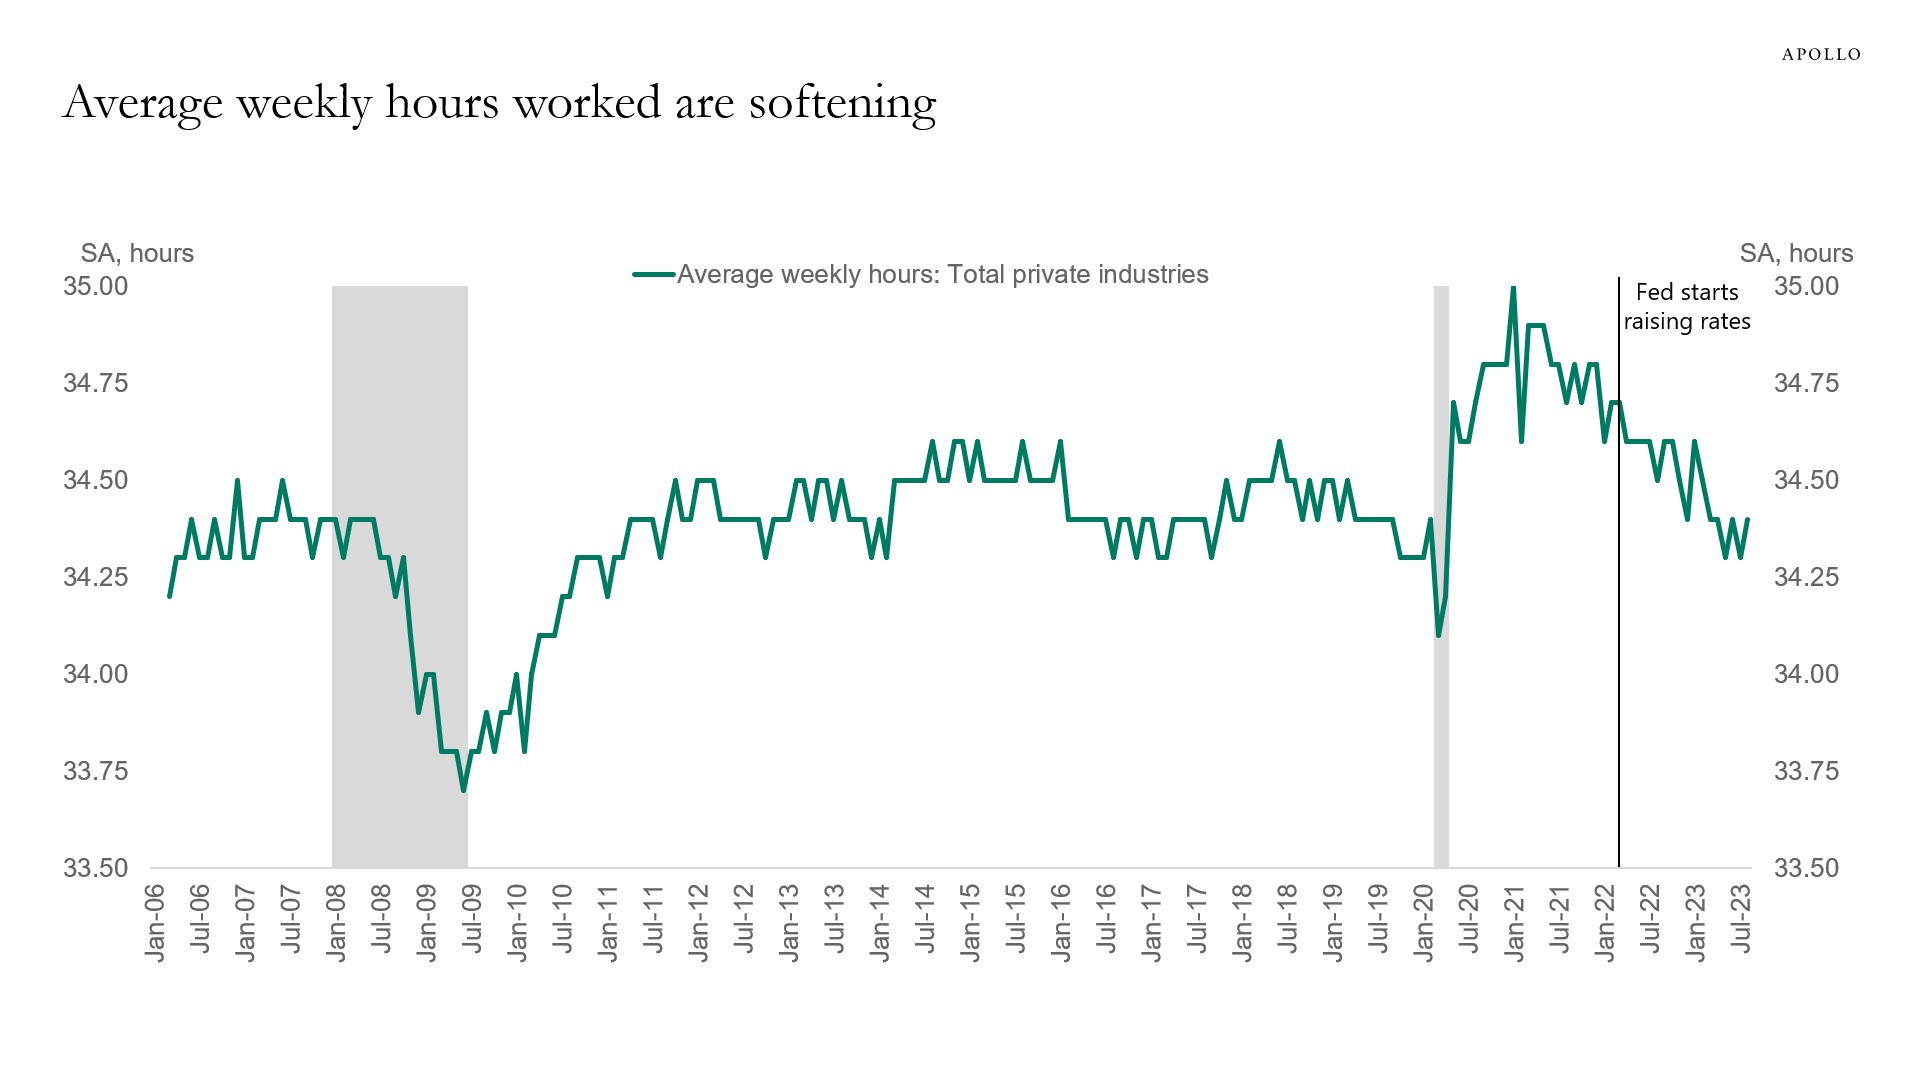
Source: BLS, Haver, Apollo Chief Economist See important disclaimers at the bottom of the page.
-
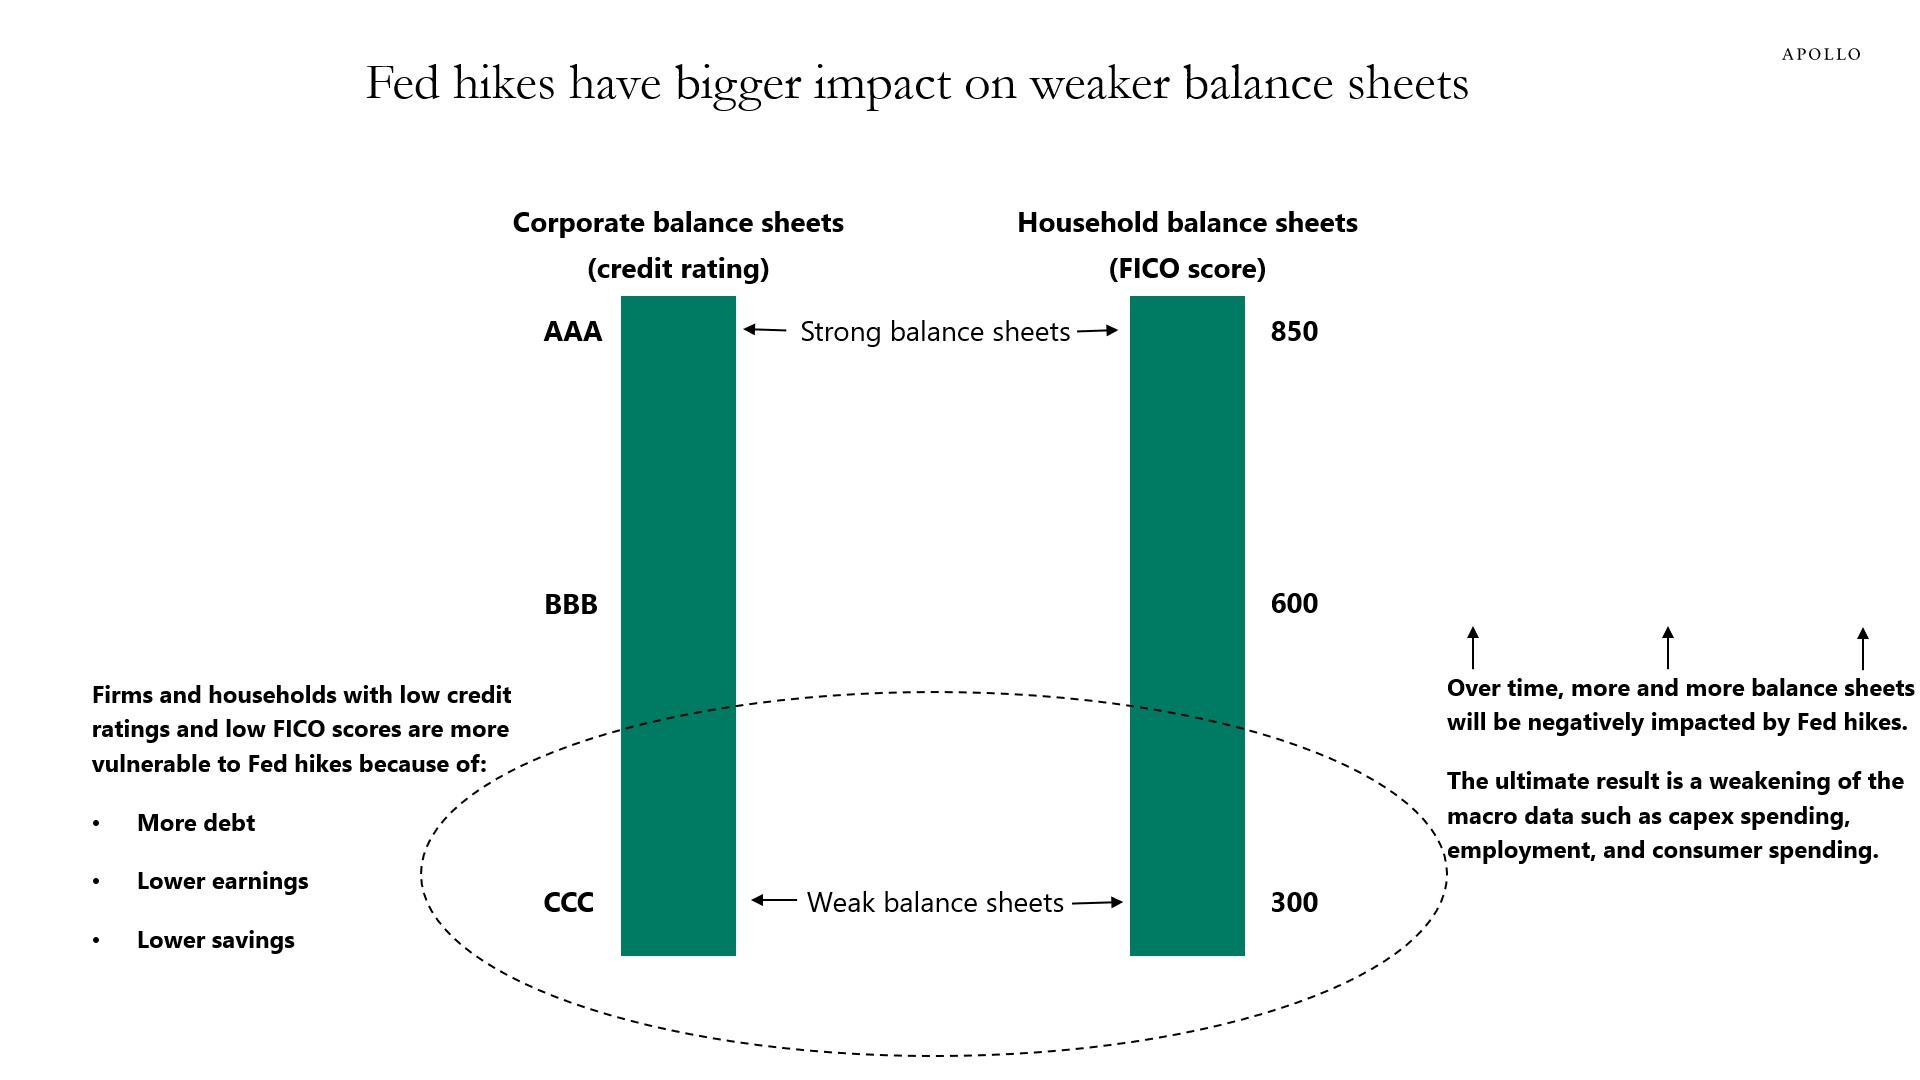
Balance sheets with higher debt, lower earnings, and lower savings will get hit first by Fed hikes, both for consumers and firms, see the first chart below. As this process continues, Fed hikes will gradually impact higher-quality balance sheets over time.
Once the Fed funds rate reaches sufficiently restrictive levels, the macro data will weaken. This is happening now: Delinquency and default rates are increasing for more vulnerable households and firms, and capex spending and nonfarm payrolls are weakening, see the second and third charts below.
This is how monetary policy works, and markets should expect the economic data to weaken further over the coming months as Fed hikes gradually bite harder and harder on consumers and firms.
Source: Apollo Chief Economist 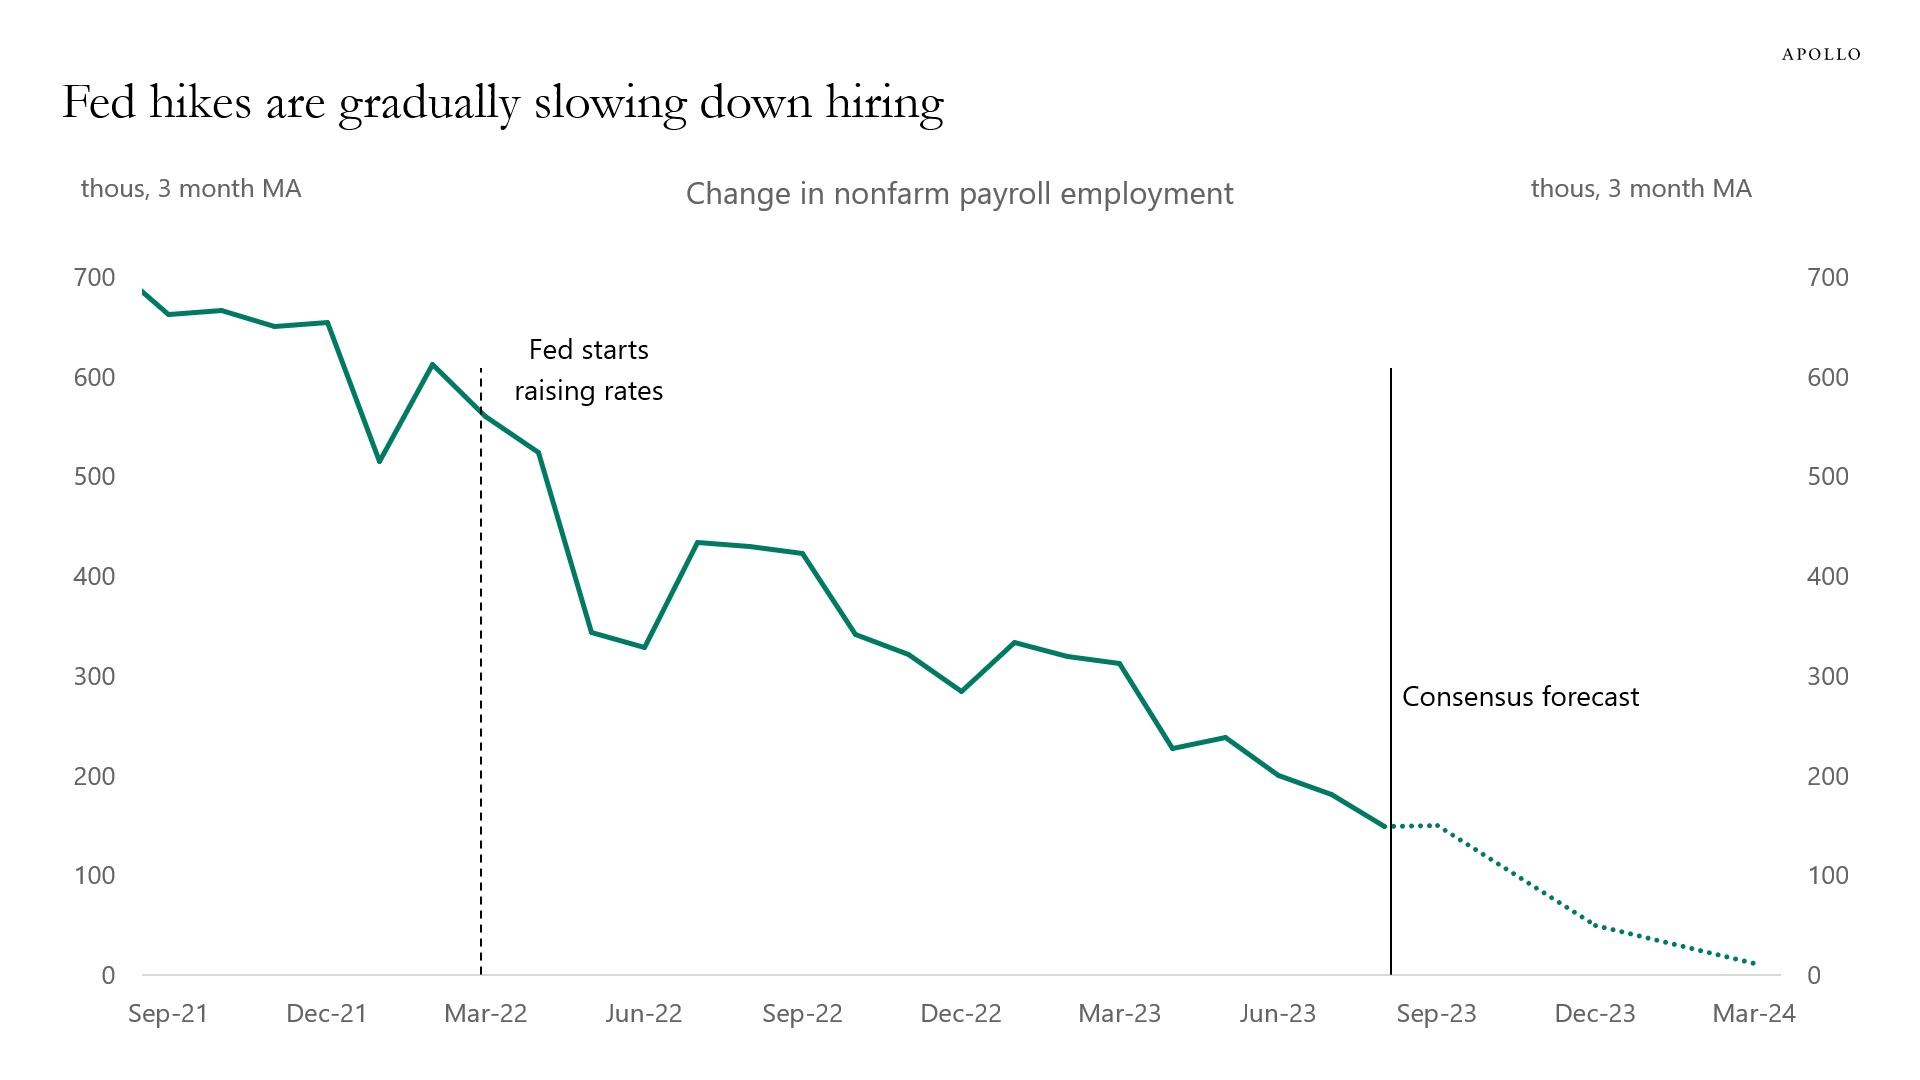
Source: BLS, Haver Analytics, Apollo Chief Economist 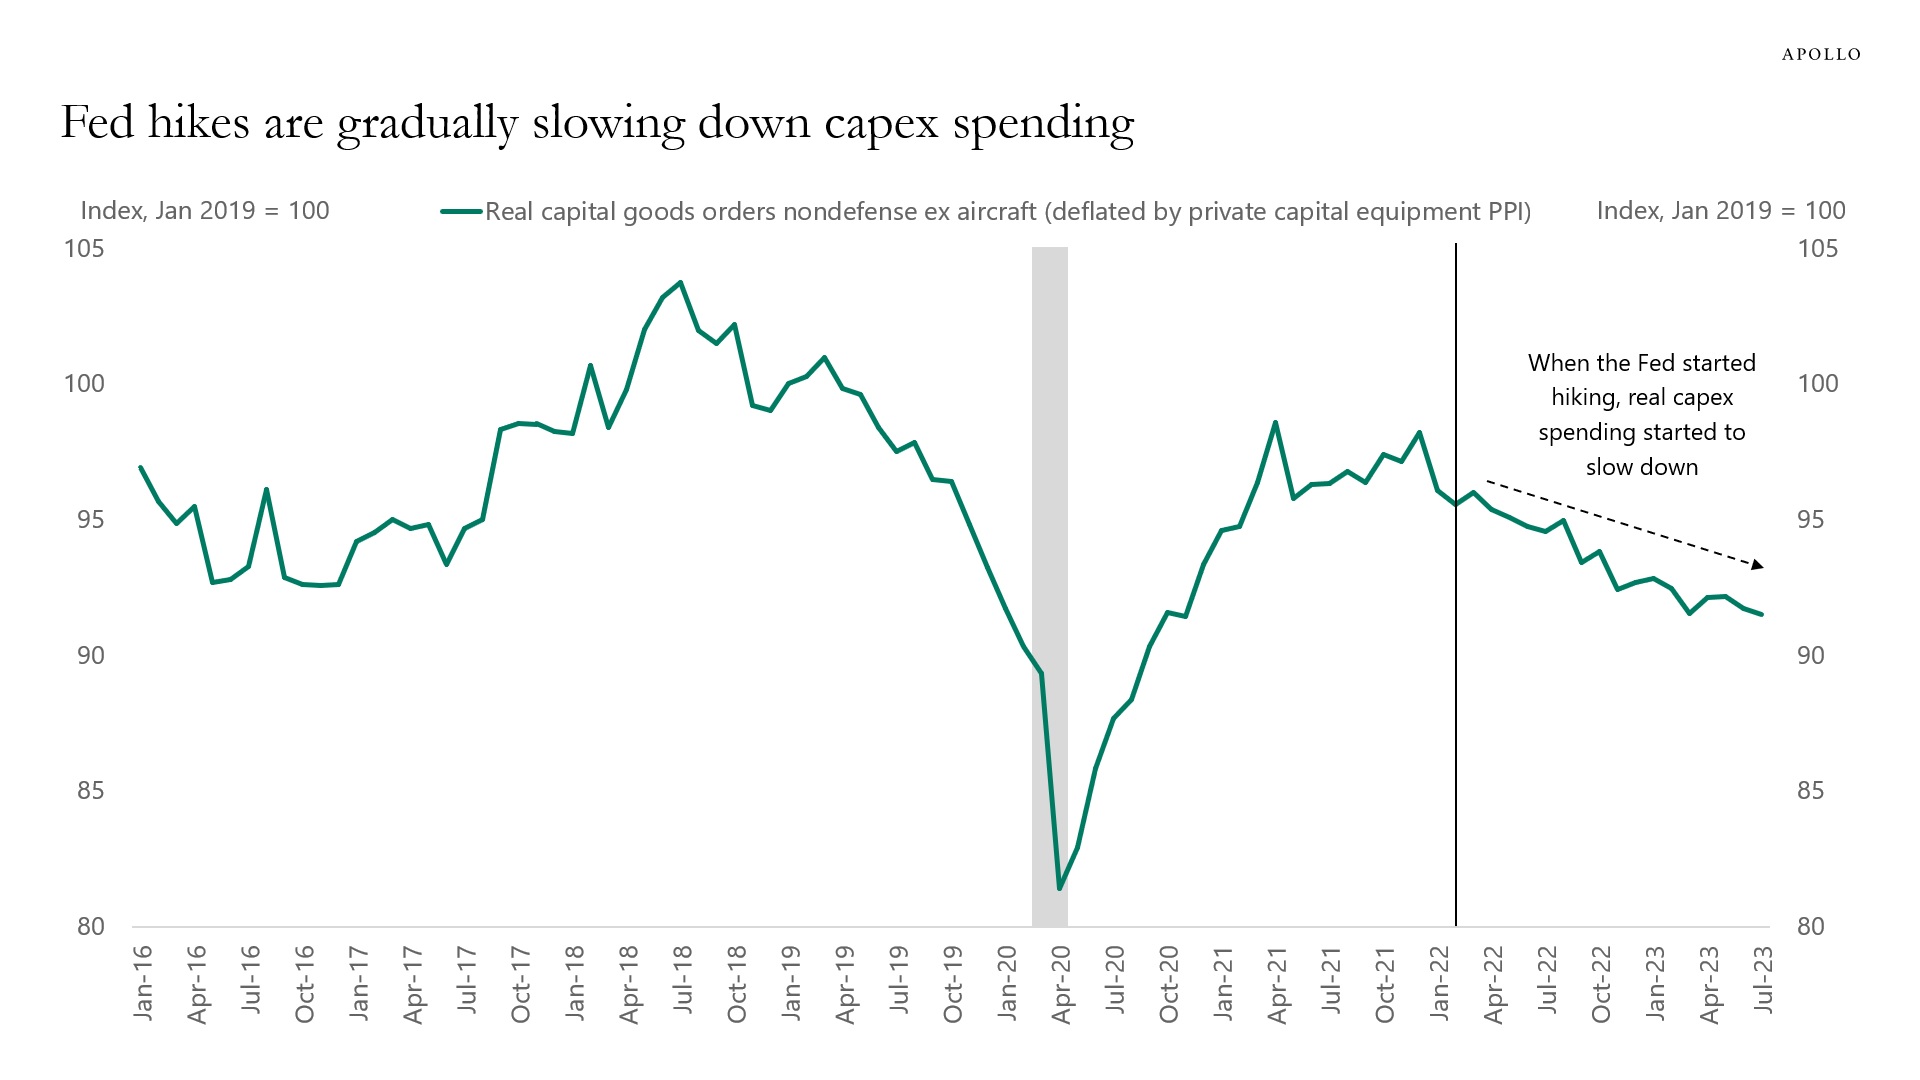
Source: Census Bureau, Bloomberg, Apollo Chief Economist. Note: Capex spending is real capital goods orders nondefense ex-aircraft deflated by private capital equipment PPI. See important disclaimers at the bottom of the page.
-
The Conference Board’s consumer confidence survey asks households if they plan to travel to a foreign country, and the first chart below shows that a record-high share of US consumers are planning to go on vacation to a foreign country within the next six months.
The continued strong demand for consumer services is the reason why it is so difficult for the Fed to get supercore inflation under control. US households want to travel on airplanes, stay at hotels, eat at restaurants, go to sporting events, amusement parks, and concerts, and that is why inflation in the non-housing service sector continues to be so high, see the second chart.
The bottom line is that rates will stay higher for longer because the Fed is not succeeding with getting non-housing service sector inflation under control.
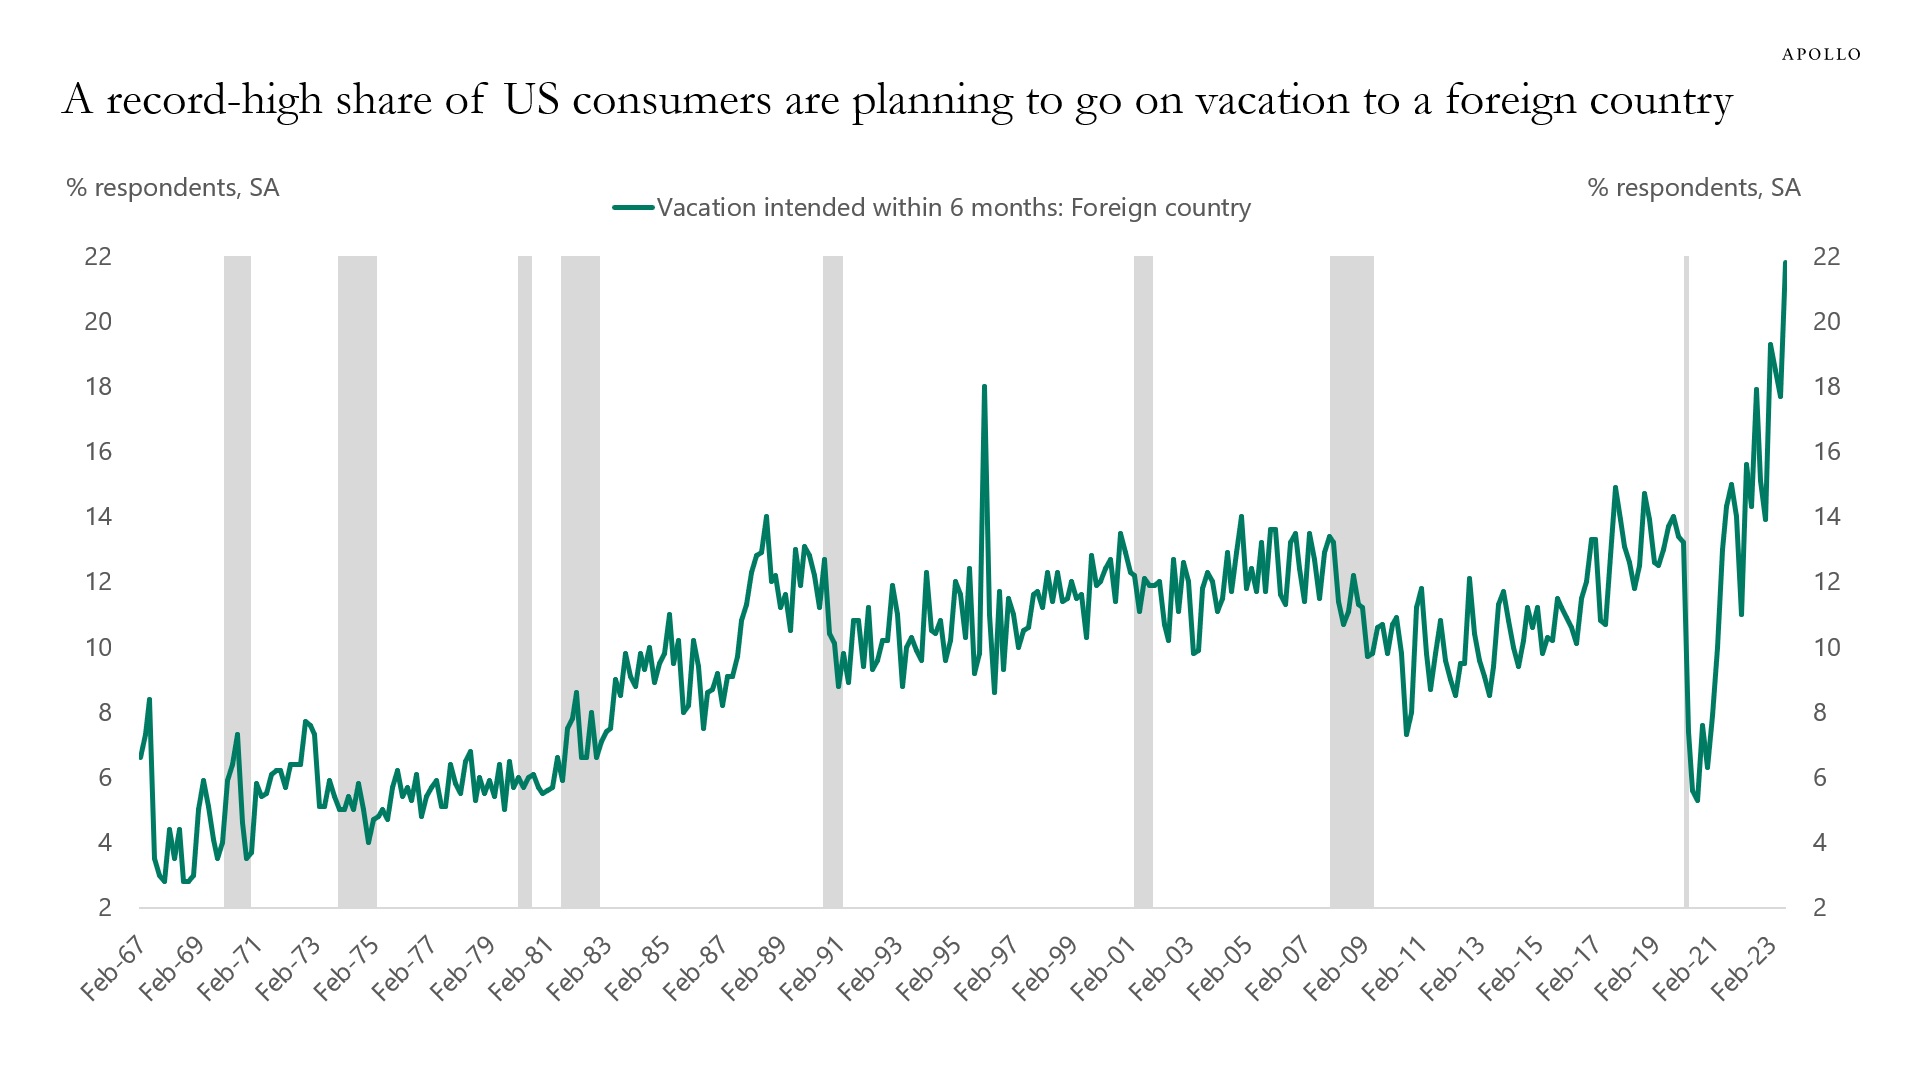
Source: The Conference Board, Haver Analytics, Apollo Chief Economist 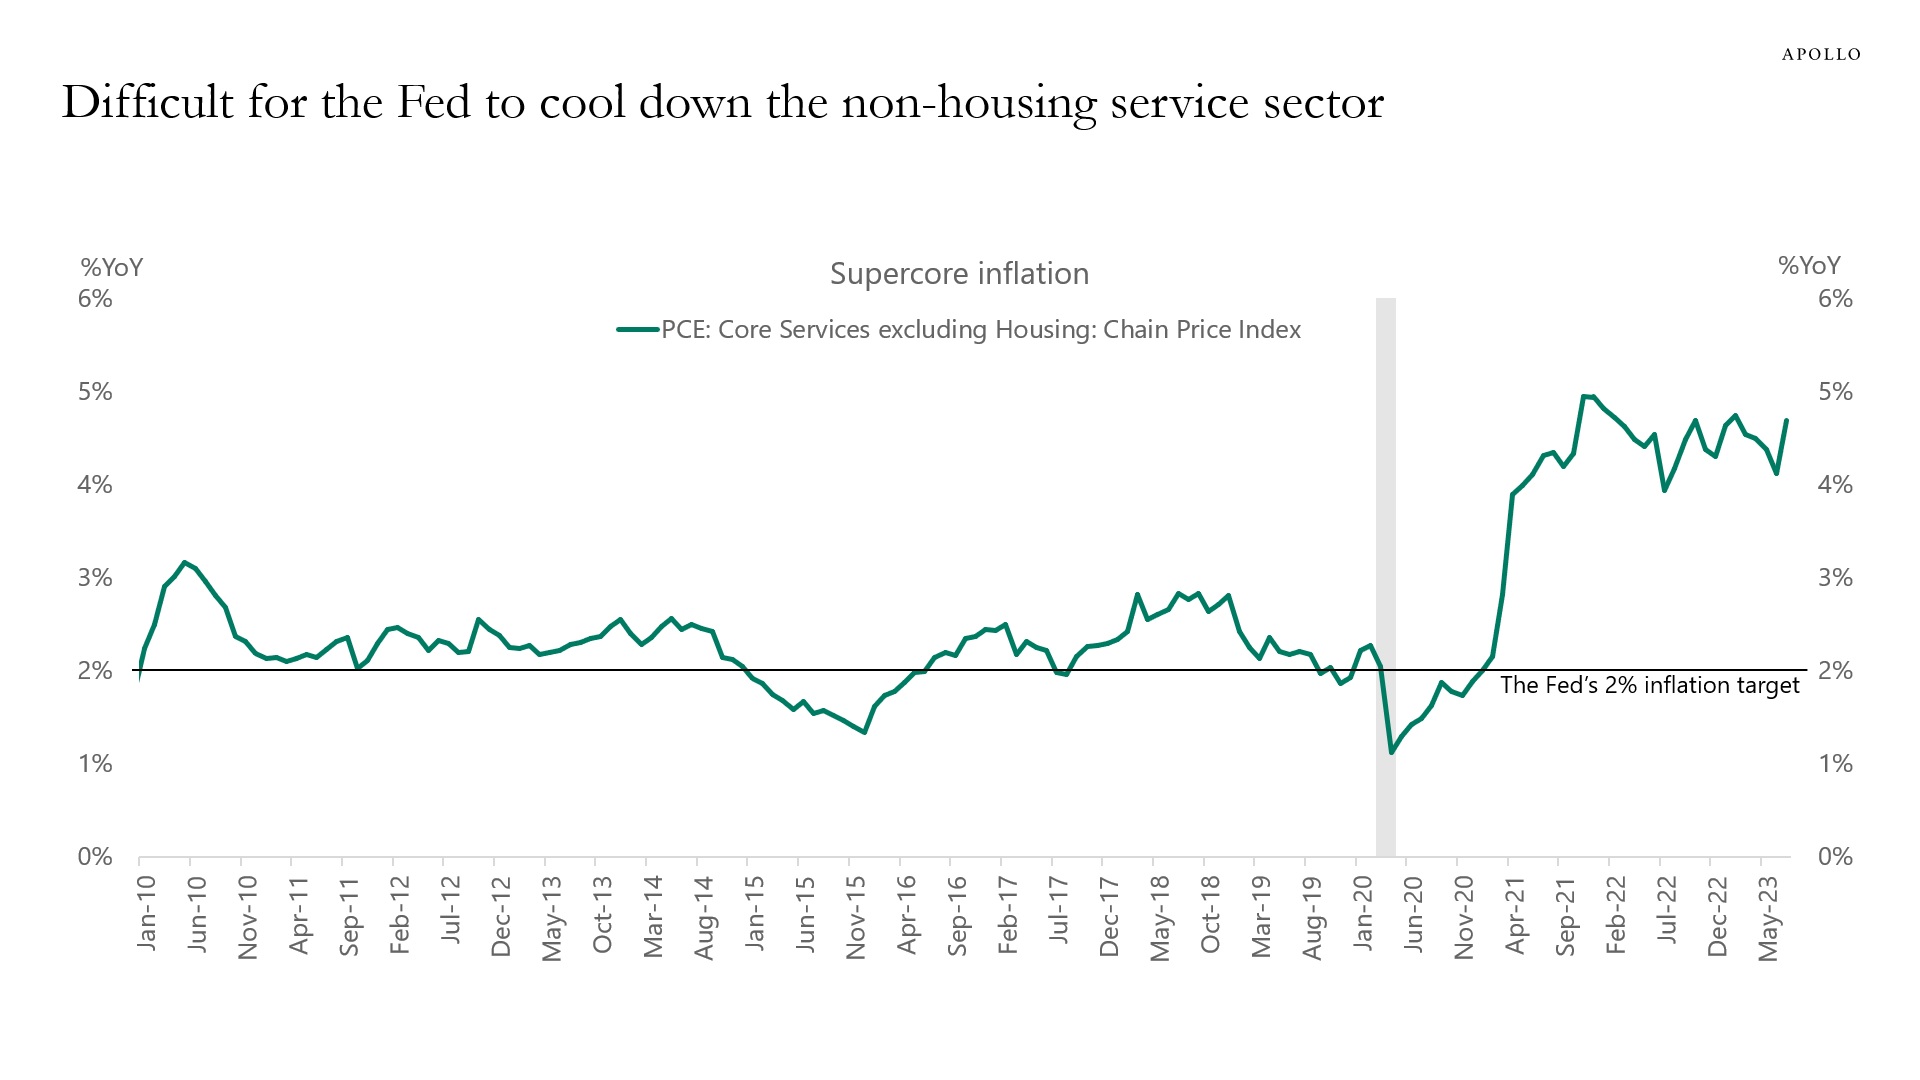
Source: BEA, Haver Analytics, Apollo Chief Economist See important disclaimers at the bottom of the page.
-
Our monthly outlook for public and private markets is available here.
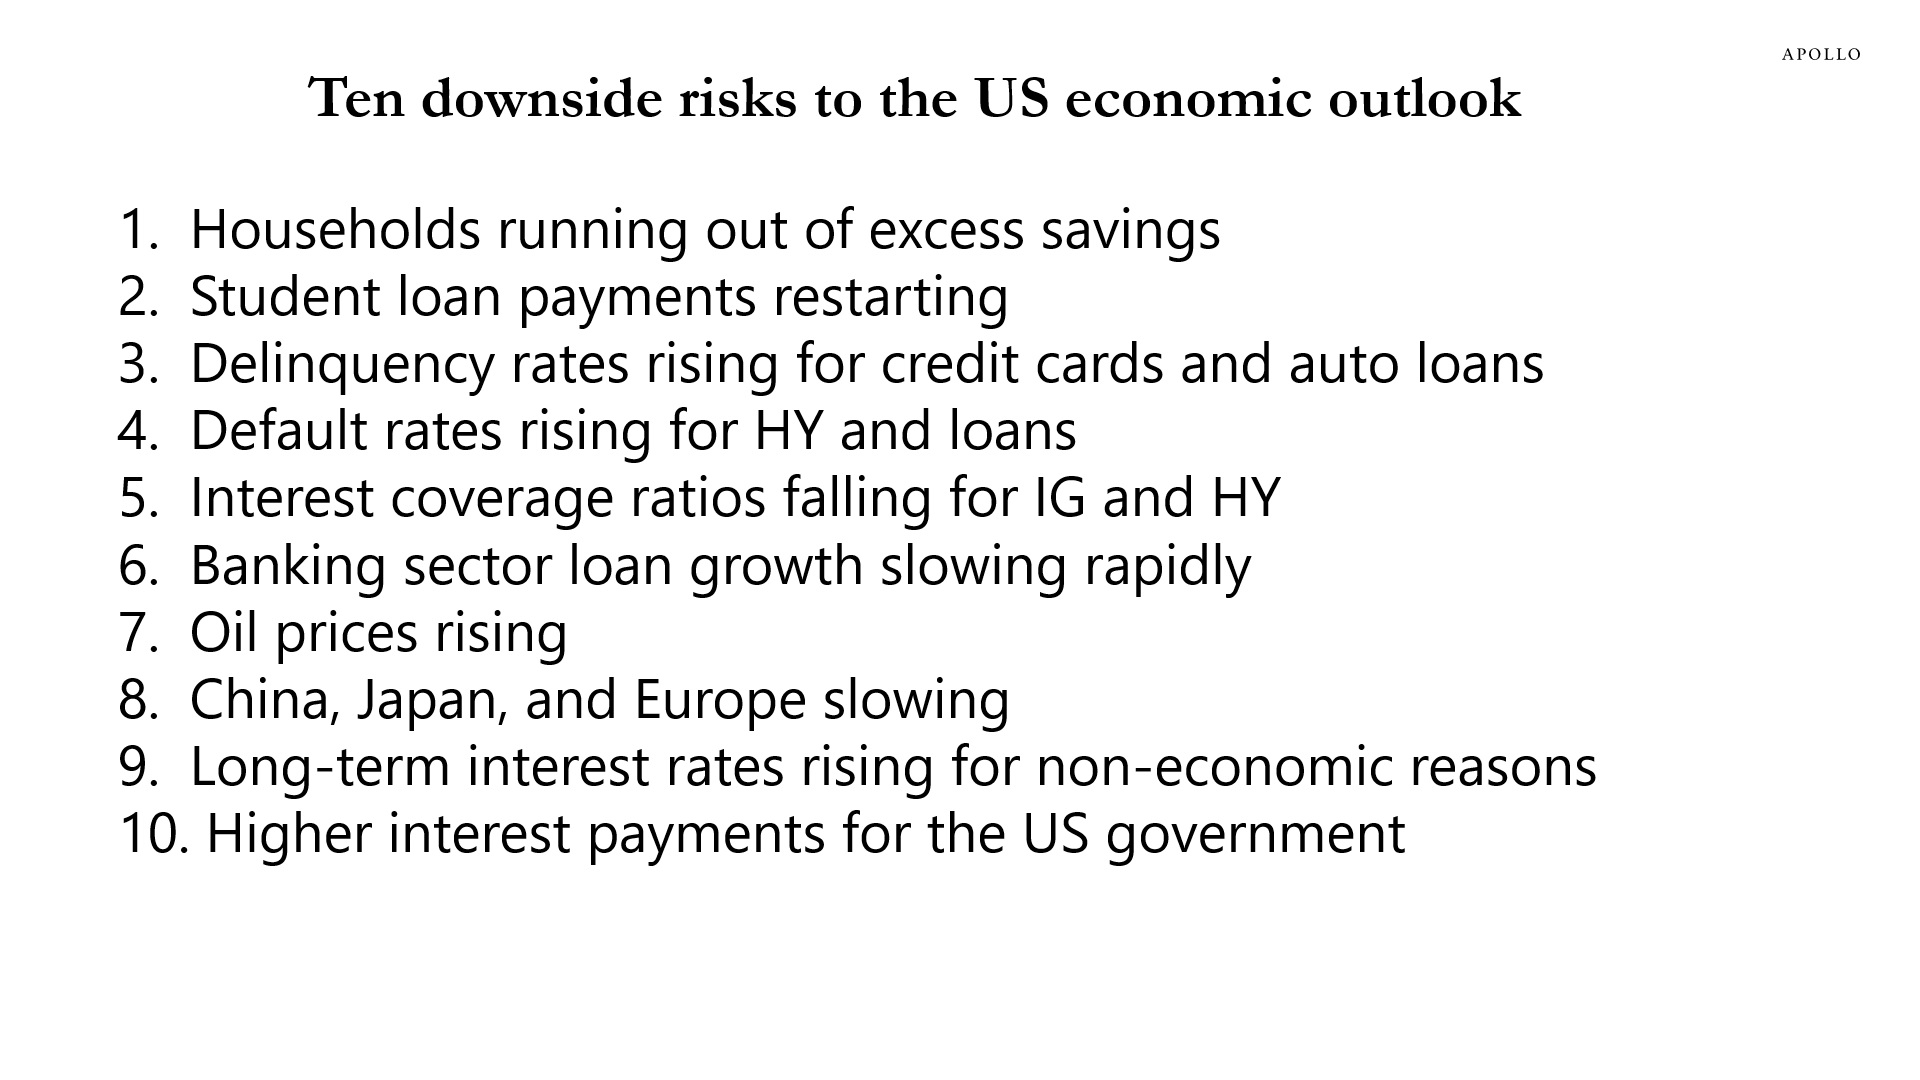
Fed hikes continue to push delinquency rates higher on credit cards and auto loans.
Also, Fed hikes continue to push higher default rates for HY and loans. And interest coverage ratios are moving down for both IG and HY.
The bottom line is that higher interest rates are biting harder and harder on consumers and firms, and the Fed’s ongoing efforts to cool down the economy will continue. There are more downside risks than upside risks to markets, see overview below.
Source: Apollo Chief Economist See important disclaimers at the bottom of the page.

This presentation may not be distributed, transmitted or otherwise communicated to others in whole or in part without the express consent of Apollo Global Management, Inc. (together with its subsidiaries, “Apollo”).
Apollo makes no representation or warranty, expressed or implied, with respect to the accuracy, reasonableness, or completeness of any of the statements made during this presentation, including, but not limited to, statements obtained from third parties. Opinions, estimates and projections constitute the current judgment of the speaker as of the date indicated. They do not necessarily reflect the views and opinions of Apollo and are subject to change at any time without notice. Apollo does not have any responsibility to update this presentation to account for such changes. There can be no assurance that any trends discussed during this presentation will continue.
Statements made throughout this presentation are not intended to provide, and should not be relied upon for, accounting, legal or tax advice and do not constitute an investment recommendation or investment advice. Investors should make an independent investigation of the information discussed during this presentation, including consulting their tax, legal, accounting or other advisors about such information. Apollo does not act for you and is not responsible for providing you with the protections afforded to its clients. This presentation does not constitute an offer to sell, or the solicitation of an offer to buy, any security, product or service, including interest in any investment product or fund or account managed or advised by Apollo.
Certain statements made throughout this presentation may be “forward-looking” in nature. Due to various risks and uncertainties, actual events or results may differ materially from those reflected or contemplated in such forward-looking information. As such, undue reliance should not be placed on such statements. Forward-looking statements may be identified by the use of terminology including, but not limited to, “may”, “will”, “should”, “expect”, “anticipate”, “target”, “project”, “estimate”, “intend”, “continue” or “believe” or the negatives thereof or other variations thereon or comparable terminology.