


Want it delivered daily to your inbox?
-
Since the Fed started raising rates in March 2022, deposits in the banking sector have declined by $862 billion, see the first chart.
Over the same period, almost the same amount, $896 billion, has gone into money market accounts, see the second chart.
Our banking sector chart book is available here. It shows that credit growth continues to slow, and bank lending conditions continue to tighten, see the third, fourth, and fifth charts.
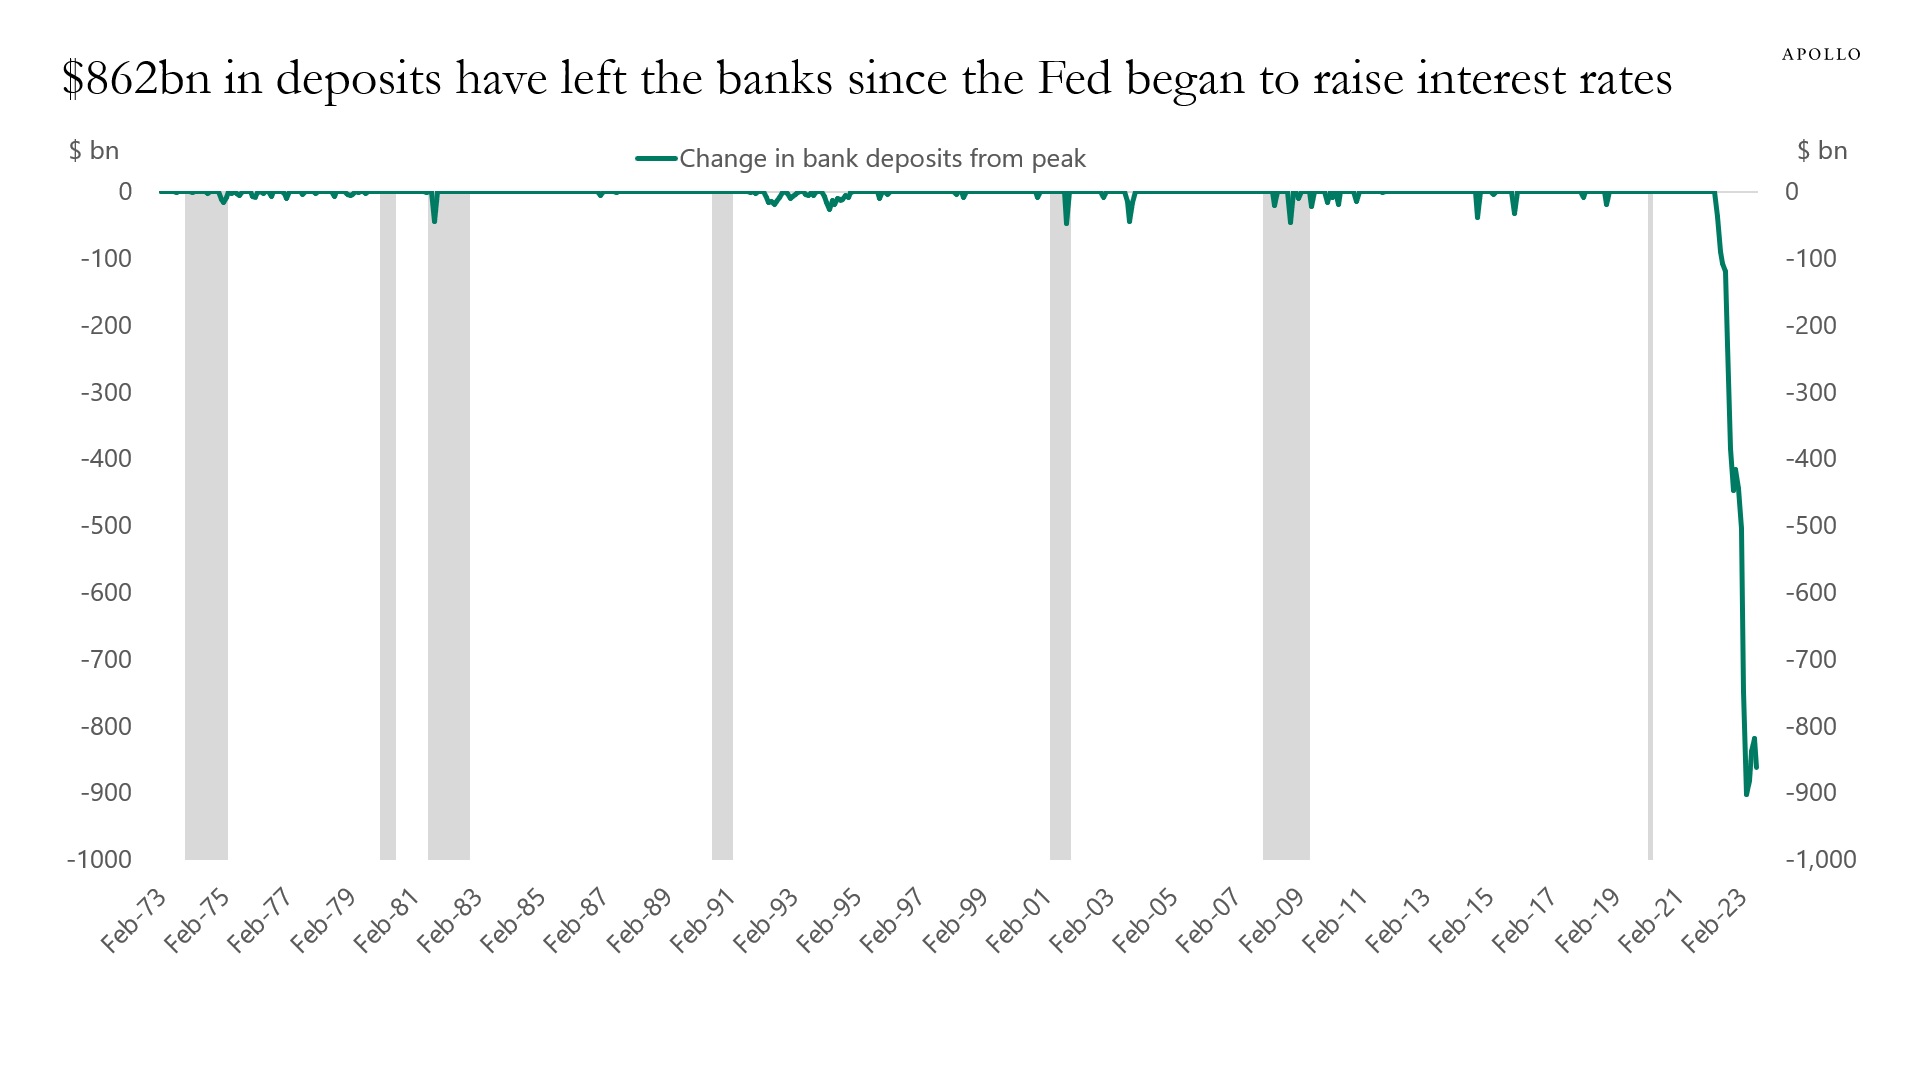
Source: Federal Reserve Board, Haver Analytics, Apollo Chief Economist. Note: March data as of 10th May 2023. Peak is defined as the month before monthly outflows turn negative. 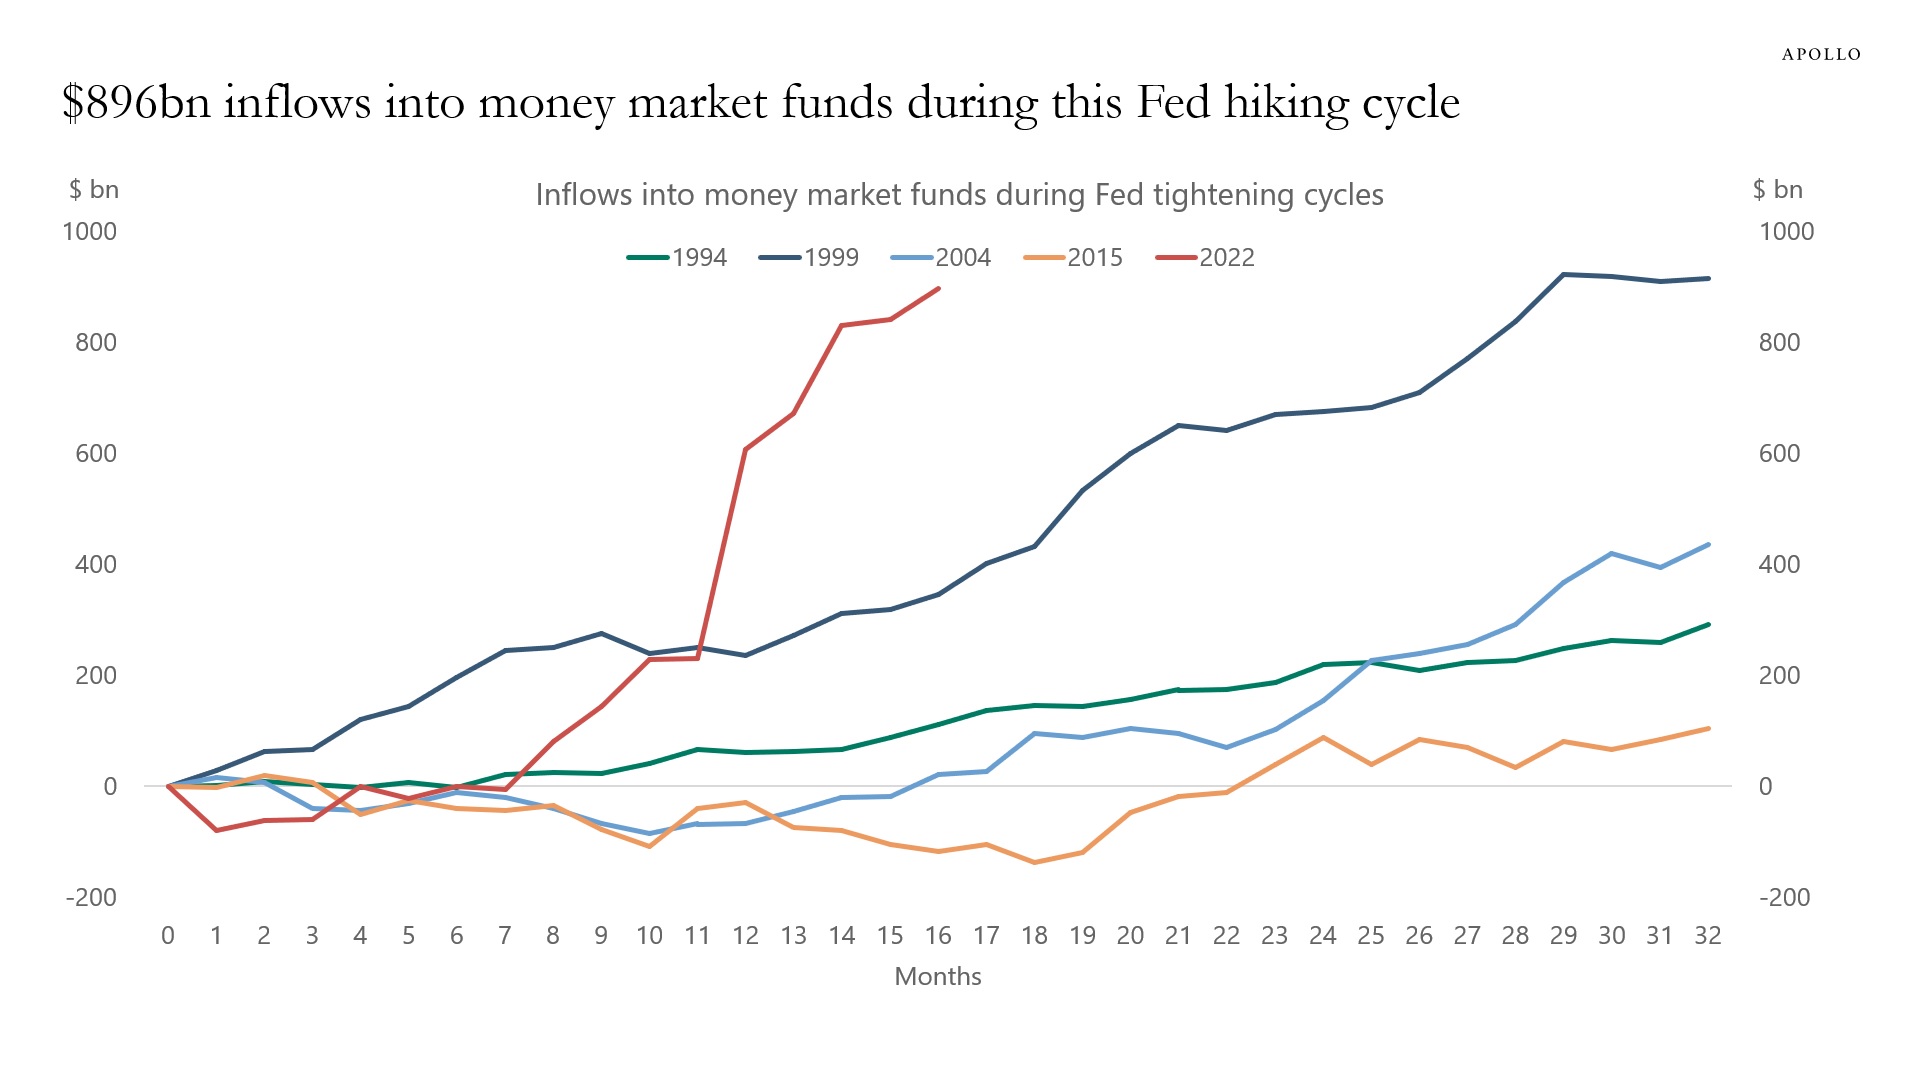
Source: FRB, ICI, Bloomberg, Apollo Chief Economist 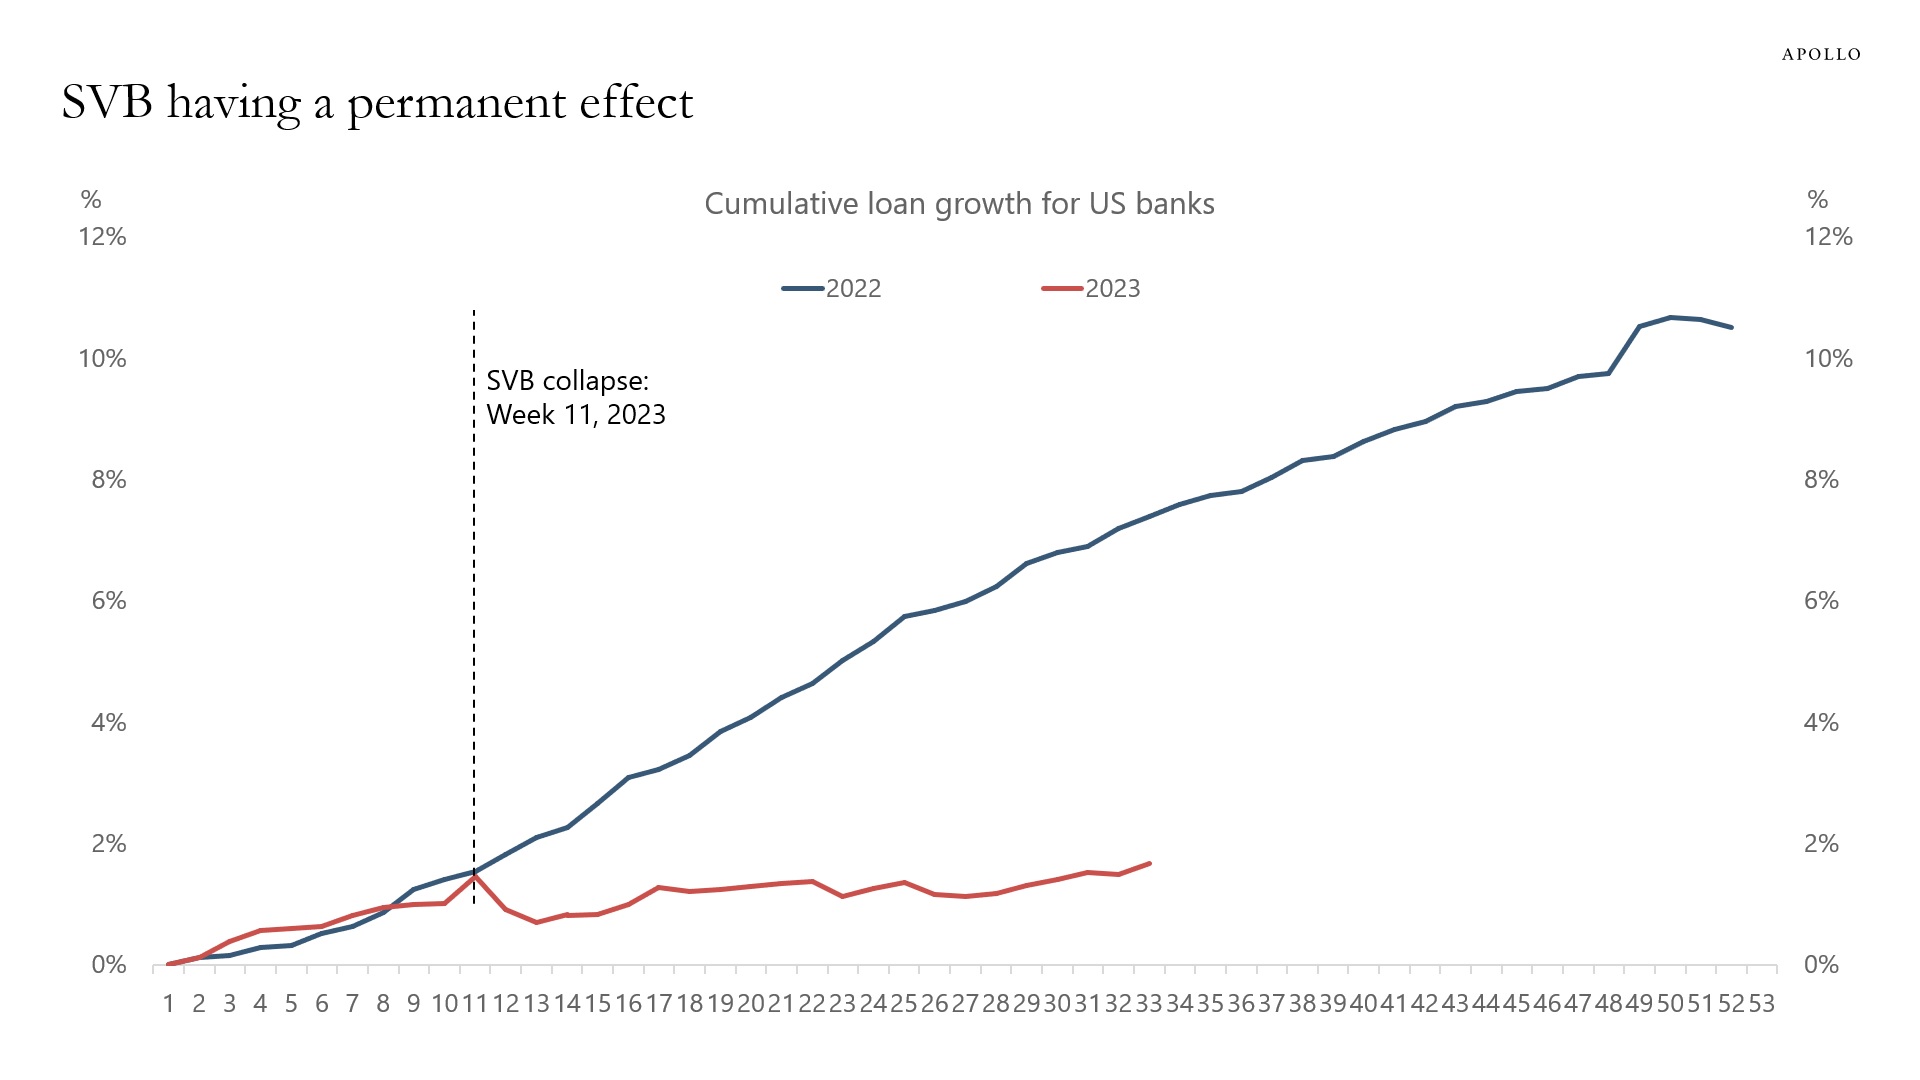
Source: FRB, Bloomberg, Apollo Chief Economist 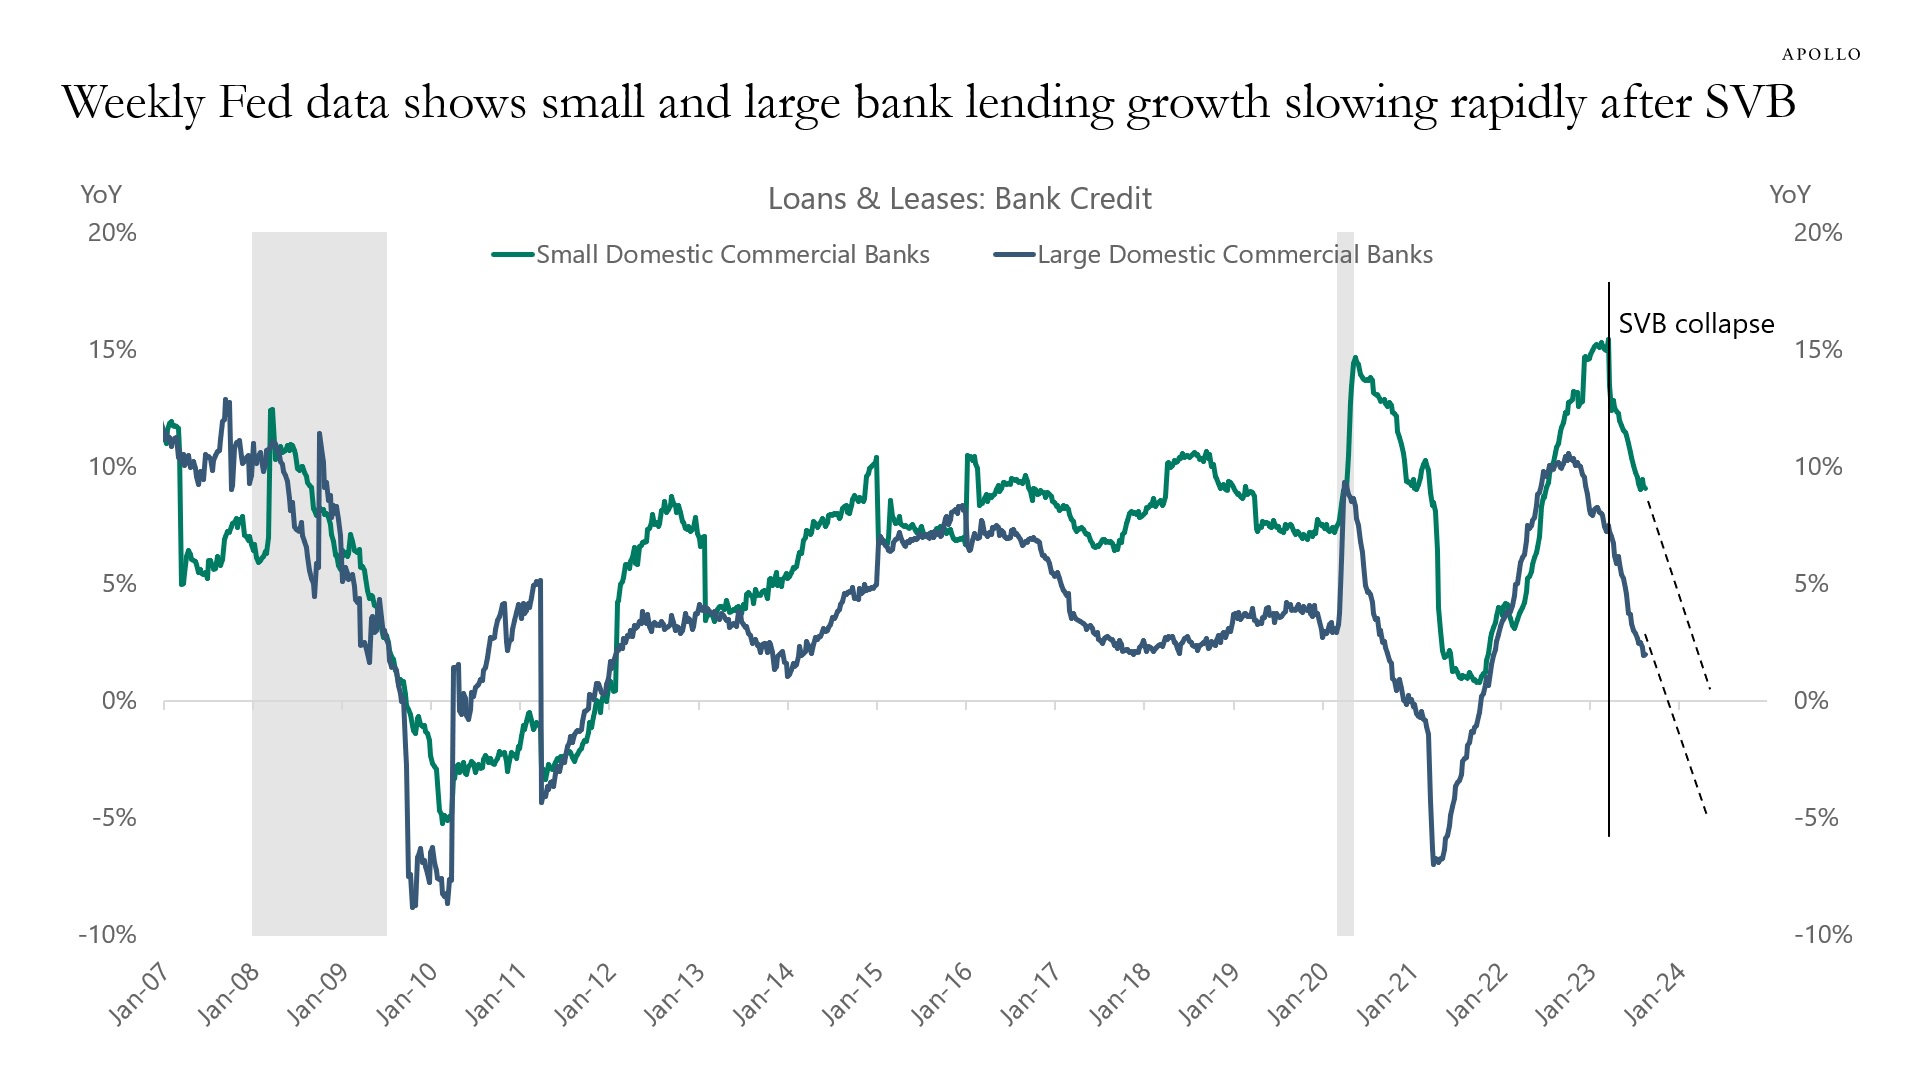
Source: Federal Reserve Board, Haver Analytics, Apollo Chief Economist 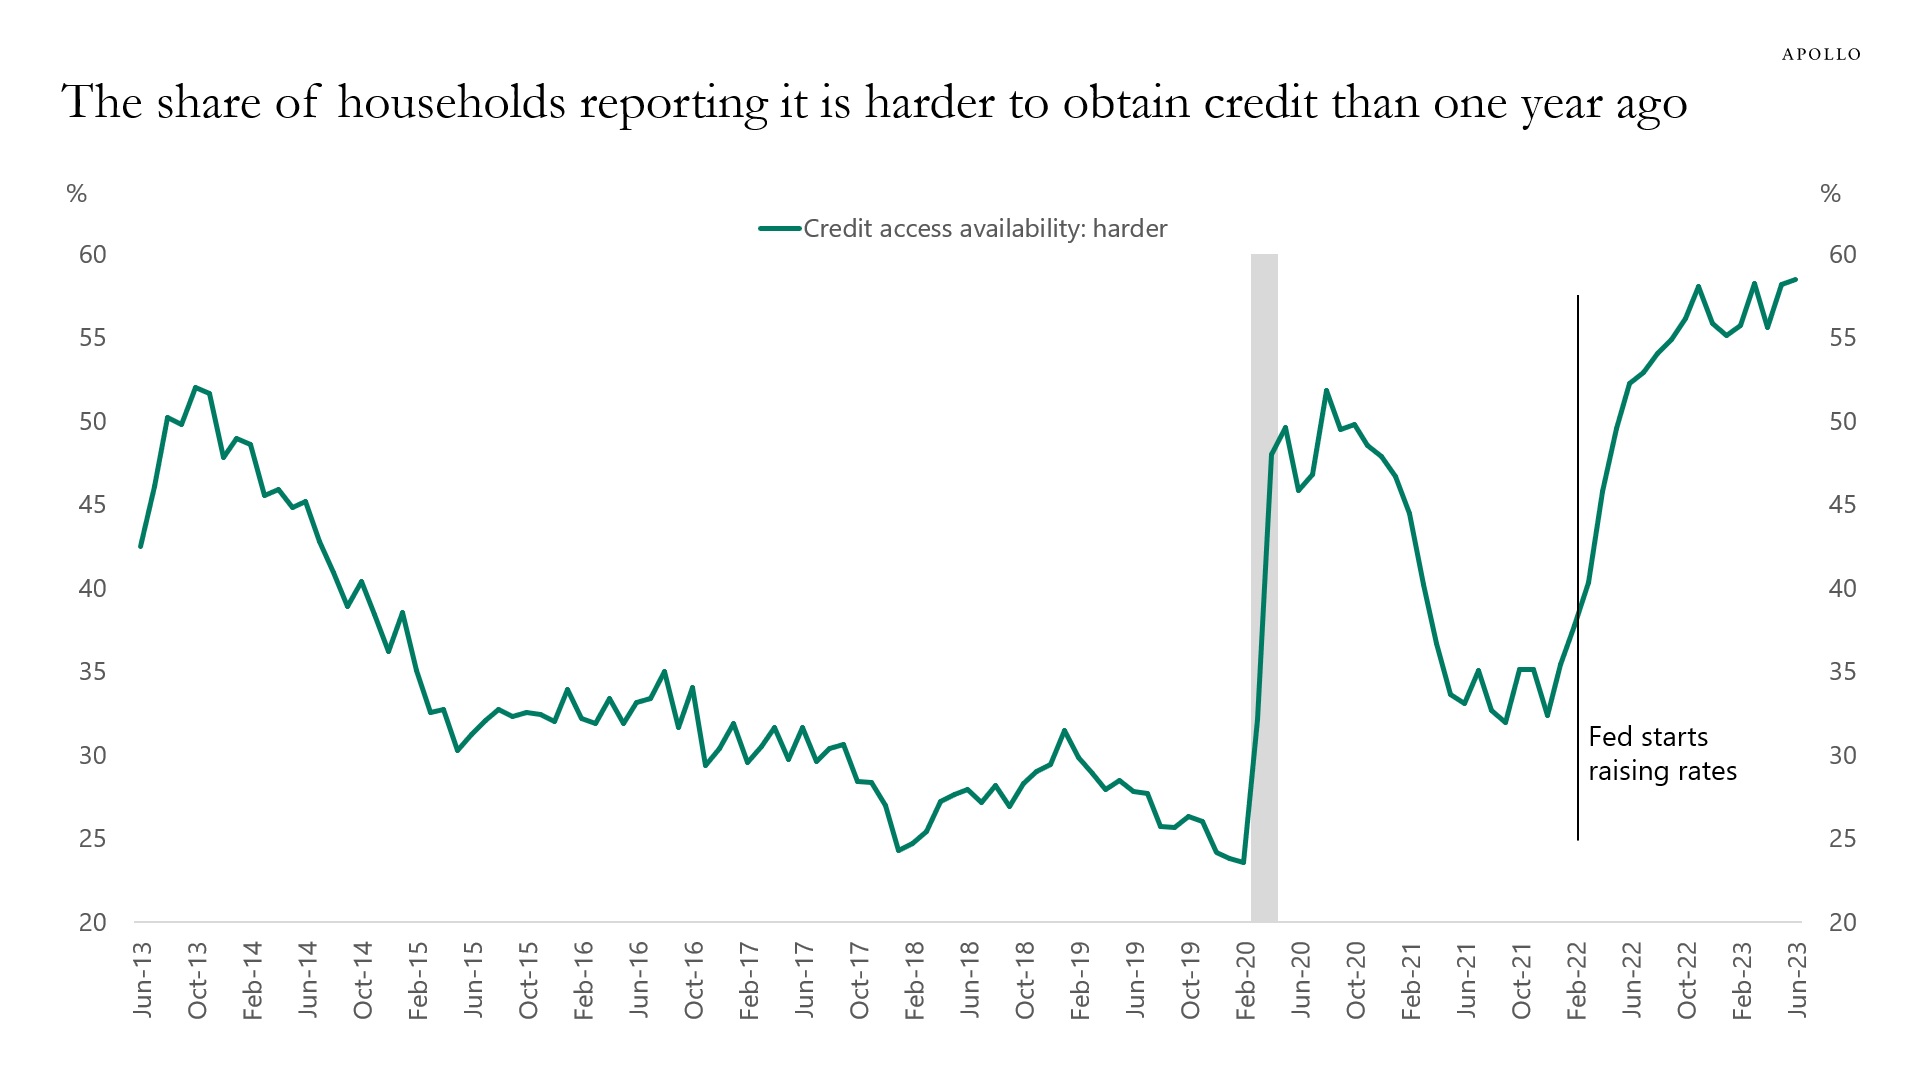
Source: FRBNY, Haver Analytics, Apollo Chief Economist. Note: Harder equals much harder + somewhat harder. See important disclaimers at the bottom of the page.
-
Since the ECB started raising rates in July 2022, corporate bankruptcies have trended higher, driven by transportation and storage; accommodation and food services; and education, health, and social activities—see chart below.
With the ECB keeping rates high well into 2024, we should expect these trends to continue.
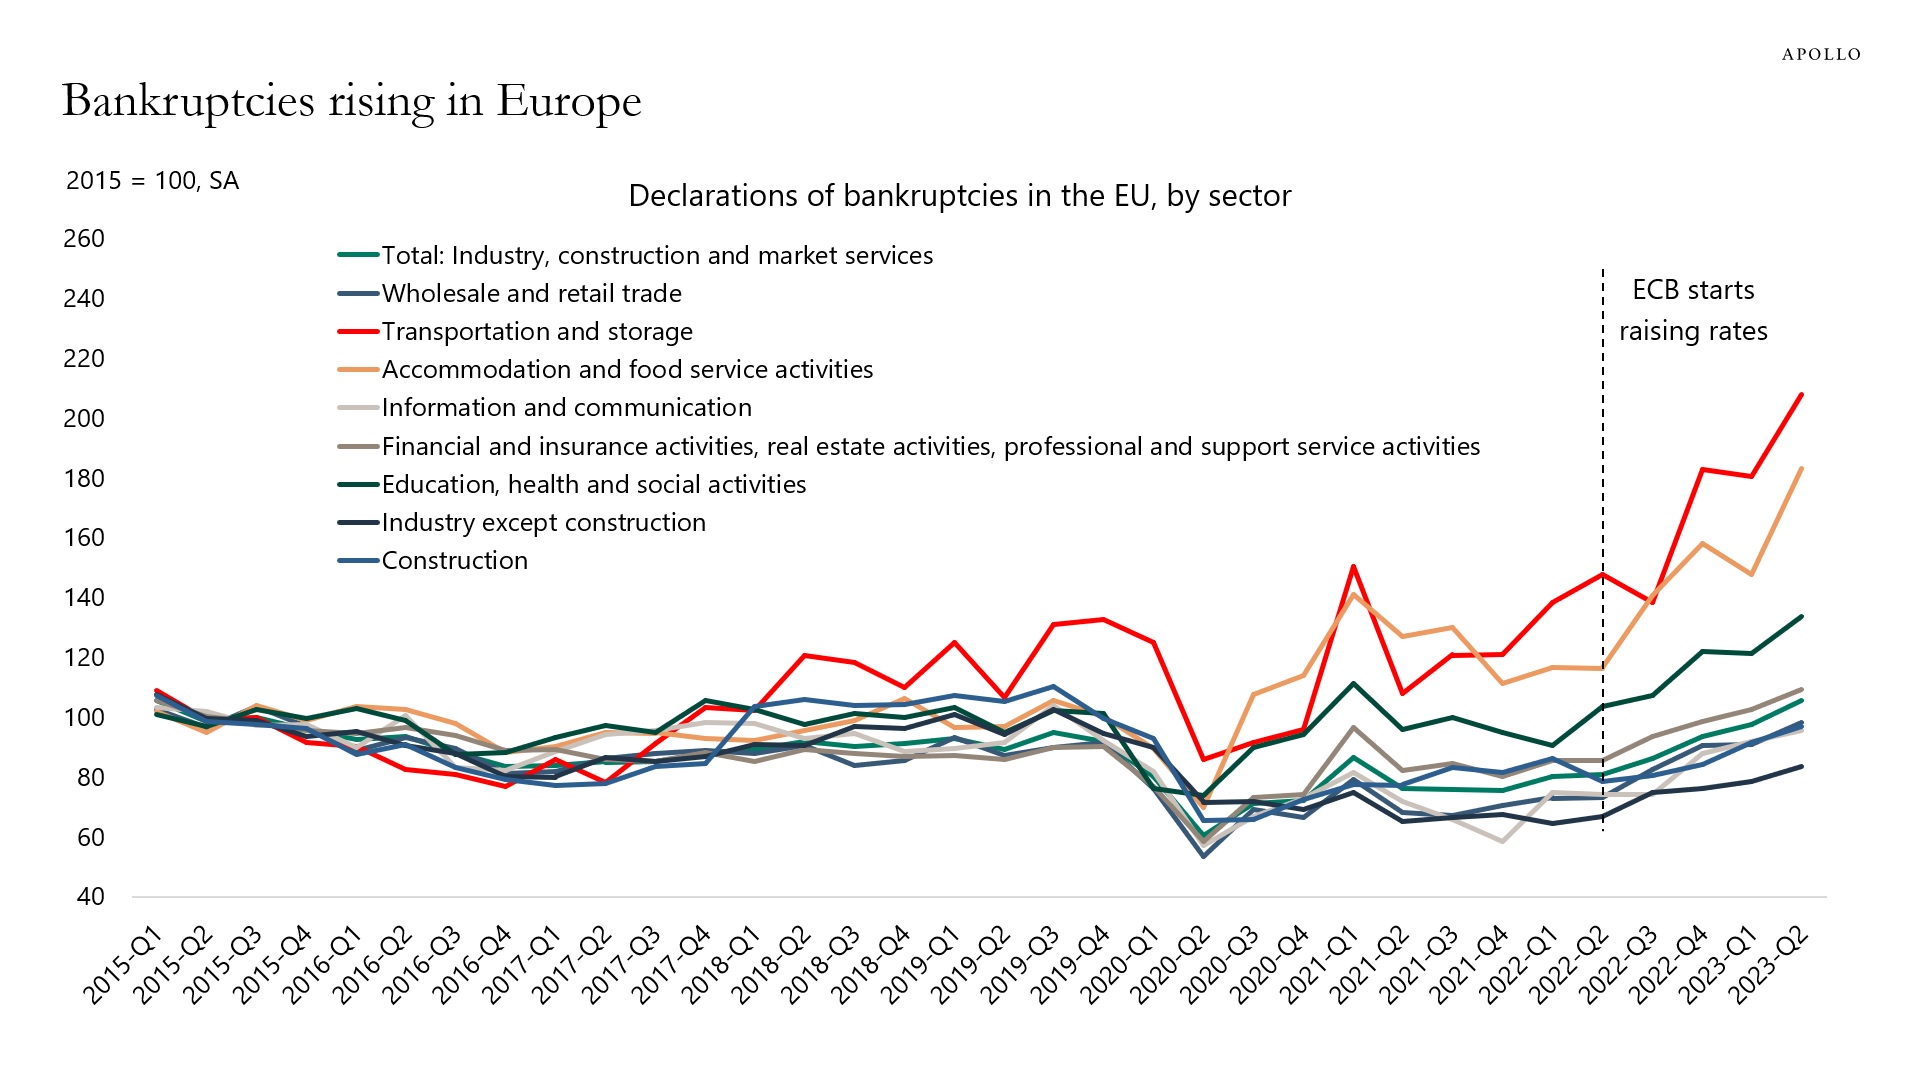
Source: ECB, Apollo Chief Economist See important disclaimers at the bottom of the page.
-
When interest rates increase, the household sector has to pay more for debt.
But when interest rates go up, households also receive higher cash flow on fixed-income assets.
Dividing households’ interest payments with households’ interest income shows that debt servicing costs as a share of interest income are at the highest level since 1959, see chart below.
In other words, both debt servicing costs and interest payments have increased as the Fed has raised interest rates. But debt servicing costs have just increased more.
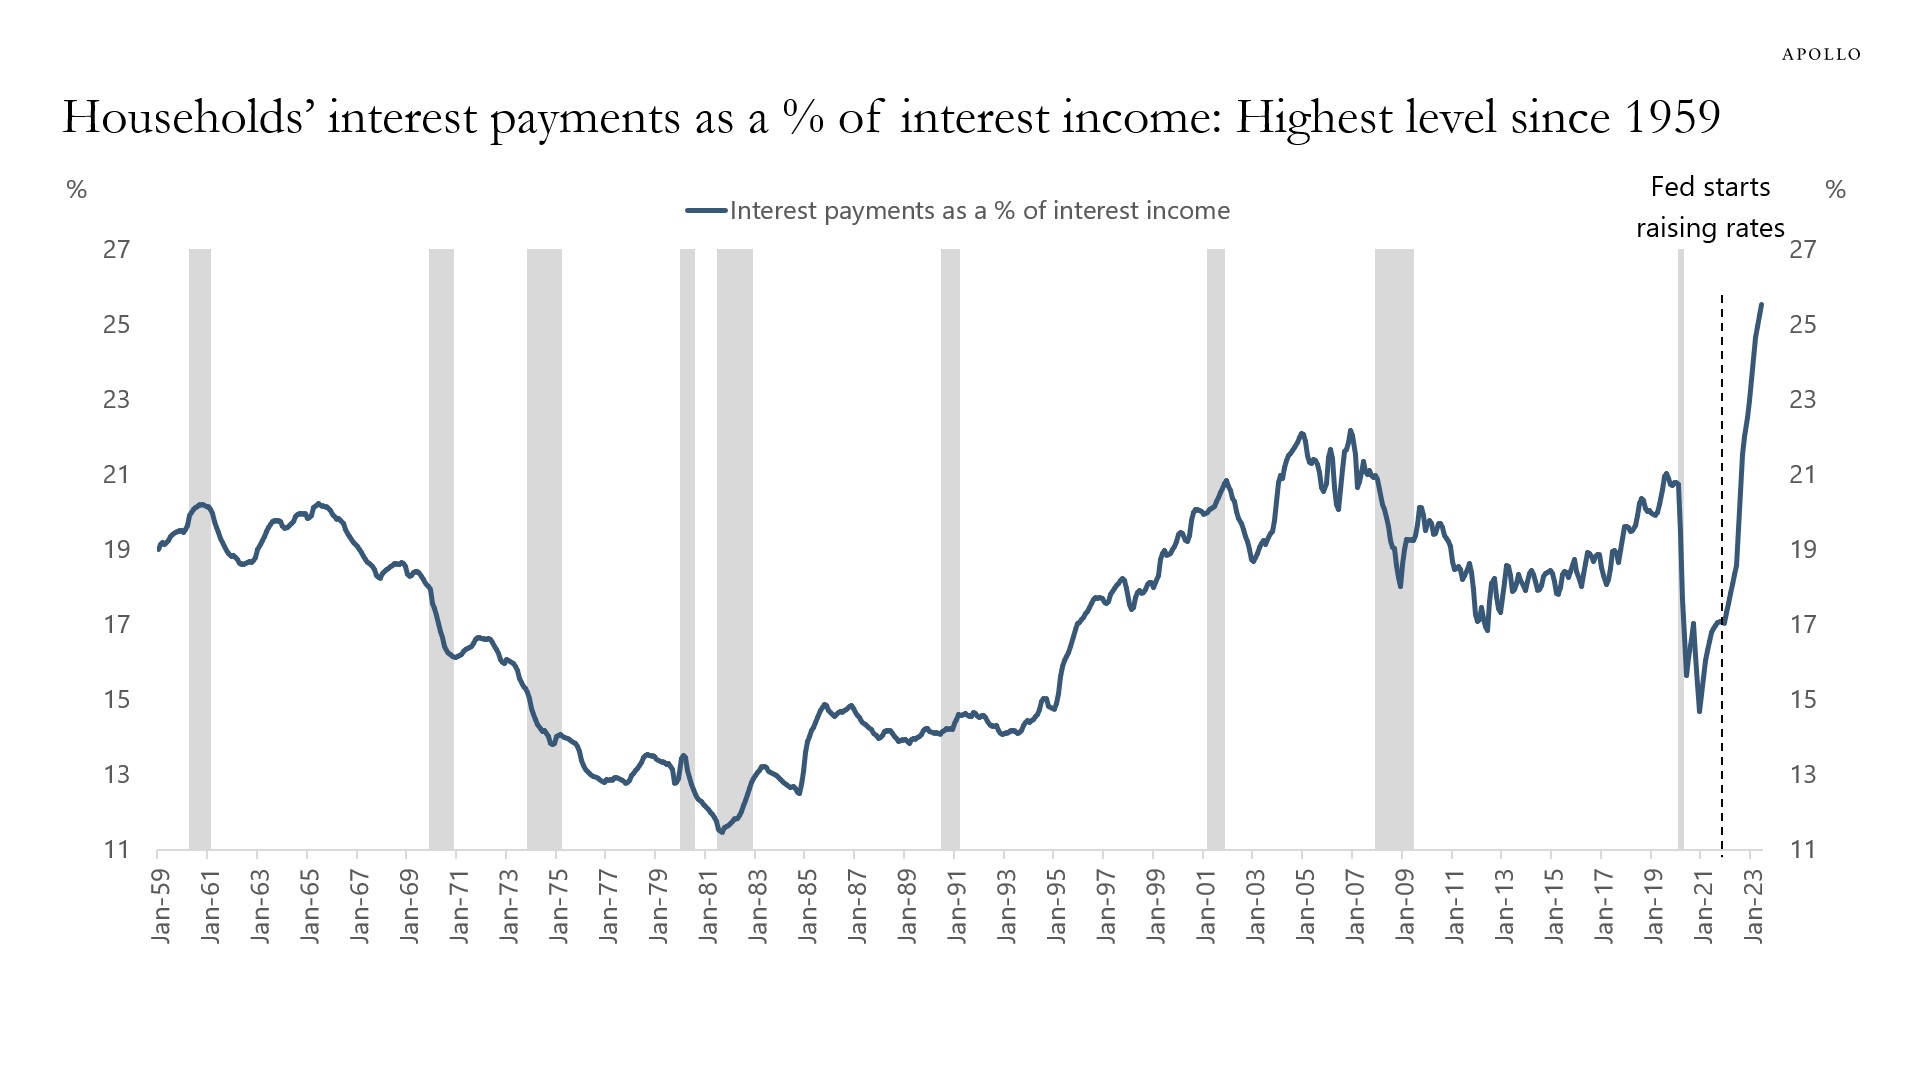
Source: BEA, Bloomberg, Apollo Chief Economist See important disclaimers at the bottom of the page.
-
One way to better understand the impact of BoJ YCC exit on Japanese demand for US Treasuries is to look at how much of the recent increase in US long-term interest rates has happened during Tokyo trading hours.
The chart below shows that since the BoJ YCC exit surprise in late July, the move higher in 10s has occurred almost entirely during New York trading hours.
This suggests that US rates are not driven higher by Japanese investors during Tokyo trading hours. And hence, BoJ YCC exit doesn’t seem to be the reason long rates have increased over the past month.
Instead, likely drivers of US rates over the past month are the US sovereign downgrade, fewer dollars for China to recycle in a falling exports environment, Fed QT, the significant budget deficit, the large stock of T-bills, and the Treasury’s intention to increase coupon auction sizes.
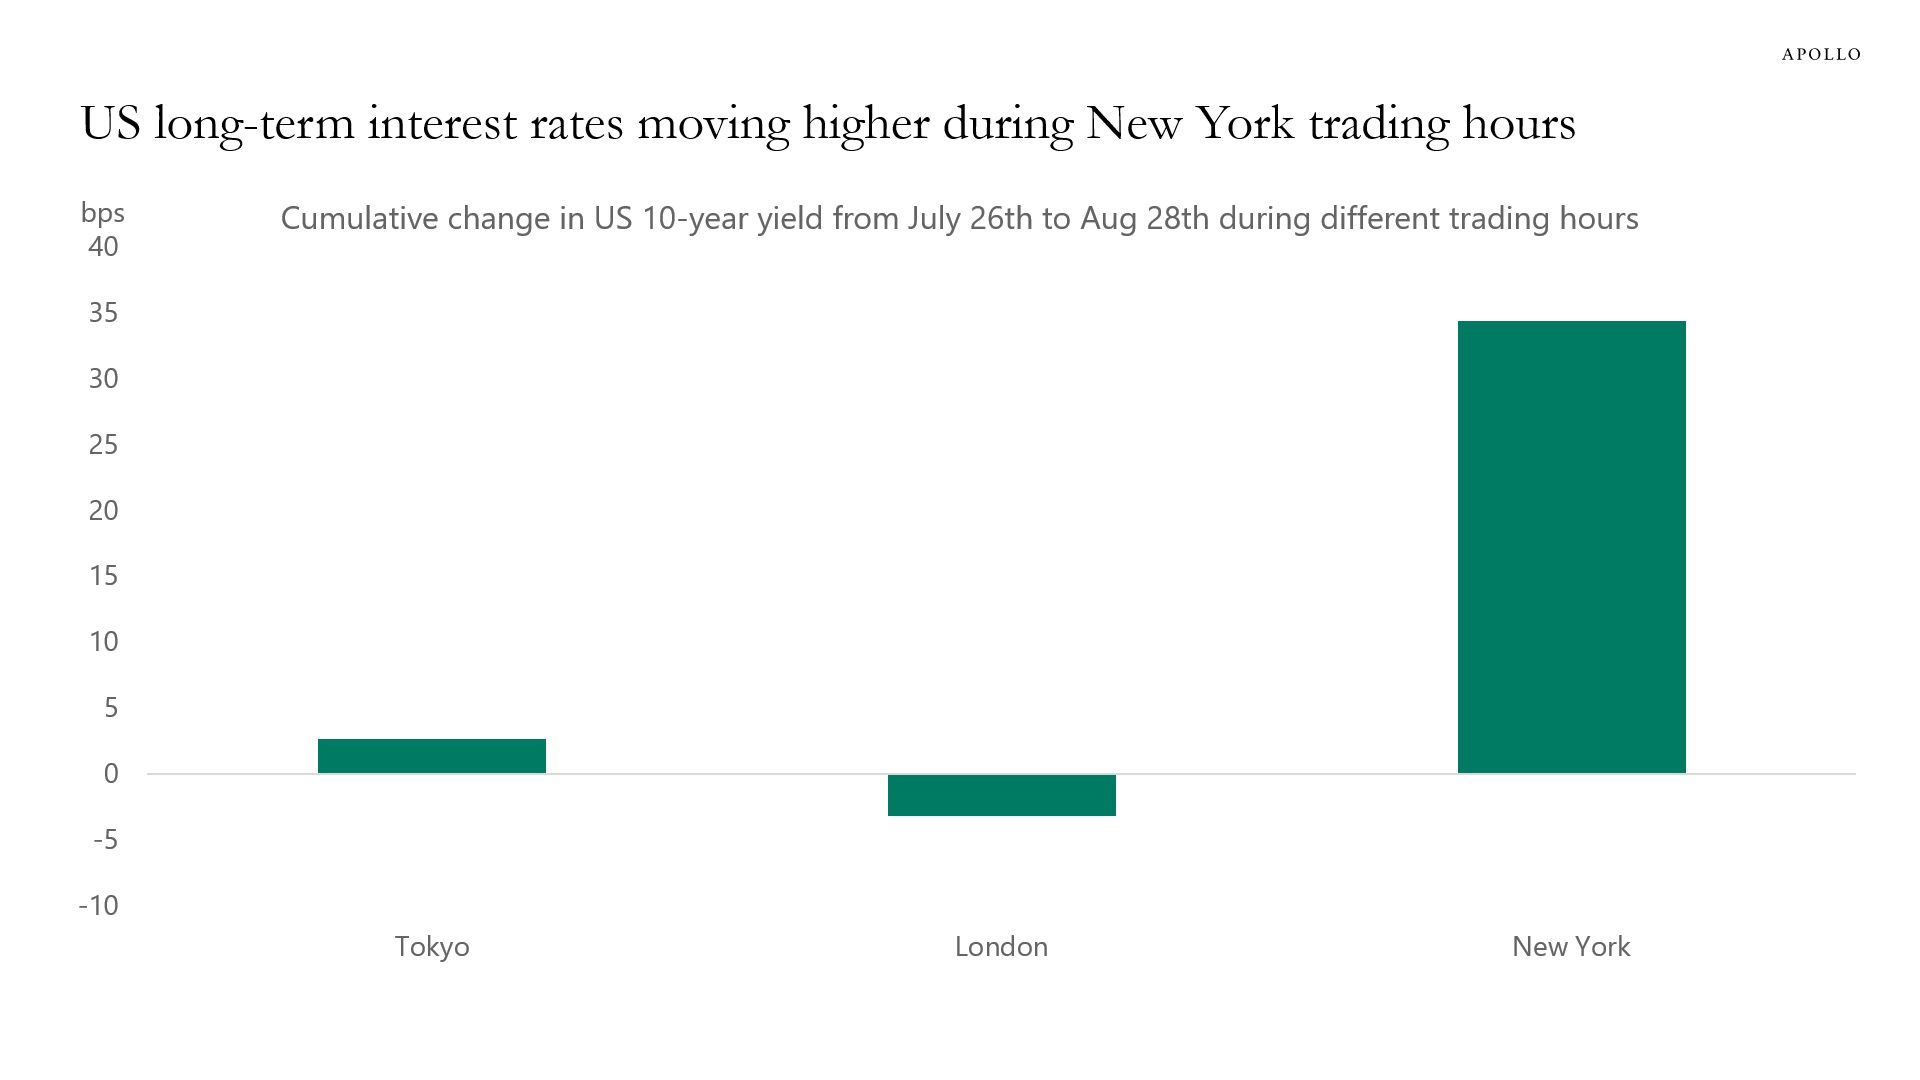
Source: Bloomberg, Apollo Chief Economist. Note: Tokyo trading session defined as 9 am to 4:30 pm JST, followed by London defined as 8:30 am to 1 pm GMT, and New York defined as 8 am to 4:30 pm EST, covering 20.5 hours in total of 10-year Treasury trading. See important disclaimers at the bottom of the page.
-
Despite the unemployment rate being at the lowest level in 50 years, credit card delinquency rates at small banks are at the highest level on record, see chart below. Imagine where these lines will be once the labor market finally begins to soften.
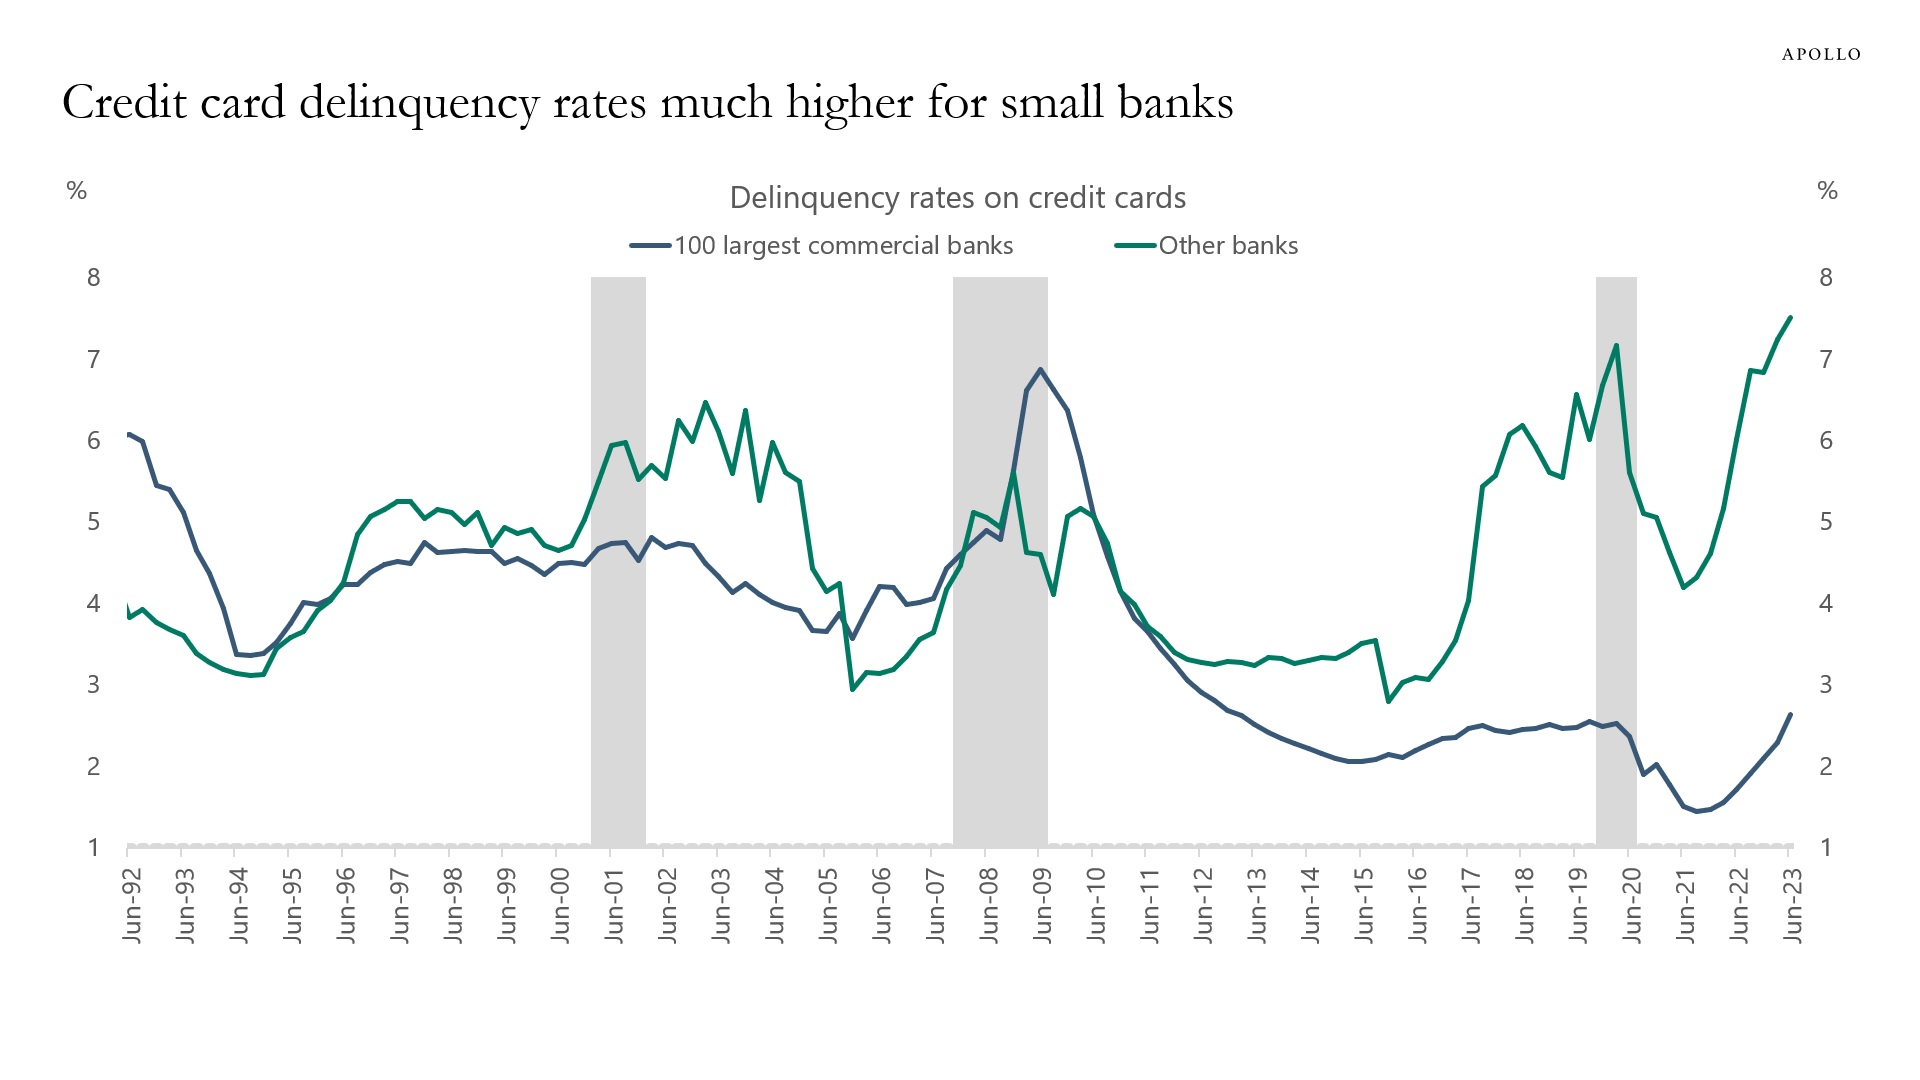
Source: FRB, Bloomberg, Apollo Chief Economist See important disclaimers at the bottom of the page.
-
The map below shows the number of new business applications per 1,000 residents, and there are a lot of entrepreneurs in the Southeast, in particular in Florida.
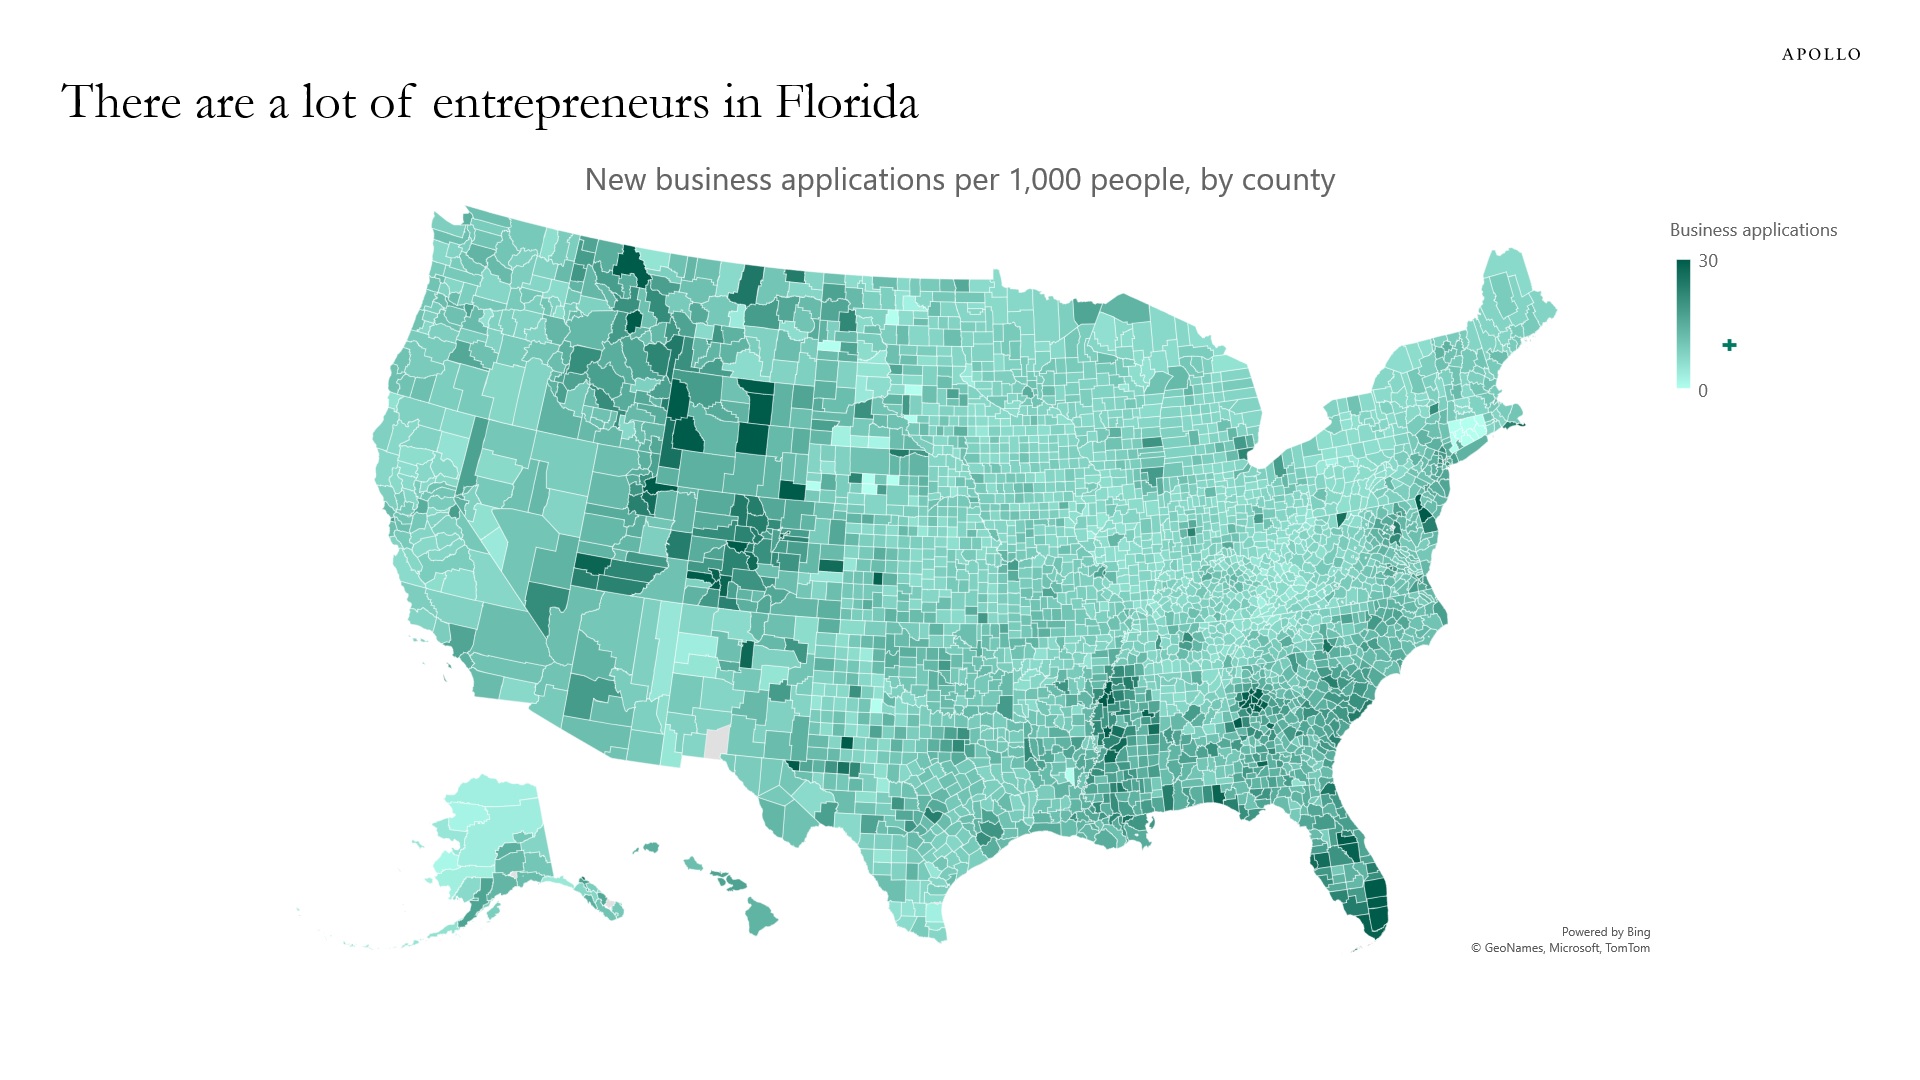
Source: Census Bureau, Apollo Chief Economist. Note: Data for 2022. See important disclaimers at the bottom of the page.
-
Since the Fed started hiking in March 2022, default rates have been moving higher, and every day there are companies that cannot get a new loan or refinance an existing loan.
This is how monetary policy works. A higher cost of capital makes it harder for firms to get financing.
With the strong uptrend in defaults over the past six months, and the Fed keeping interest rates at elevated levels, the HY default rate could reach 6% by the end of 2023, see chart below.
The bottom line is that a default cycle has started, and markets are not paying attention.
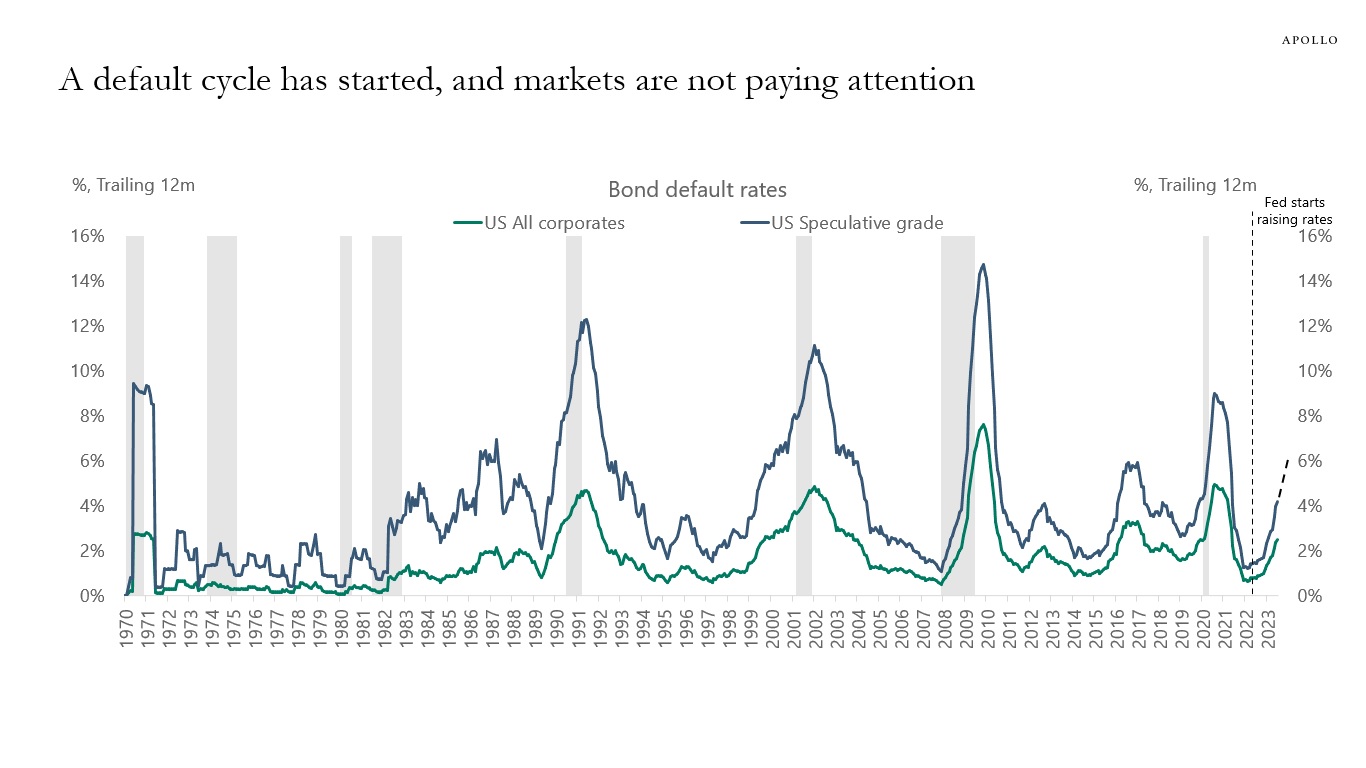
Source: Moody’s Analytics, Apollo Chief Economist See important disclaimers at the bottom of the page.
-
The IMD every year ranks the competitiveness of countries by comparing indicators for Infrastructure, Business Efficiency, Government Efficiency, and Economic Performance, see table below.
Over the past decade, Germany has moved from being the ninth most competitive economy in the world to currently number 22. The current rankings for Germany across the four categories are: Infrastructure (14), Business Efficiency (29), Government Efficiency (27), and Economic Performance (12).
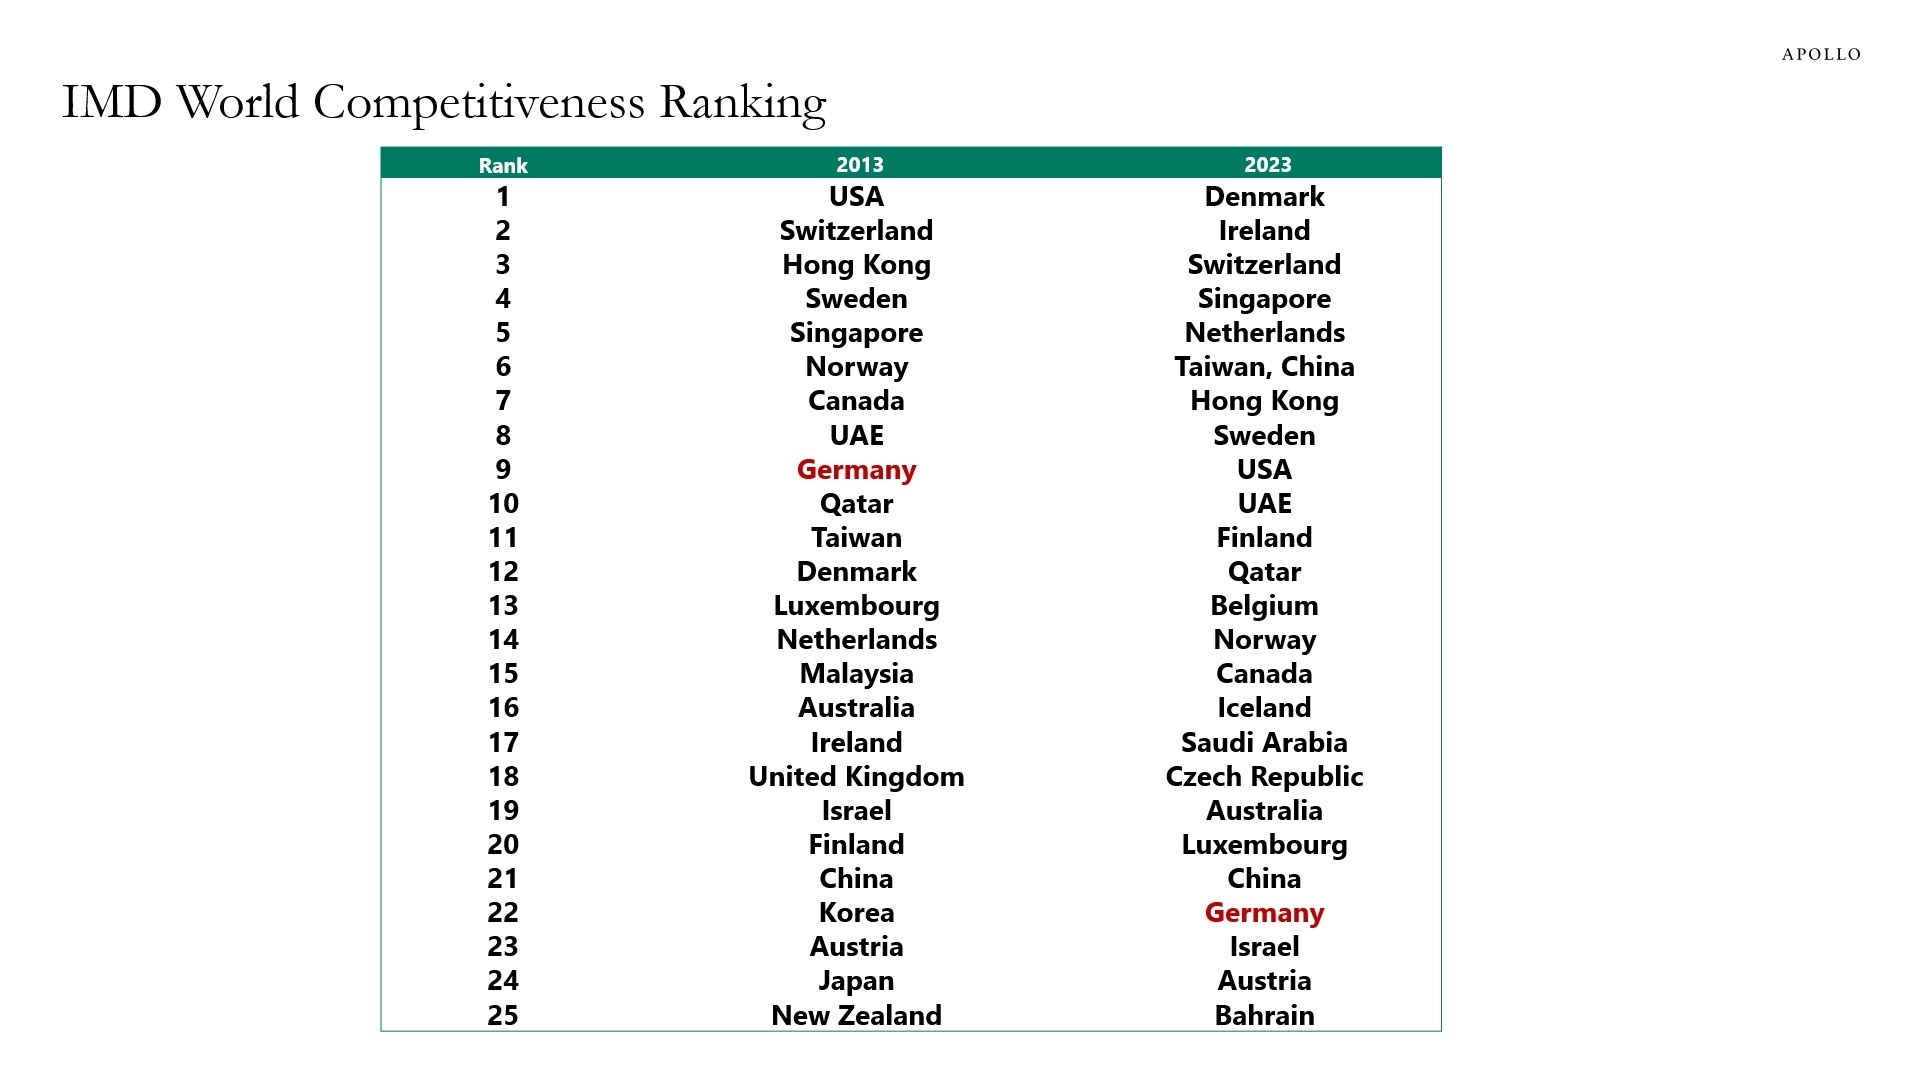
Source: IMD, Apollo Chief Economist. Note: The IMD World Competitiveness Ranking is based on 336 indicators under four categories: Infrastructure, Business Efficiency, Government Efficiency, and Economic Performance. See important disclaimers at the bottom of the page.
-
When interest rates increase, holders of fixed income get a higher cash flow. The problem is that the Fed and foreigners own 50% of Treasuries outstanding, and foreigners own 28% of IG and HY credit outstanding, so a lot of the additional cash flow created by higher US yields is not boosting US GDP growth.
The bottom line is that higher interest rates are a net negative for the US economy, see also the third chart, which shows the effects on US GDP as a result of raising the Fed funds rate 5%-points using a model similar to the Fed’s FRB/US model of the US economy.
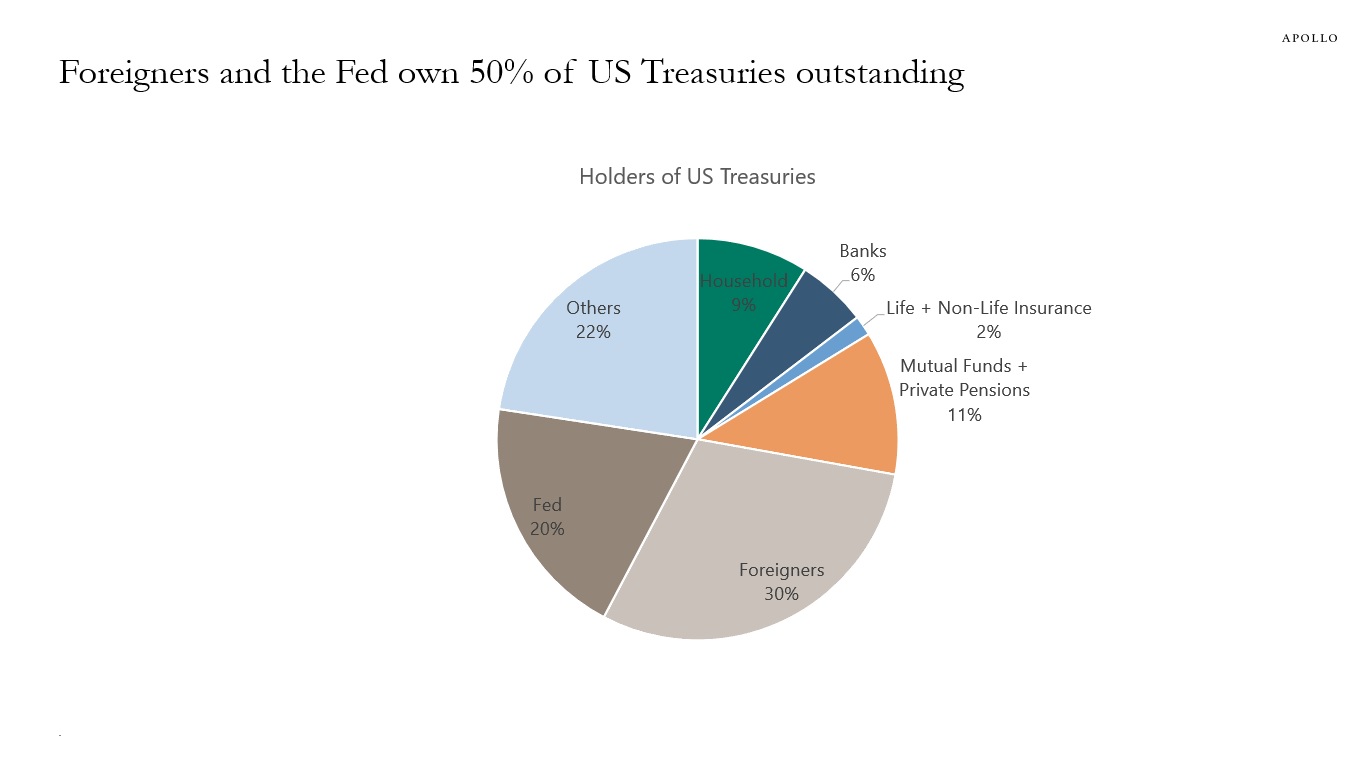
Source: FRB, Haver Analytics, Apollo Chief Economist. “Others” include nonfinancial businesses, state and local governments, and federal government retirement funds. 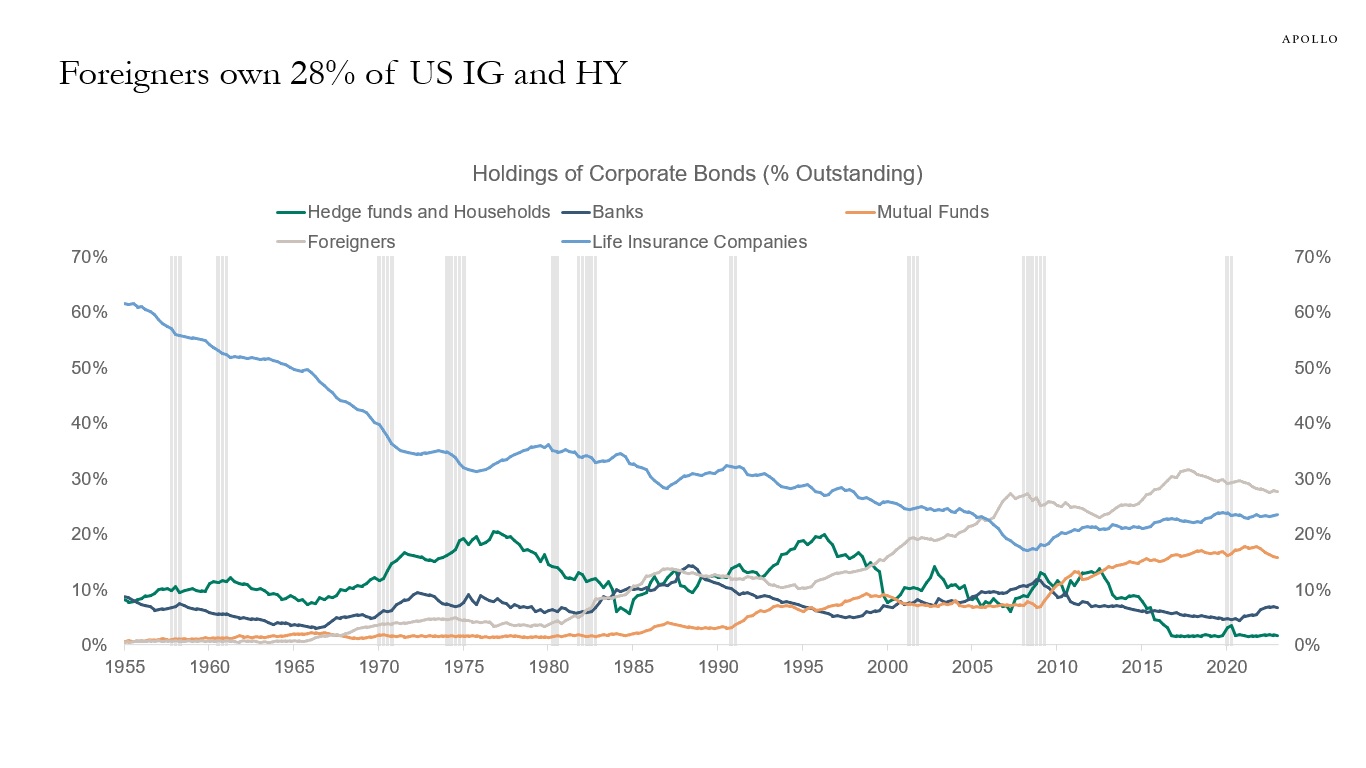
Source: FFUNDS, Haver, Apollo Chief Economist 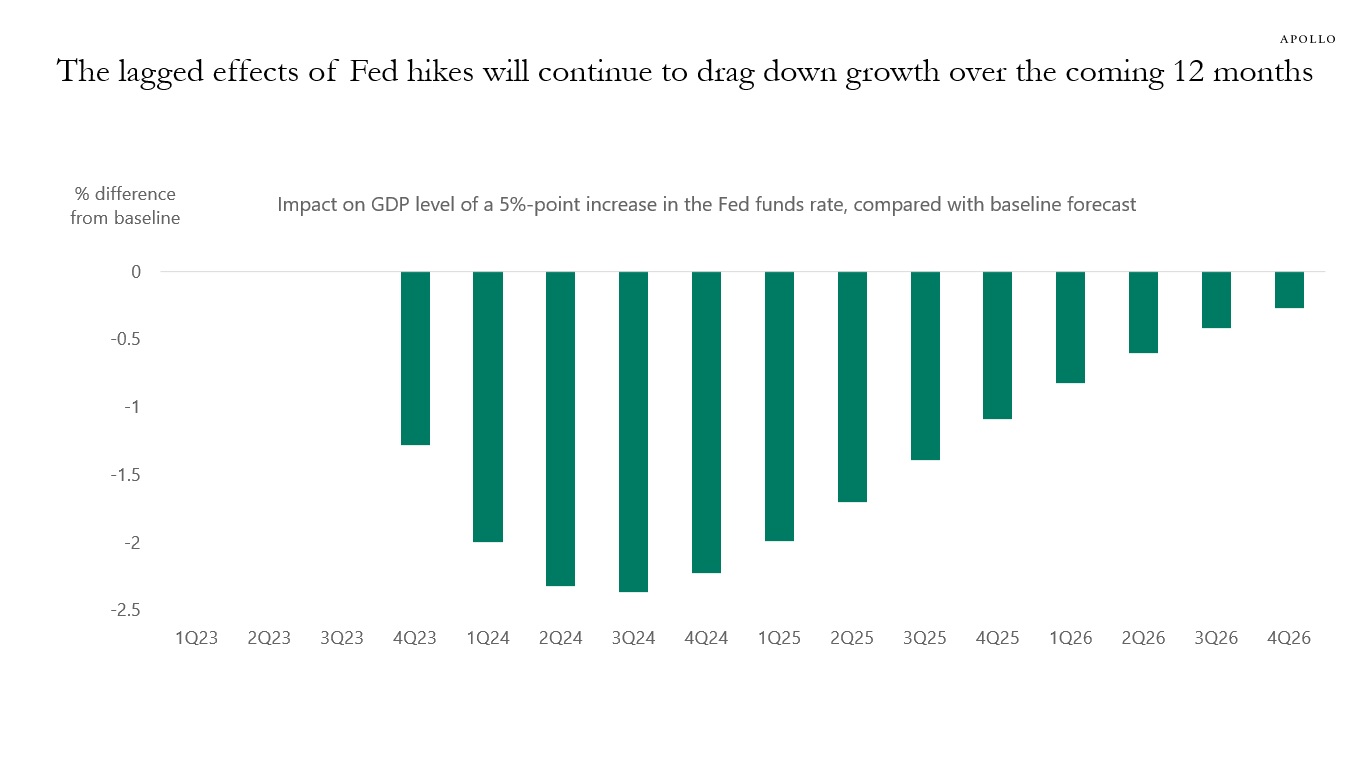
Source: Bloomberg, Apollo Chief Economist. Note: 500bps monetary policy shock in 3Q23. See important disclaimers at the bottom of the page.
-
Interest rates are rising, the annual debt servicing cost of the US government is close to $1 trillion, and the net interest expense as a share of total government revenues is near all-time high levels, see charts below.
The implication for markets is that higher rates are not only slowing down consumers and corporates through higher borrowing costs. Higher rates are also a drag on growth through higher debt servicing costs for the government. In other words, higher debt servicing costs are impacting not only consumers and corporates but also the government.
The bottom line is that when government debt levels are high, it is more difficult for interest rates to stay elevated for a long time because the negative impact on the economy of higher rates is also working through higher debt servicing costs for the government.
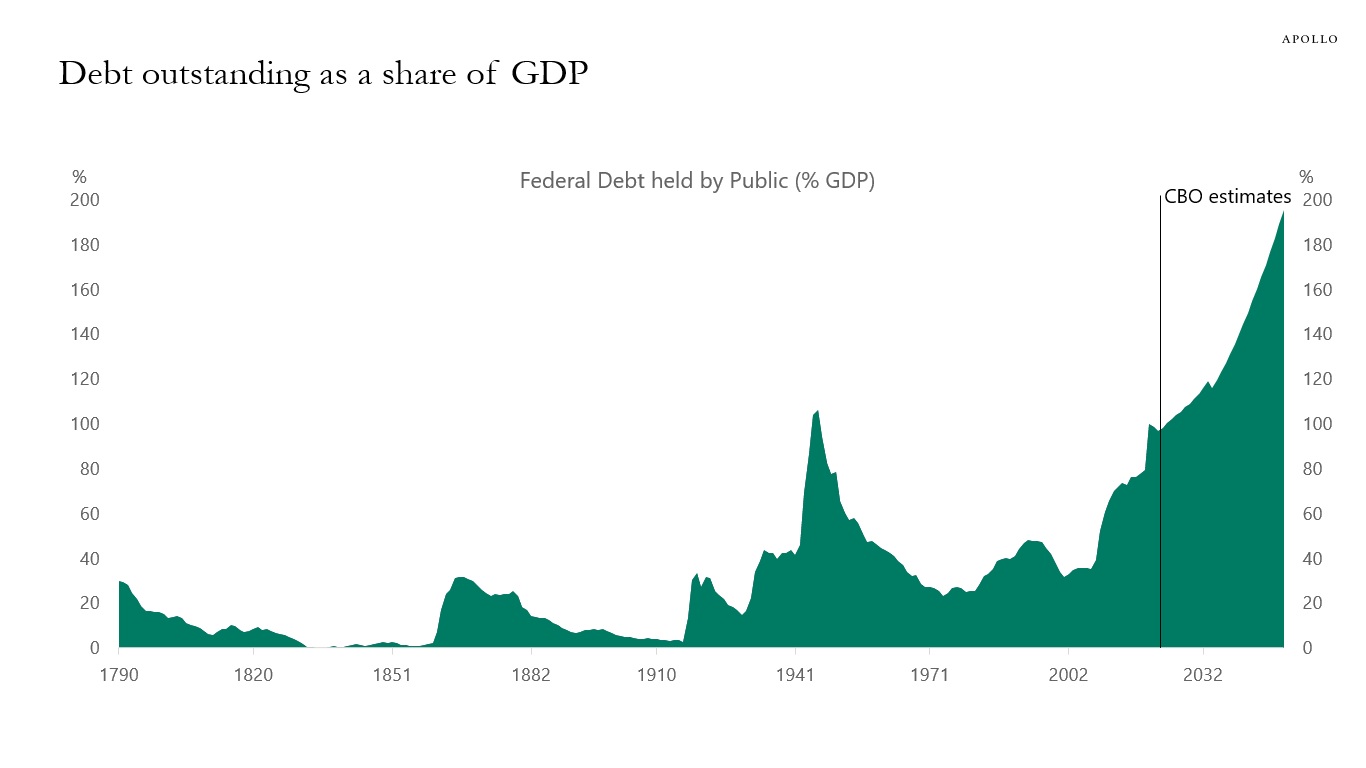
Source: CBO, Haver Analytics, Apollo Chief Economist 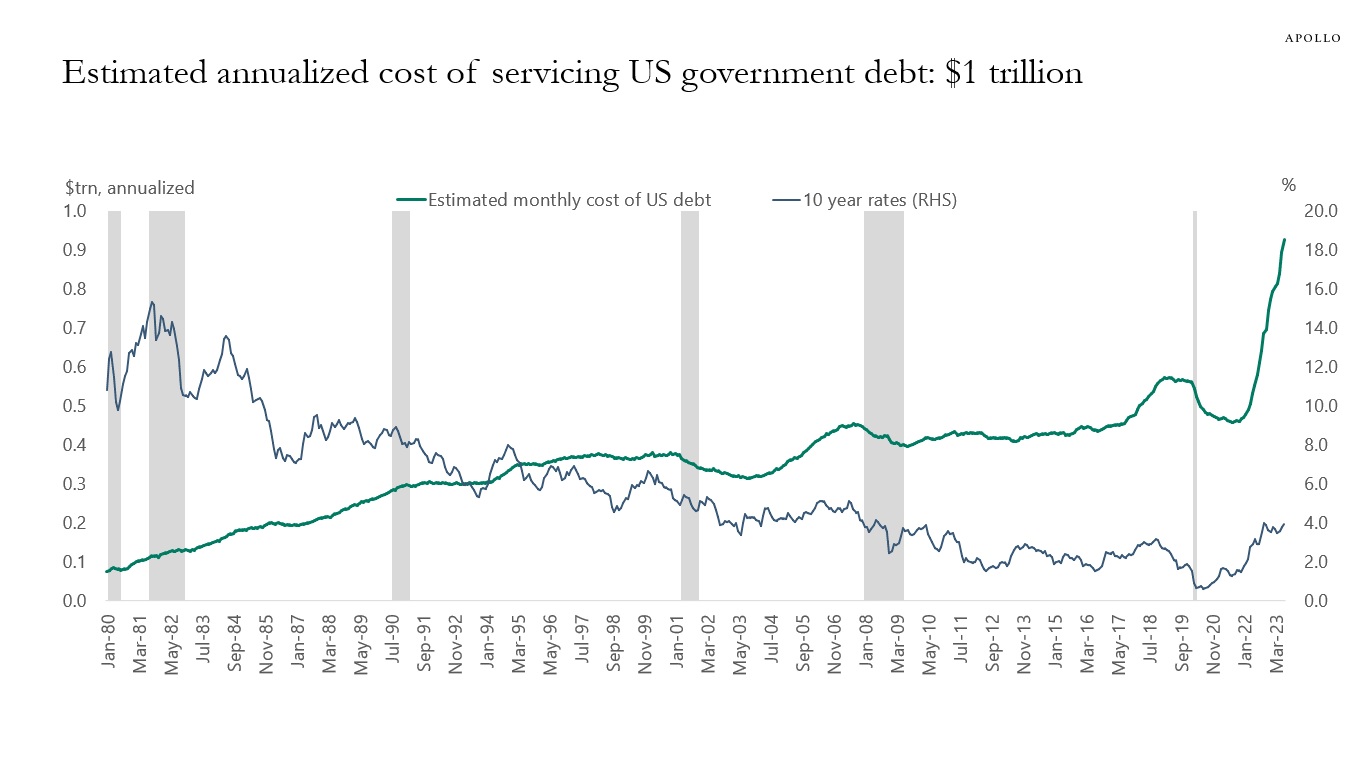
Source: Treasury, Haver Analytics, Apollo Chief Economist. Note: Estimated monthly cost is calculated as average interest rate total outstanding in marketable and non-marketable debt and includes public debt and intragovernmental holdings. 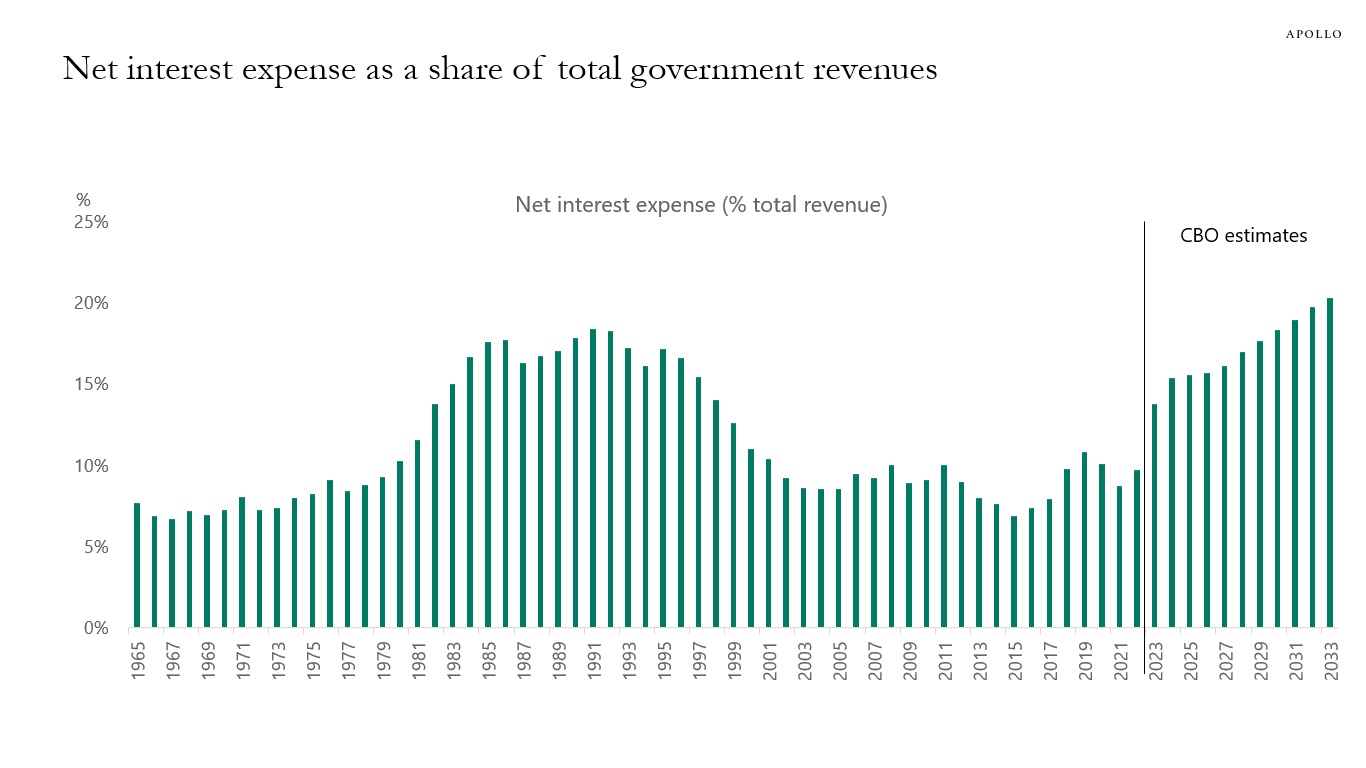
Source: CBO, Haver Analytics, Apollo Chief Economist 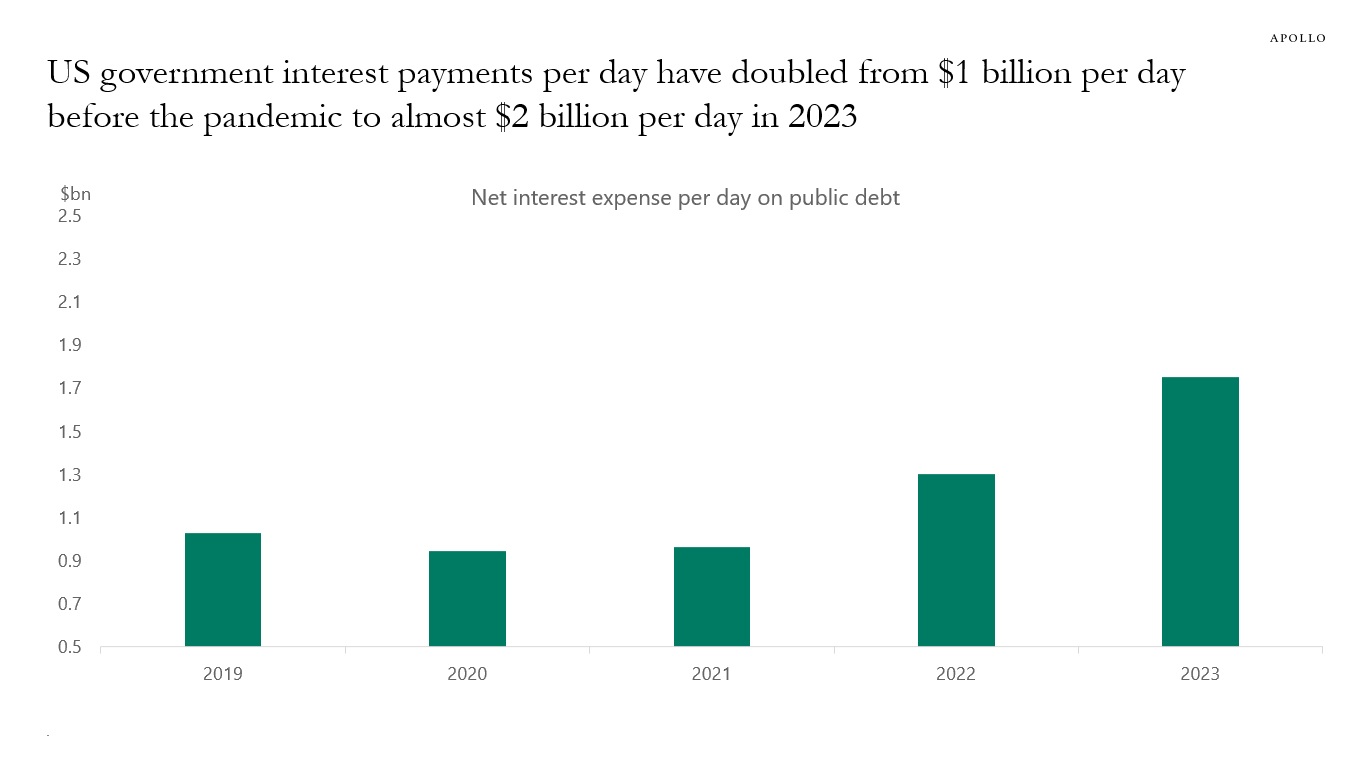
Source: CBO, Haver Analytics, Apollo Chief Economist. Note: Interest rate assumptions by CBO: 2.1% in 2022 and 2.7% in 2023. Annual CBO data divided by 365. See important disclaimers at the bottom of the page.

This presentation may not be distributed, transmitted or otherwise communicated to others in whole or in part without the express consent of Apollo Global Management, Inc. (together with its subsidiaries, “Apollo”).
Apollo makes no representation or warranty, expressed or implied, with respect to the accuracy, reasonableness, or completeness of any of the statements made during this presentation, including, but not limited to, statements obtained from third parties. Opinions, estimates and projections constitute the current judgment of the speaker as of the date indicated. They do not necessarily reflect the views and opinions of Apollo and are subject to change at any time without notice. Apollo does not have any responsibility to update this presentation to account for such changes. There can be no assurance that any trends discussed during this presentation will continue.
Statements made throughout this presentation are not intended to provide, and should not be relied upon for, accounting, legal or tax advice and do not constitute an investment recommendation or investment advice. Investors should make an independent investigation of the information discussed during this presentation, including consulting their tax, legal, accounting or other advisors about such information. Apollo does not act for you and is not responsible for providing you with the protections afforded to its clients. This presentation does not constitute an offer to sell, or the solicitation of an offer to buy, any security, product or service, including interest in any investment product or fund or account managed or advised by Apollo.
Certain statements made throughout this presentation may be “forward-looking” in nature. Due to various risks and uncertainties, actual events or results may differ materially from those reflected or contemplated in such forward-looking information. As such, undue reliance should not be placed on such statements. Forward-looking statements may be identified by the use of terminology including, but not limited to, “may”, “will”, “should”, “expect”, “anticipate”, “target”, “project”, “estimate”, “intend”, “continue” or “believe” or the negatives thereof or other variations thereon or comparable terminology.