Want it delivered daily to your inbox?
-
Almost half of US households have used Buy Now Pay Later (BNPL), see chart below.
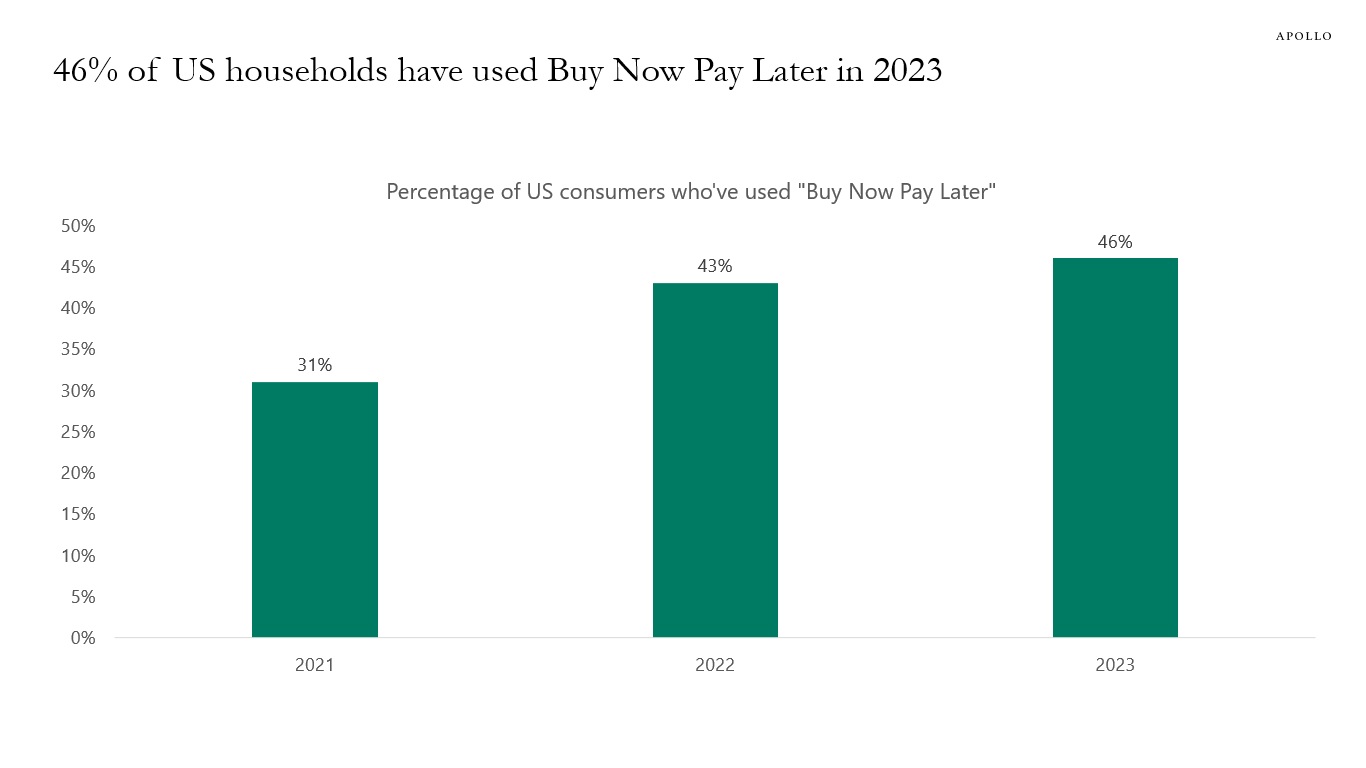
Source: LendingTree, Apollo Chief Economist. Survey of 1,000+ consumers conducted in March 2021, March 2022, and March 2023. See important disclaimers at the bottom of the page.
-
One source of upward pressure on US rates is the $7.6 trillion in US government bonds that will mature over the coming 12 months, see chart below.
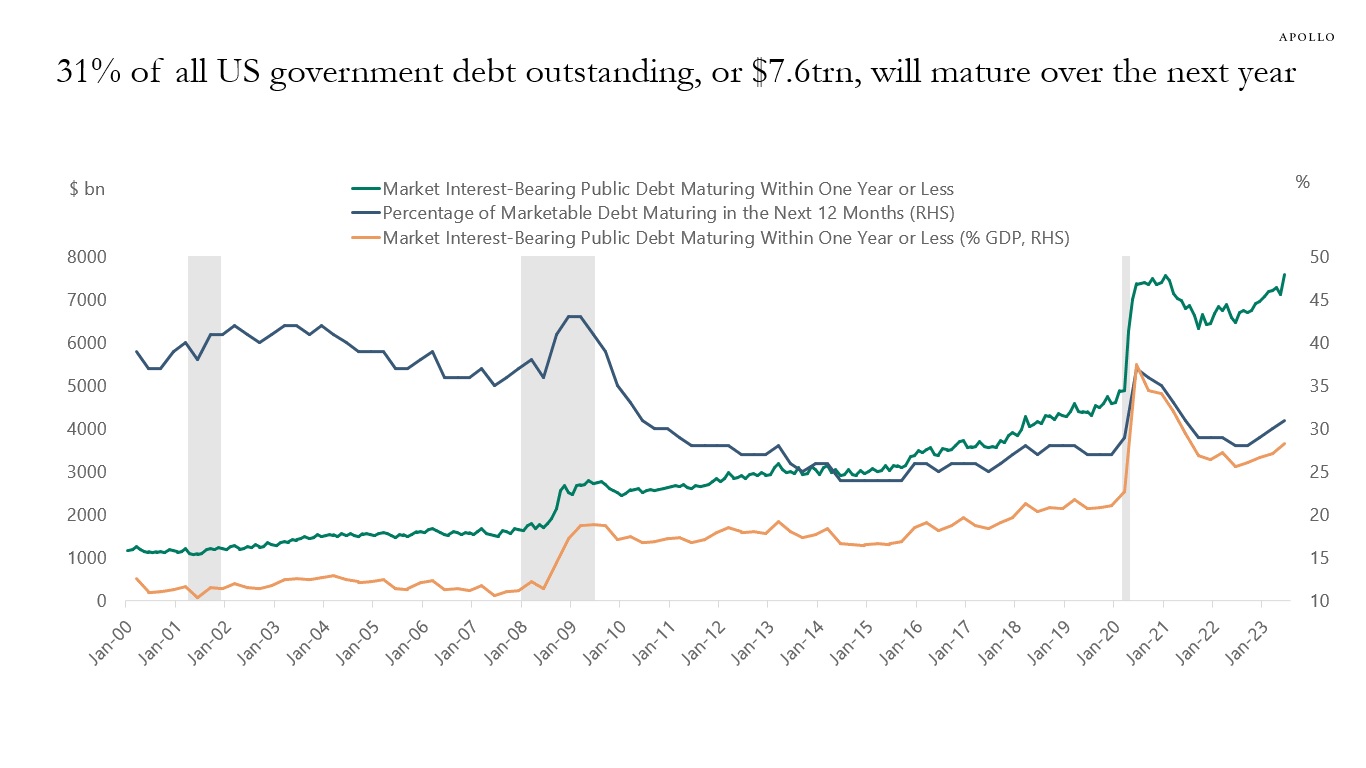
Source: Treasury, BEA, Haver Analytics, Apollo Chief Economist See important disclaimers at the bottom of the page.
-
The share of Chinese exports to the US, Europe, and Japan has declined steadily over the past 20 years, see the first chart below.
Similarly, China is today the top export destination for eight of the G20 countries, up from zero in 2000, see maps below.
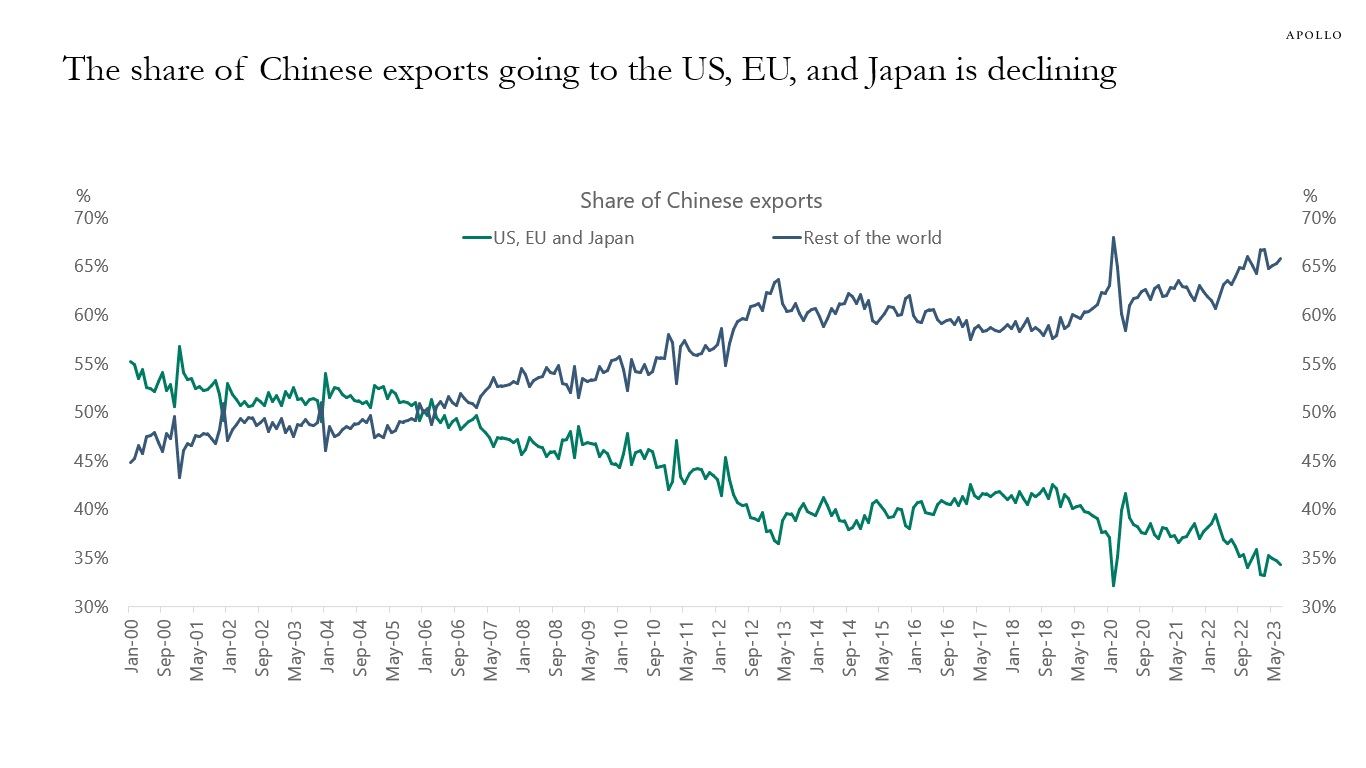
Source: General Administration of Customs (China), Haver Analytics, Apollo Chief Economist 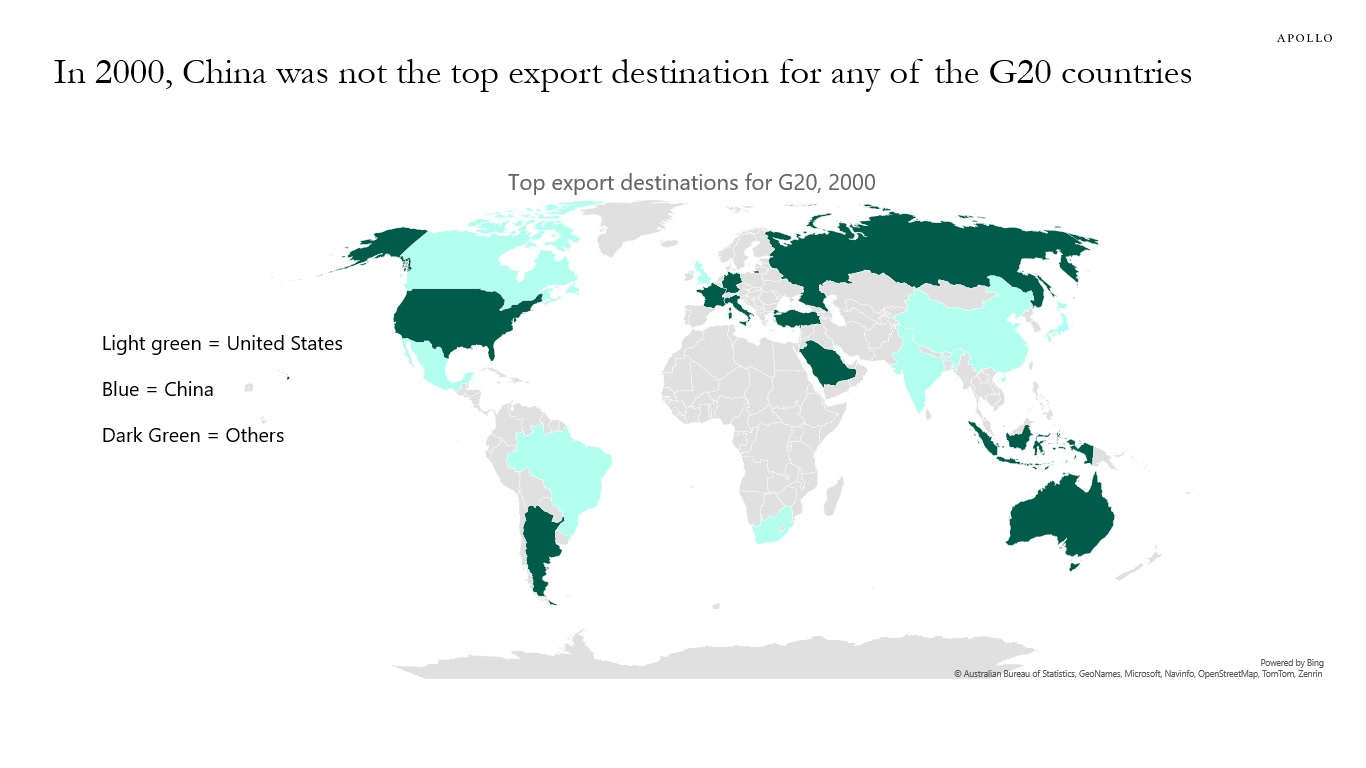
Source: IMF DOT, Haver Analytics, Apollo Chief Economist 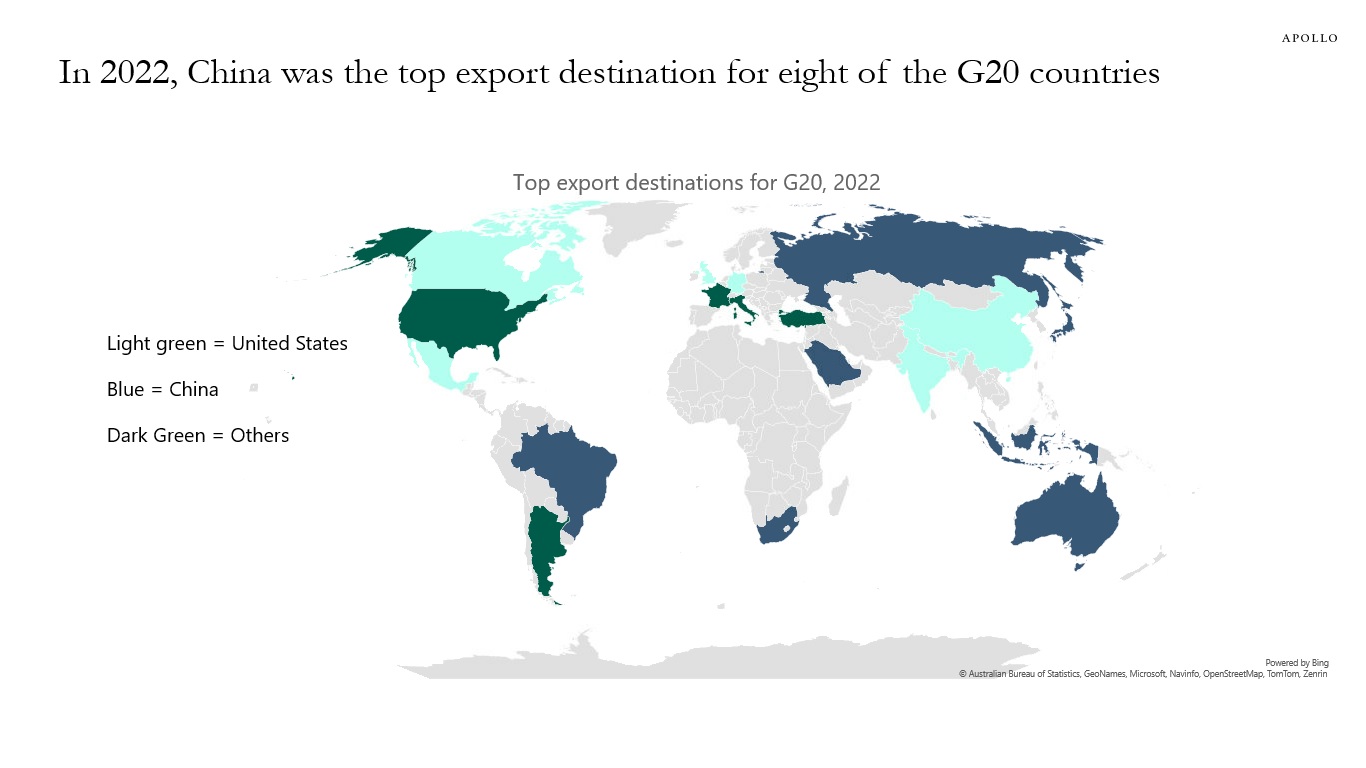
Source: IMF DOT, Haver Analytics, Apollo Chief Economist See important disclaimers at the bottom of the page.
-
We have updated our estimates of how much excess savings households have left using the Fed’s methodology, and the conclusion is that consumers are almost out of pandemic savings, see chart below.
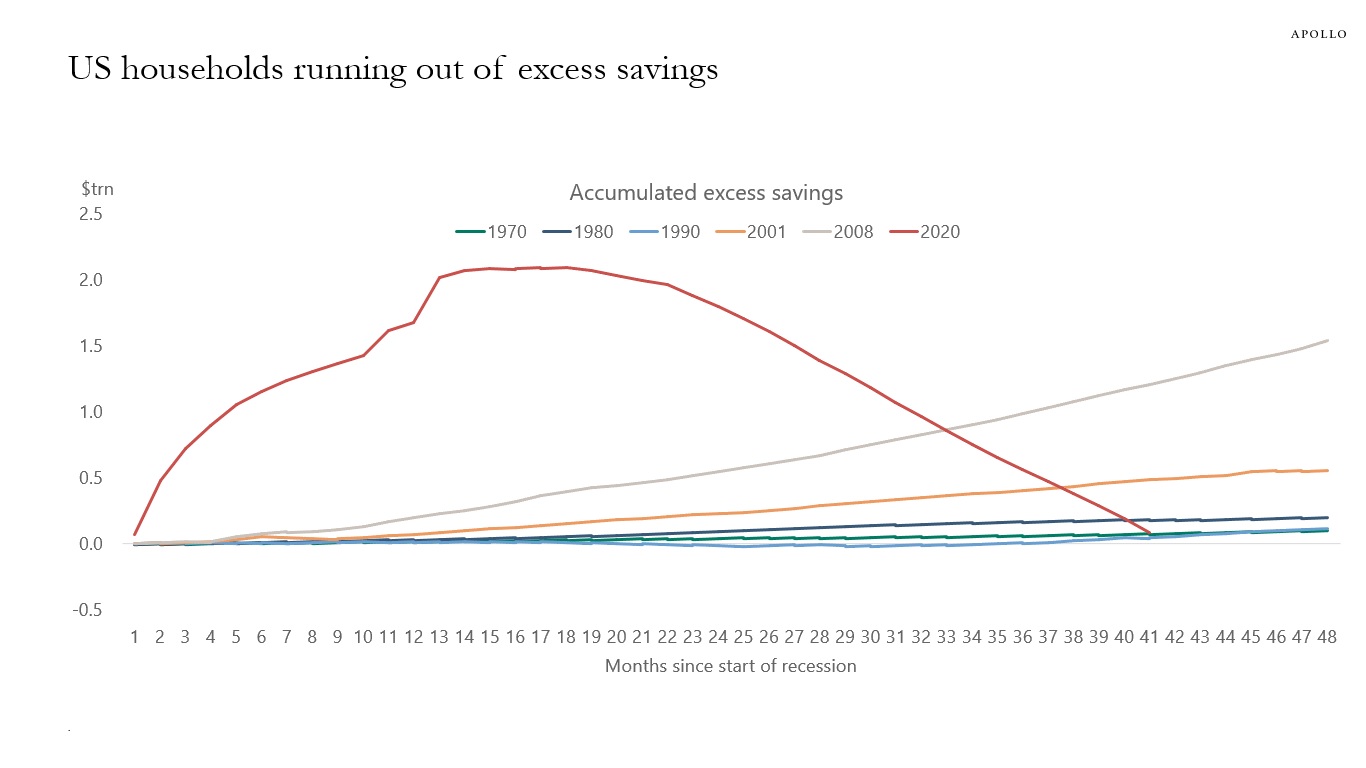
Source: BEA, Haver Analytics, Apollo Chief Economist.
Note: Excess savings are calculated as the accumulated difference between actual personal savings and the trend implied by data for the 48 months leading up to the first month of each recession, as defined by the NBER.See important disclaimers at the bottom of the page.
-
IG and HY issuance are higher in September, and this is a technical headwind to credit markets over the coming weeks, see charts below.
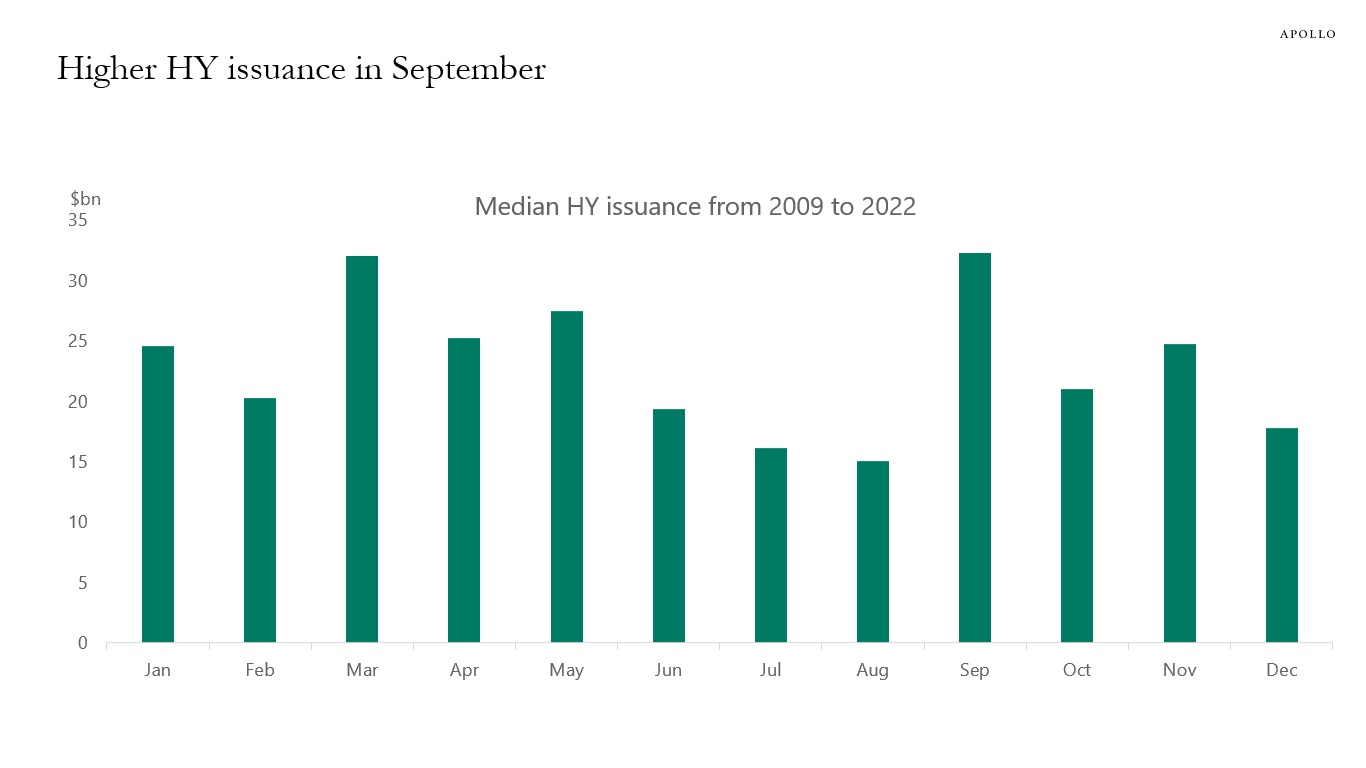
Source: Pitchbook LCD, Apollo Chief Economist 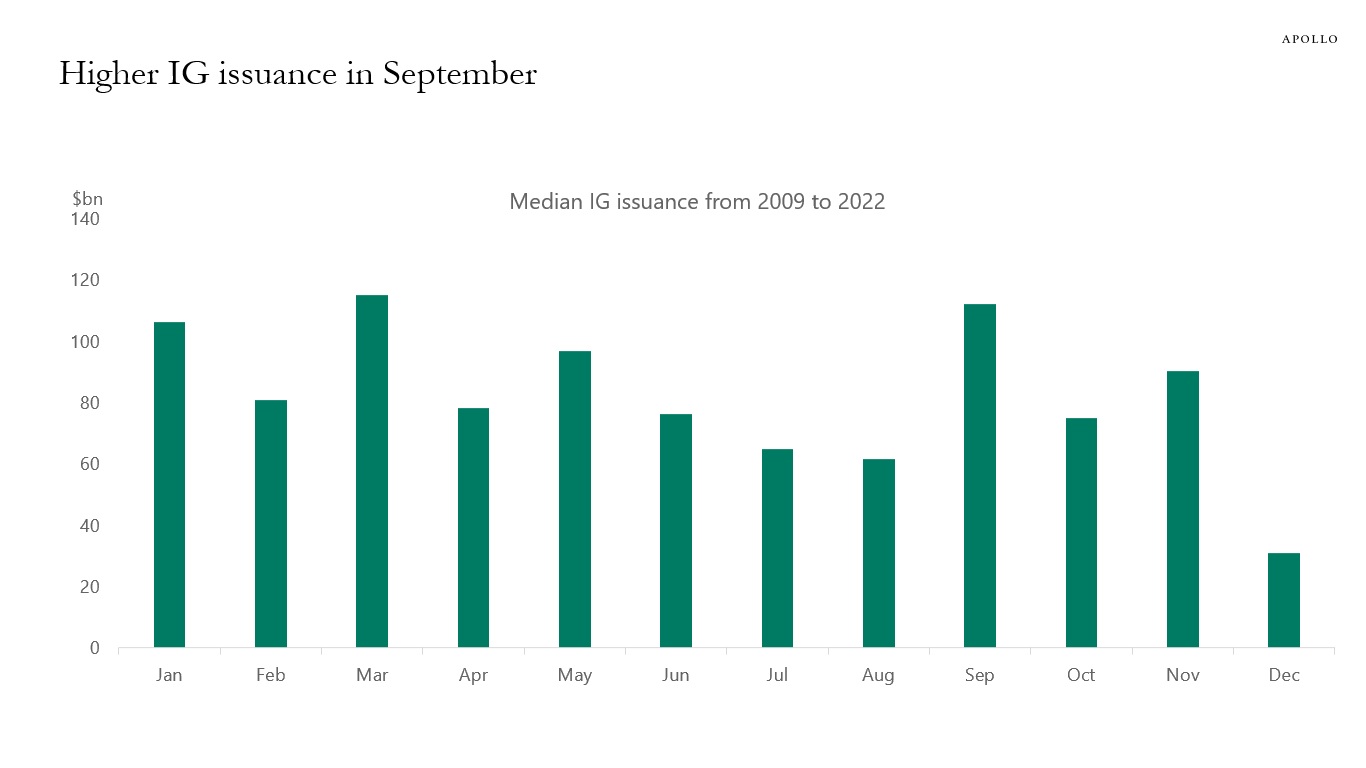
Source: Pitchbook LCD, Apollo Chief Economist See important disclaimers at the bottom of the page.
-
Markets think the inflation problem has been solved. But that is the wrong conclusion.
The chart below shows that supercore inflation, which is the Fed’s preferred measure of inflation because it excludes housing, is sticky at 4.5% and not showing any signs of moving down to the Fed’s 2% inflation target. In fact, supercore inflation increased in July because of strong inflation in financial services, transportation, food services, amusement parks, and sports.
The bottom line is that inflation is still a problem, and equity markets, credit markets, and rates markets are underestimating how much additional slowing is still needed in the service sector to get inflation under control.
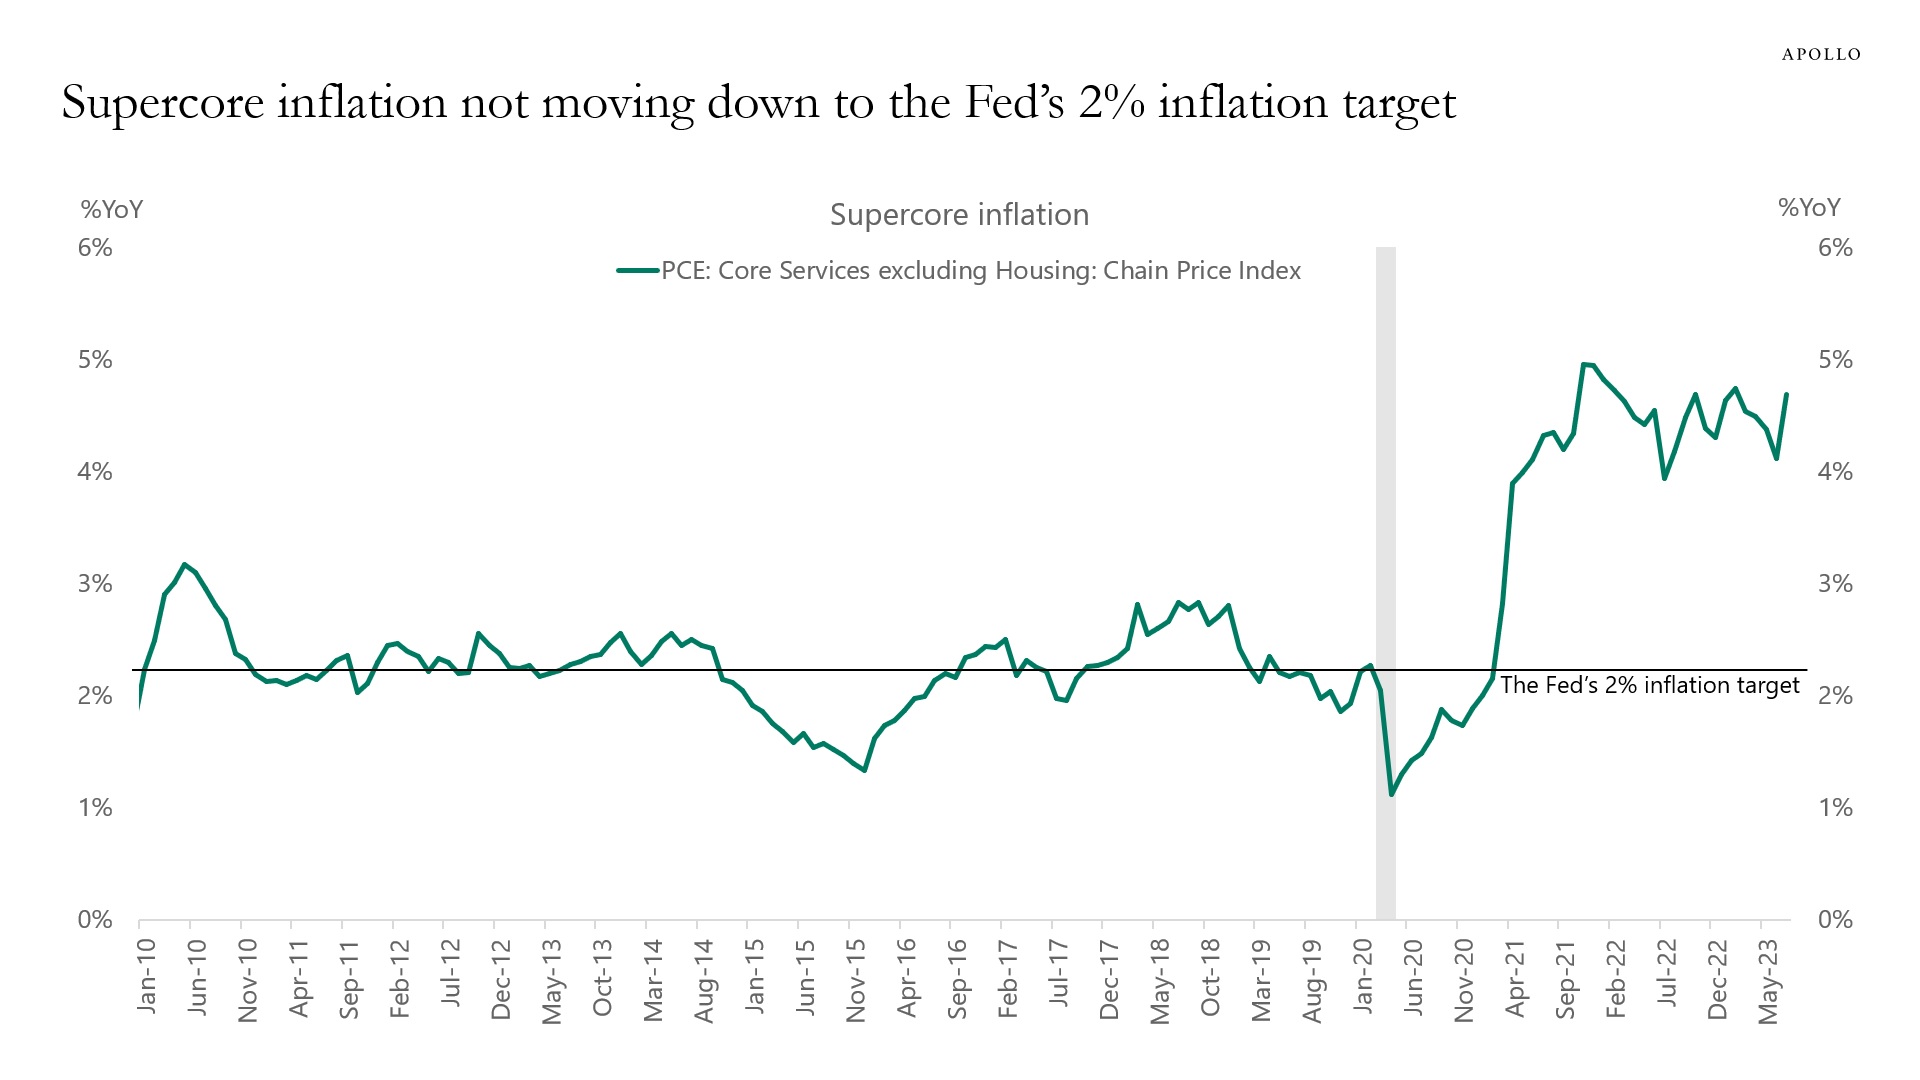
Source: BEA, Haver Analytics, Apollo Chief Economist See important disclaimers at the bottom of the page.
-
Since the Fed started raising rates in March 2022, deposits in the banking sector have declined by $862 billion, see the first chart.
Over the same period, almost the same amount, $896 billion, has gone into money market accounts, see the second chart.
Our banking sector chart book is available here. It shows that credit growth continues to slow, and bank lending conditions continue to tighten, see the third, fourth, and fifth charts.
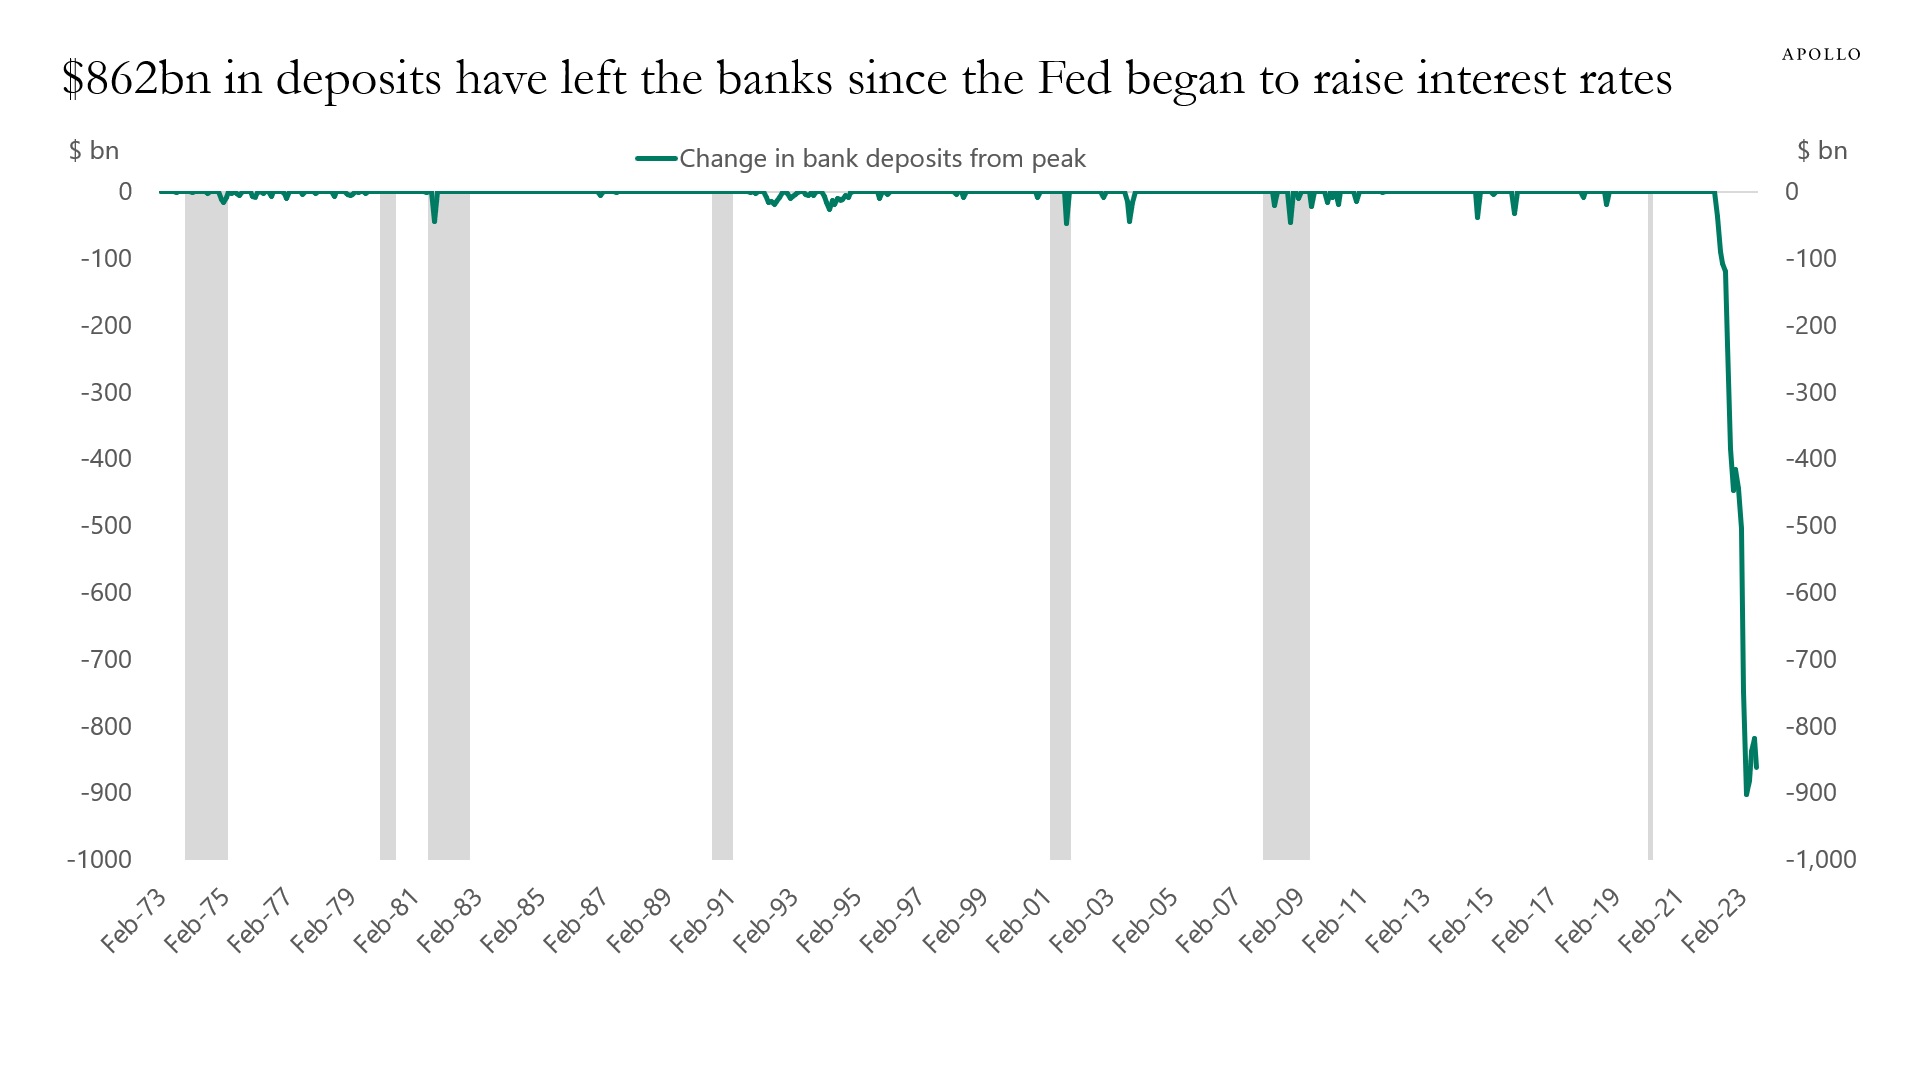
Source: Federal Reserve Board, Haver Analytics, Apollo Chief Economist. Note: March data as of 10th May 2023. Peak is defined as the month before monthly outflows turn negative. 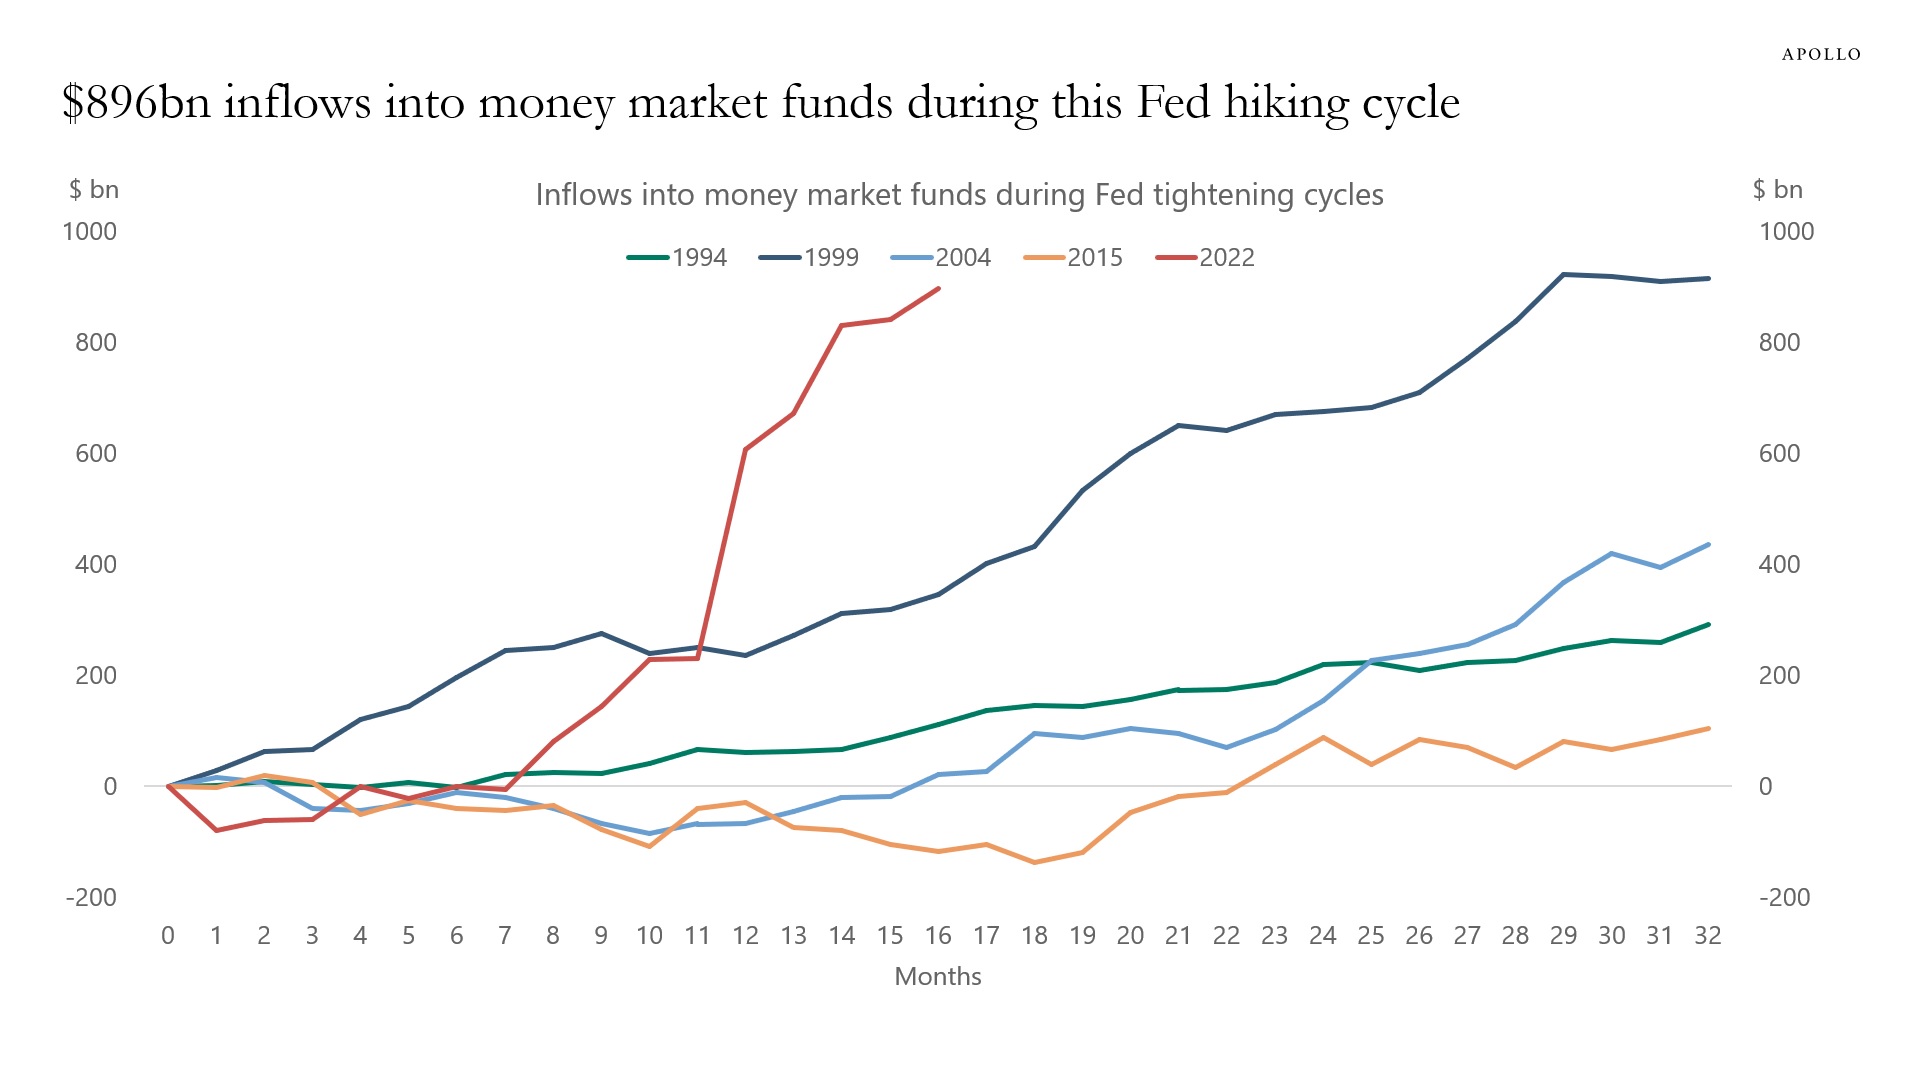
Source: FRB, ICI, Bloomberg, Apollo Chief Economist 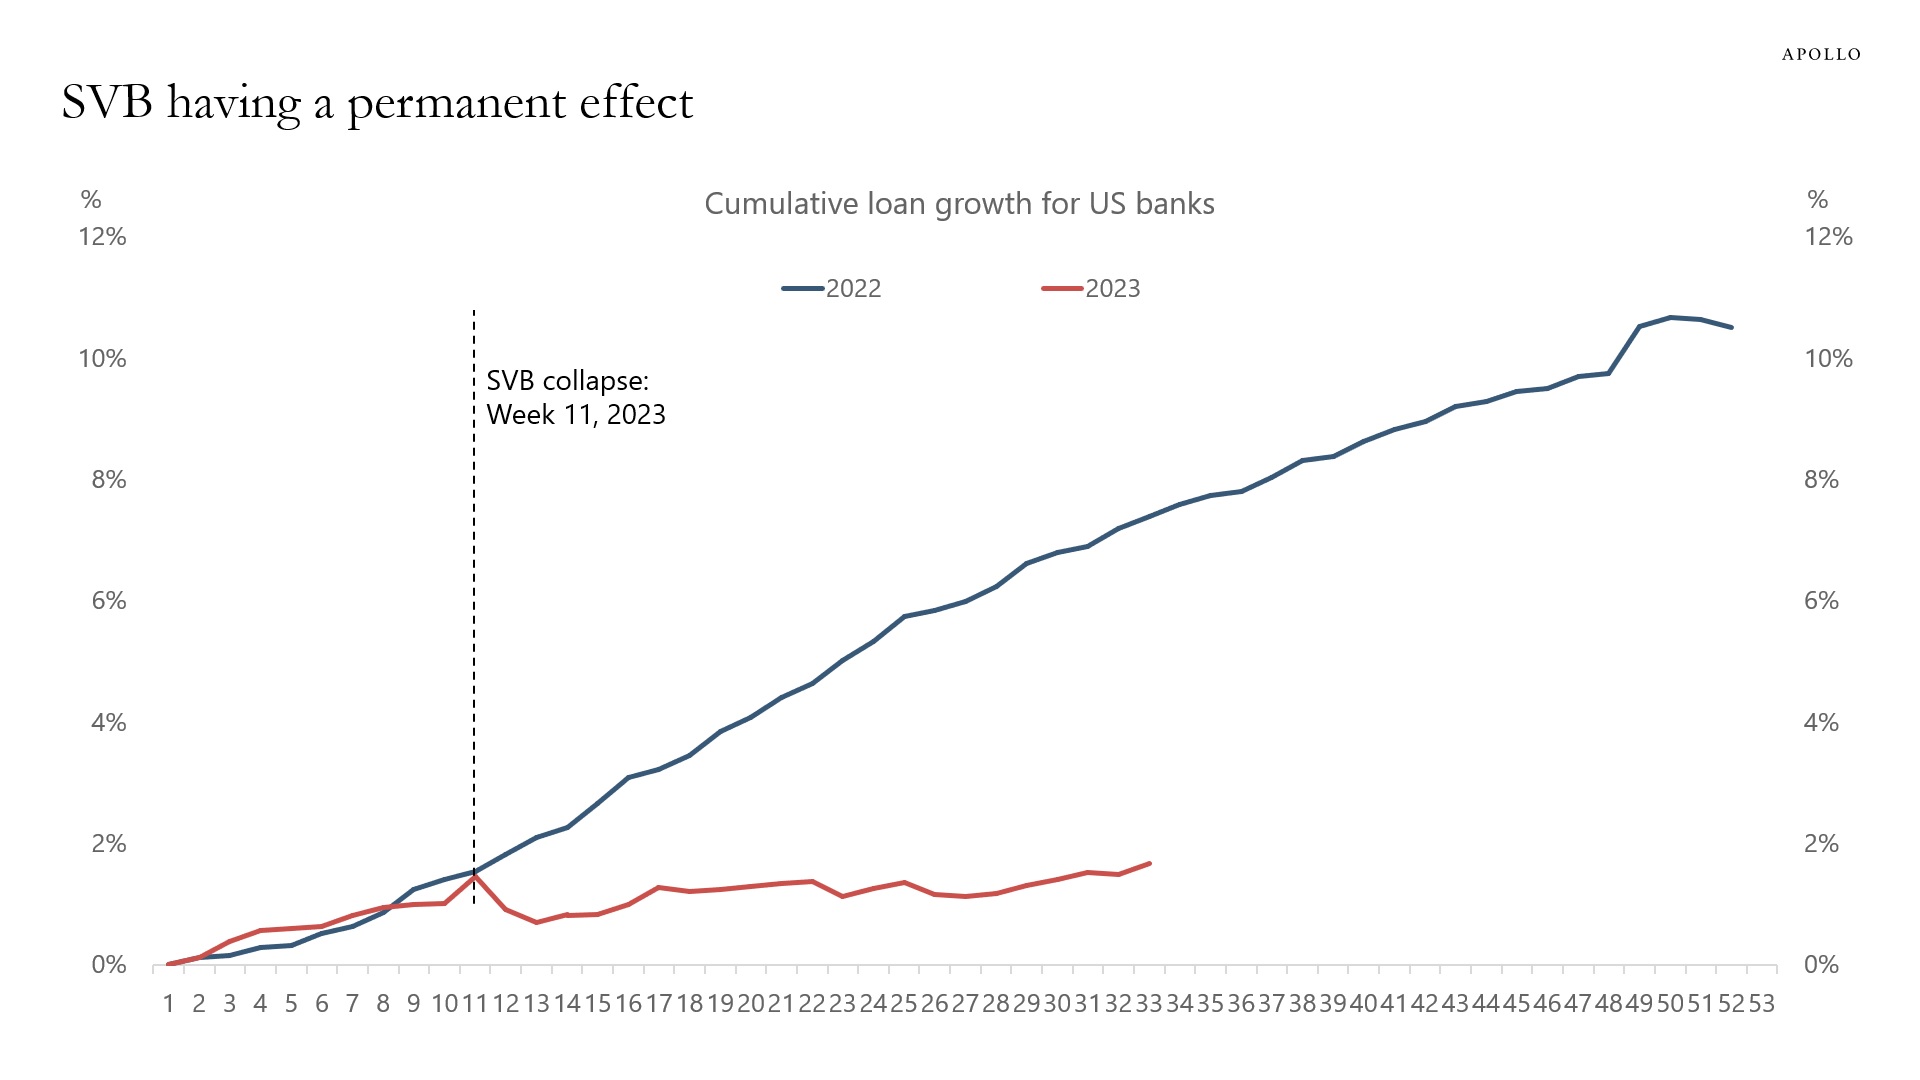
Source: FRB, Bloomberg, Apollo Chief Economist 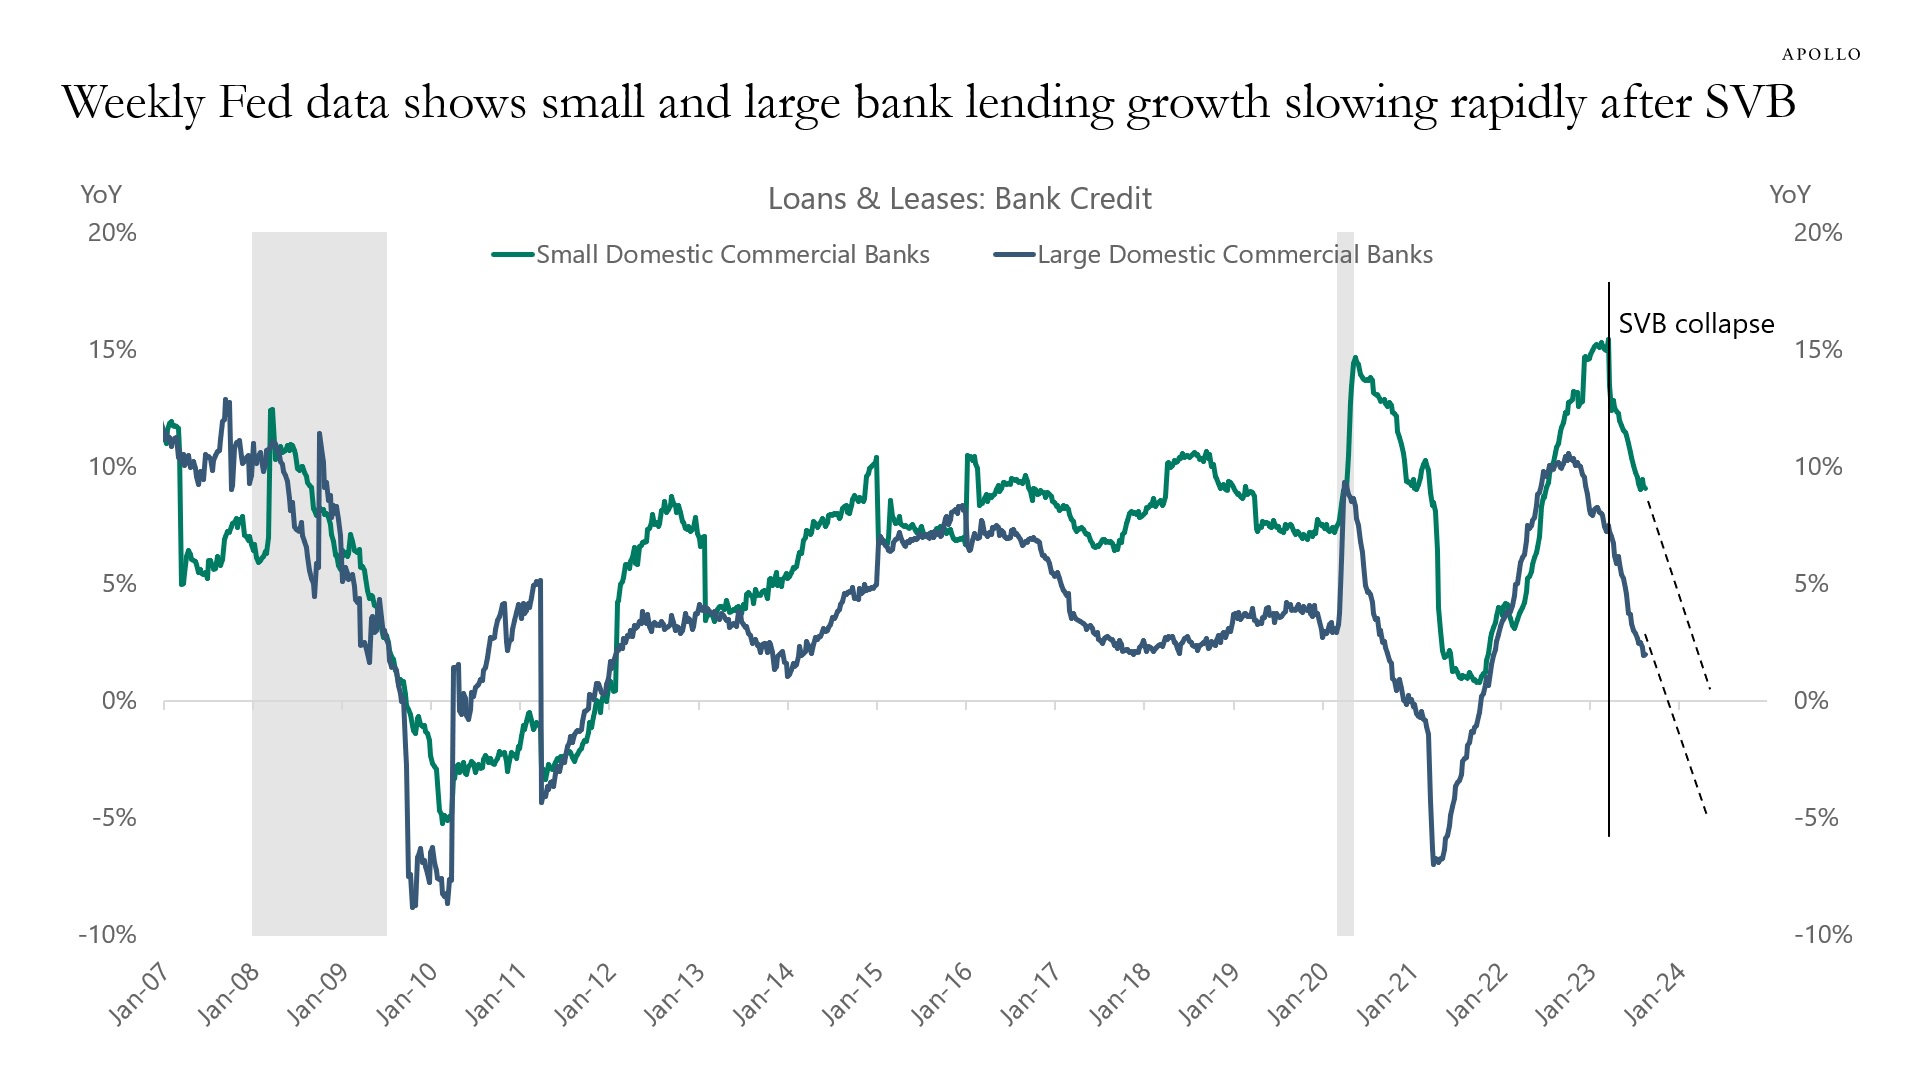
Source: Federal Reserve Board, Haver Analytics, Apollo Chief Economist 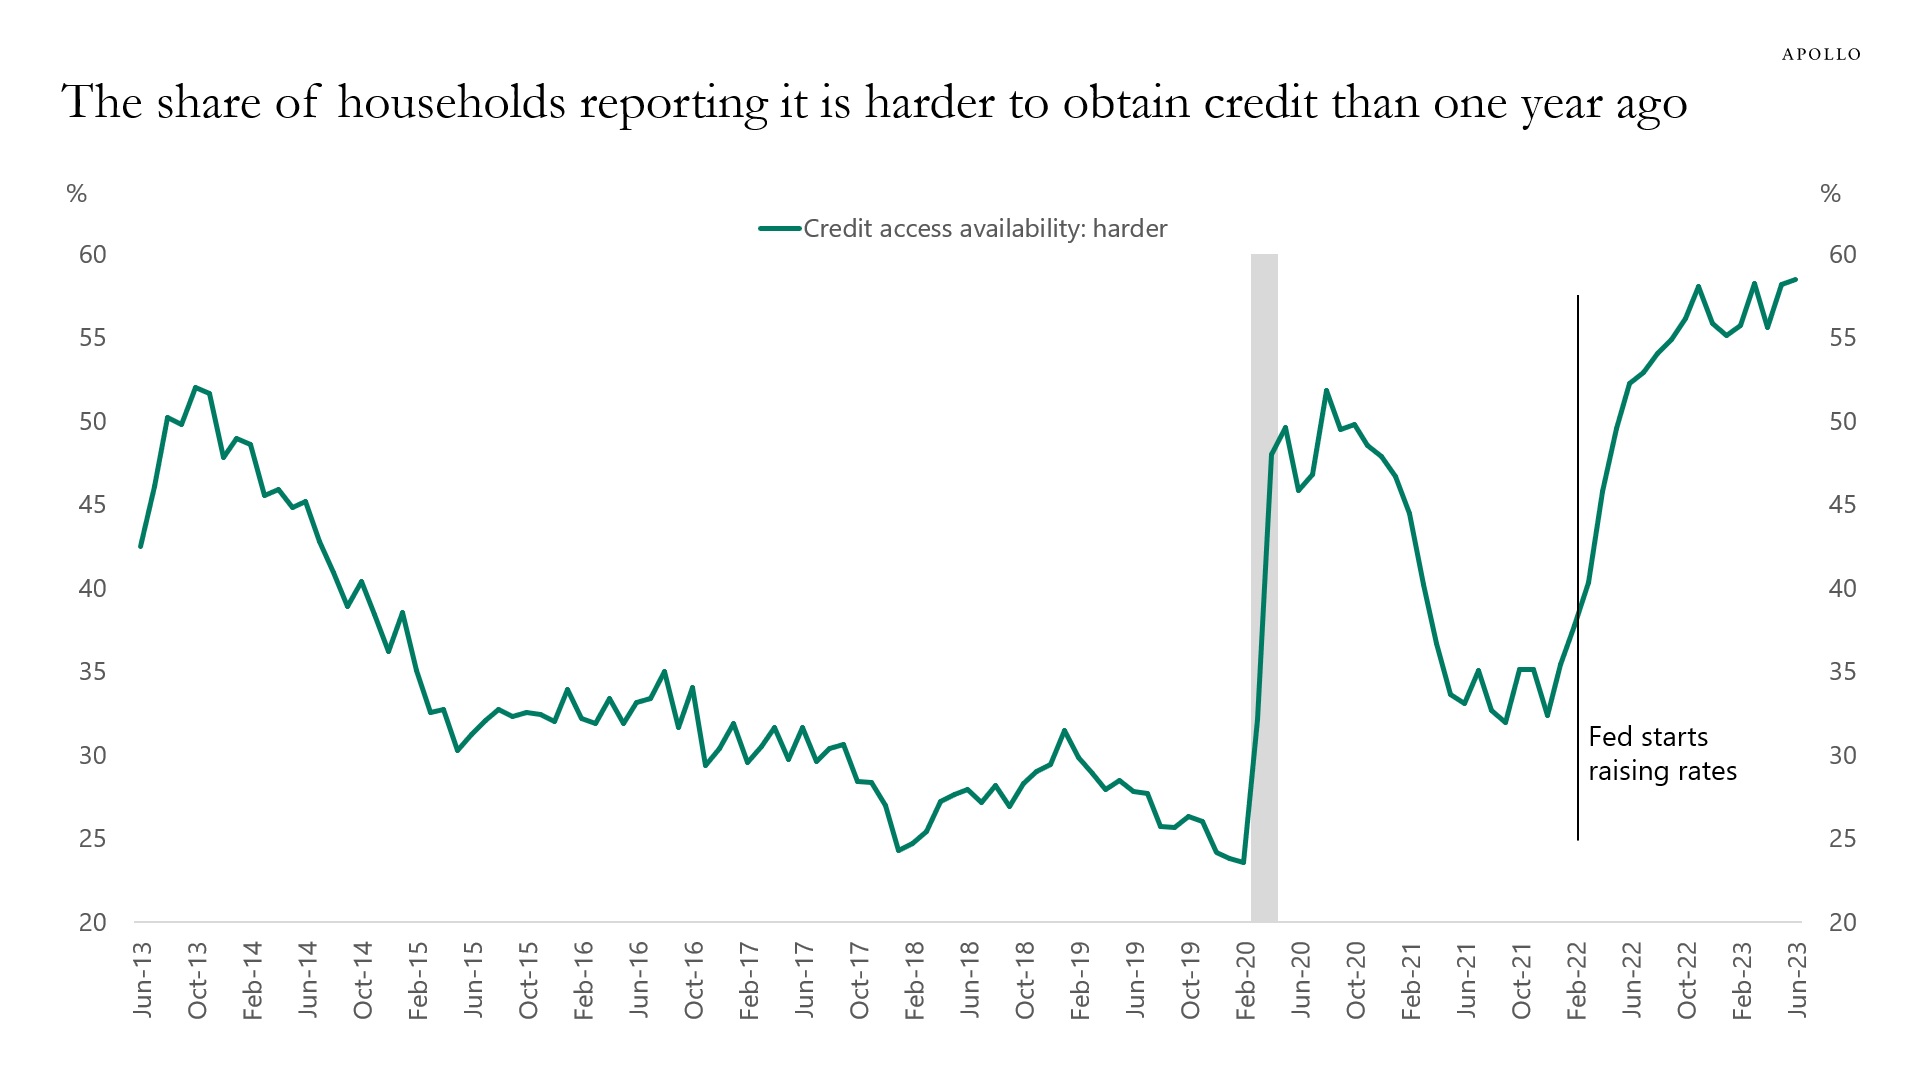
Source: FRBNY, Haver Analytics, Apollo Chief Economist. Note: Harder equals much harder + somewhat harder. See important disclaimers at the bottom of the page.
-
Since the ECB started raising rates in July 2022, corporate bankruptcies have trended higher, driven by transportation and storage; accommodation and food services; and education, health, and social activities—see chart below.
With the ECB keeping rates high well into 2024, we should expect these trends to continue.
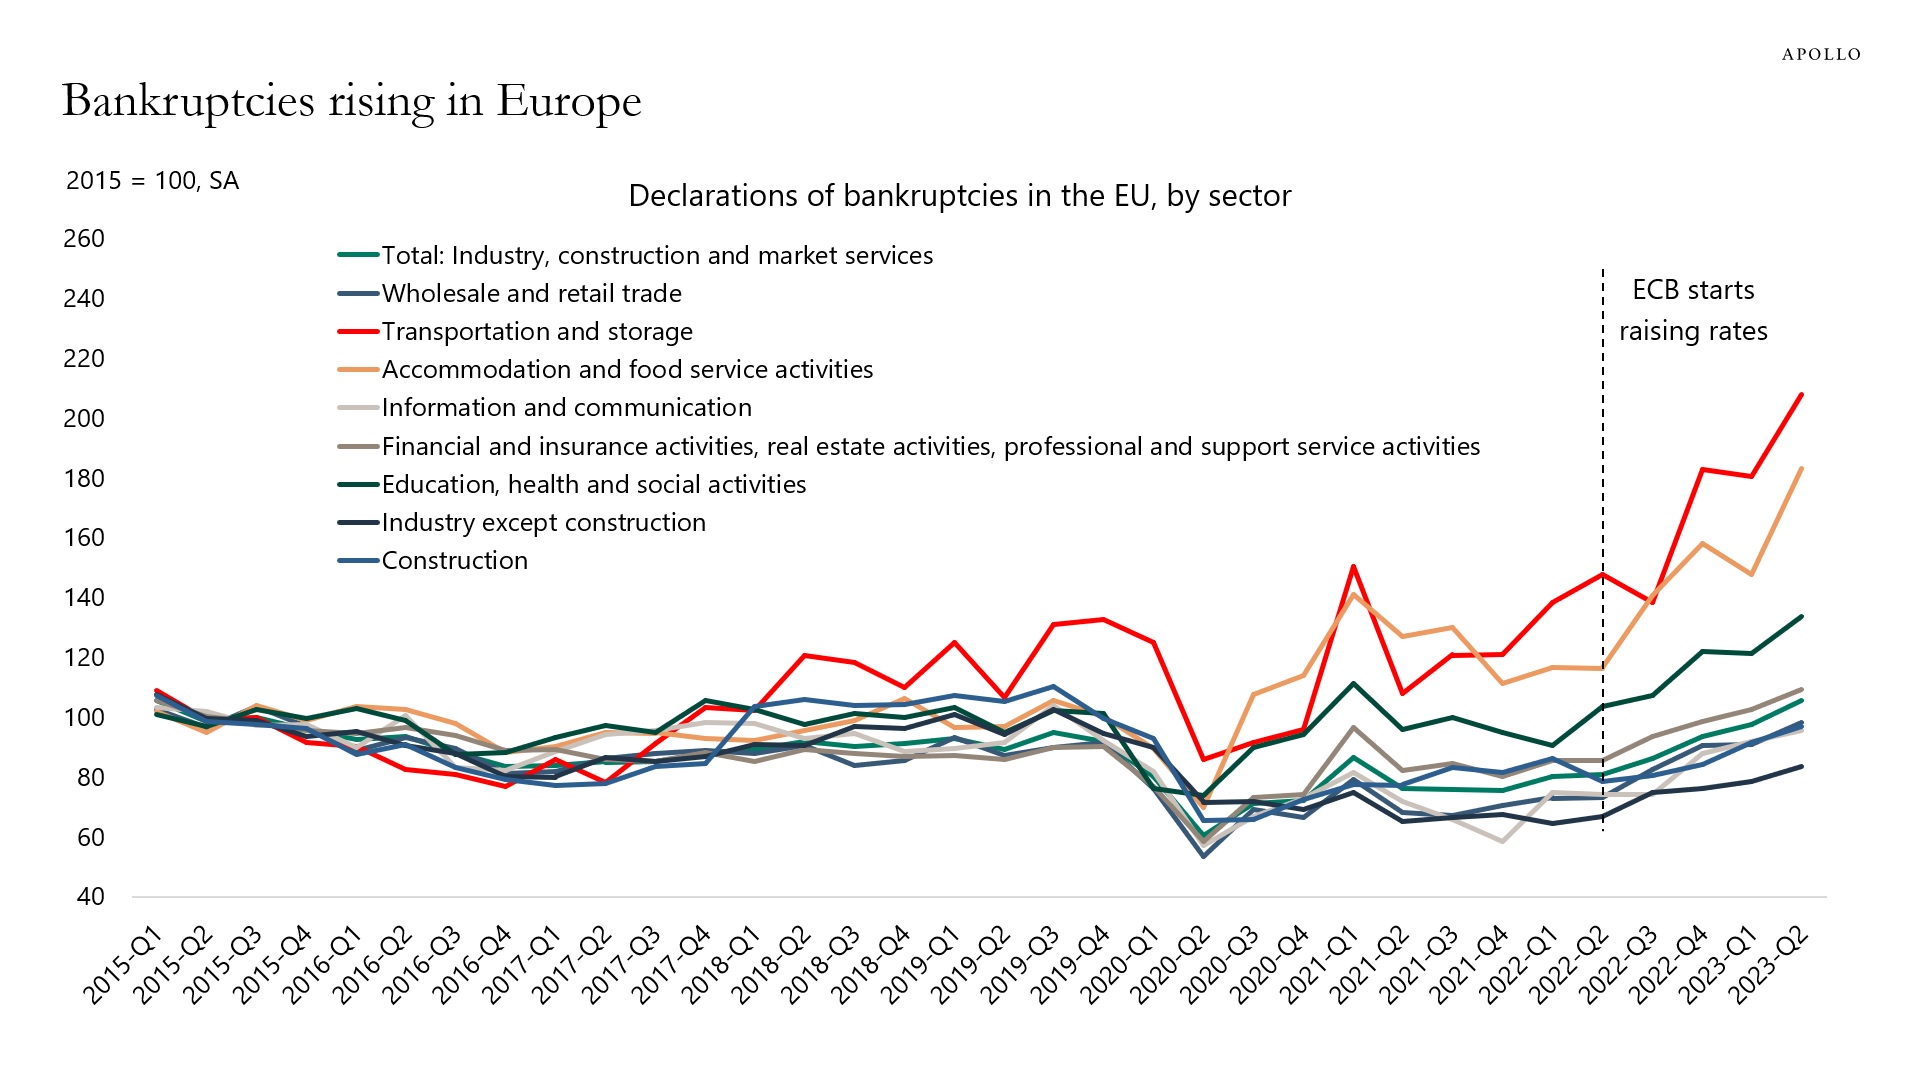
Source: ECB, Apollo Chief Economist See important disclaimers at the bottom of the page.
-
When interest rates increase, the household sector has to pay more for debt.
But when interest rates go up, households also receive higher cash flow on fixed-income assets.
Dividing households’ interest payments with households’ interest income shows that debt servicing costs as a share of interest income are at the highest level since 1959, see chart below.
In other words, both debt servicing costs and interest payments have increased as the Fed has raised interest rates. But debt servicing costs have just increased more.
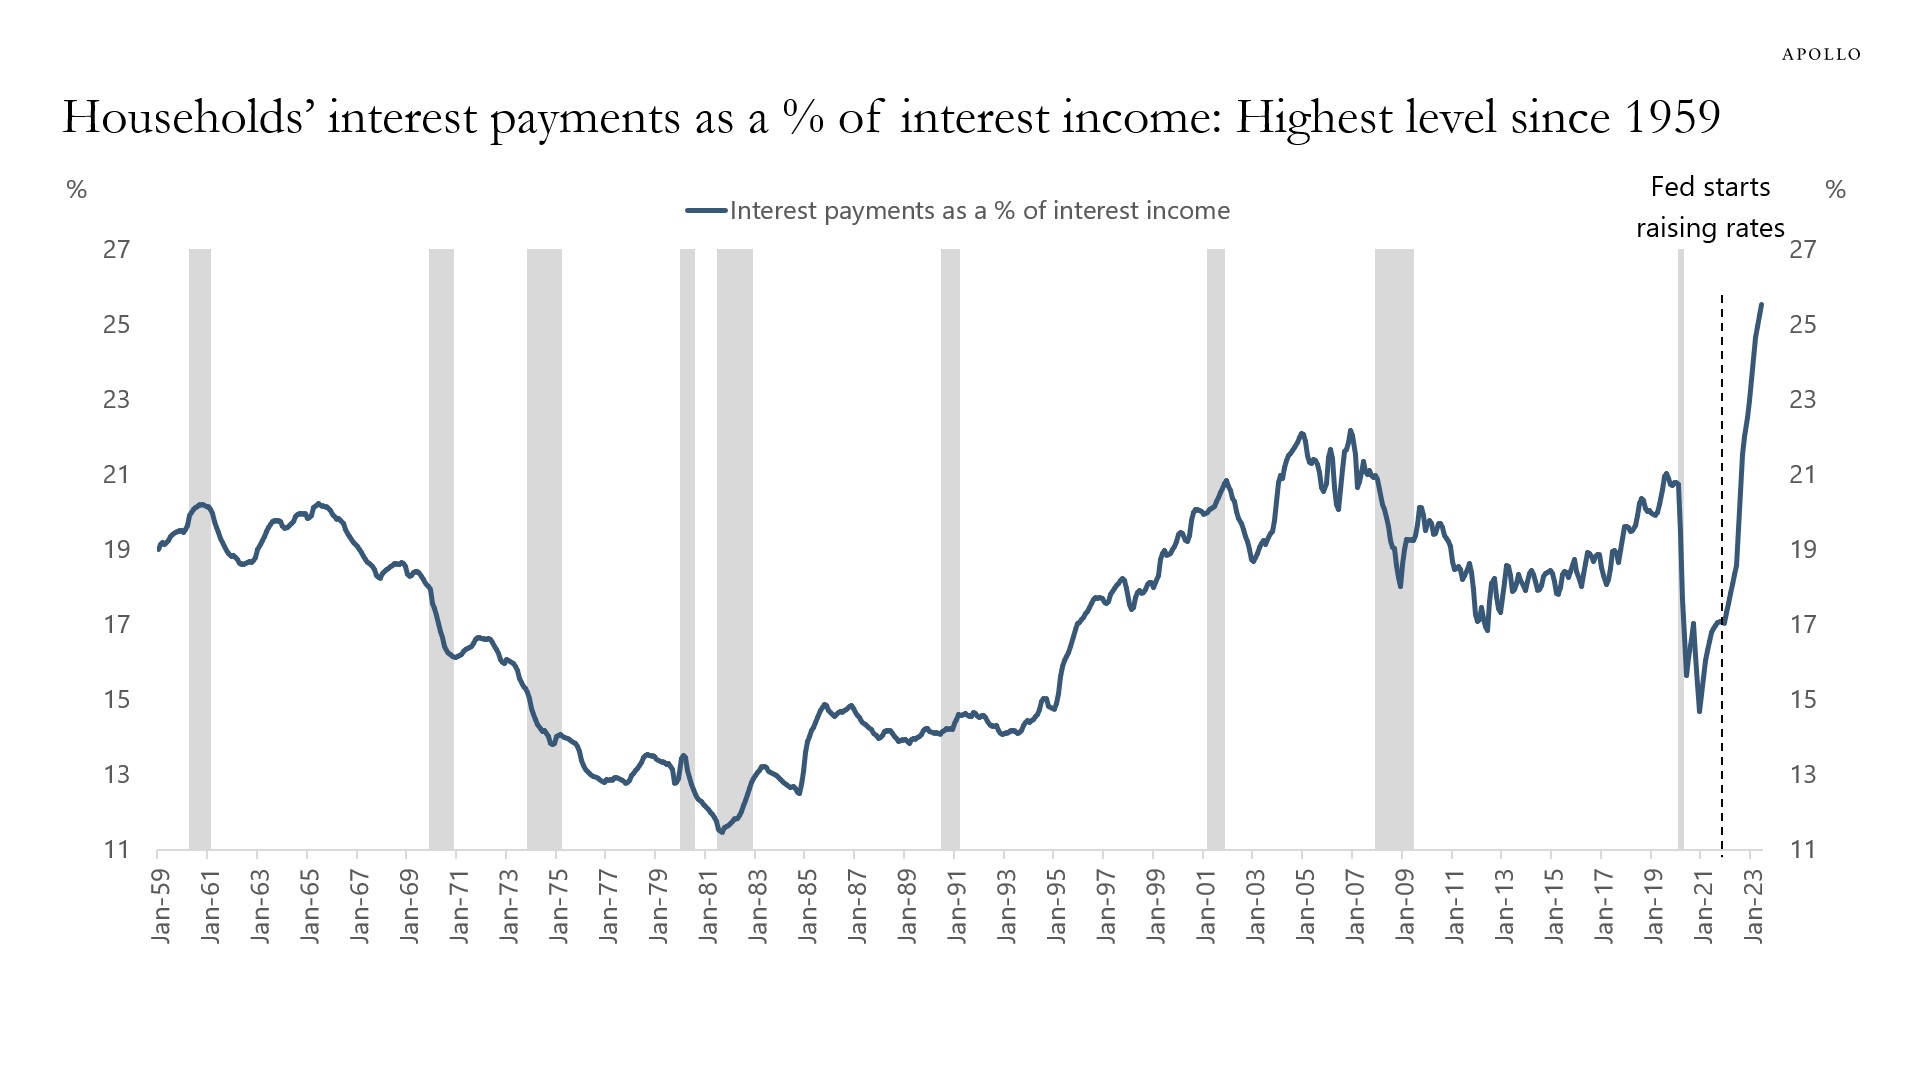
Source: BEA, Bloomberg, Apollo Chief Economist See important disclaimers at the bottom of the page.
-
One way to better understand the impact of BoJ YCC exit on Japanese demand for US Treasuries is to look at how much of the recent increase in US long-term interest rates has happened during Tokyo trading hours.
The chart below shows that since the BoJ YCC exit surprise in late July, the move higher in 10s has occurred almost entirely during New York trading hours.
This suggests that US rates are not driven higher by Japanese investors during Tokyo trading hours. And hence, BoJ YCC exit doesn’t seem to be the reason long rates have increased over the past month.
Instead, likely drivers of US rates over the past month are the US sovereign downgrade, fewer dollars for China to recycle in a falling exports environment, Fed QT, the significant budget deficit, the large stock of T-bills, and the Treasury’s intention to increase coupon auction sizes.
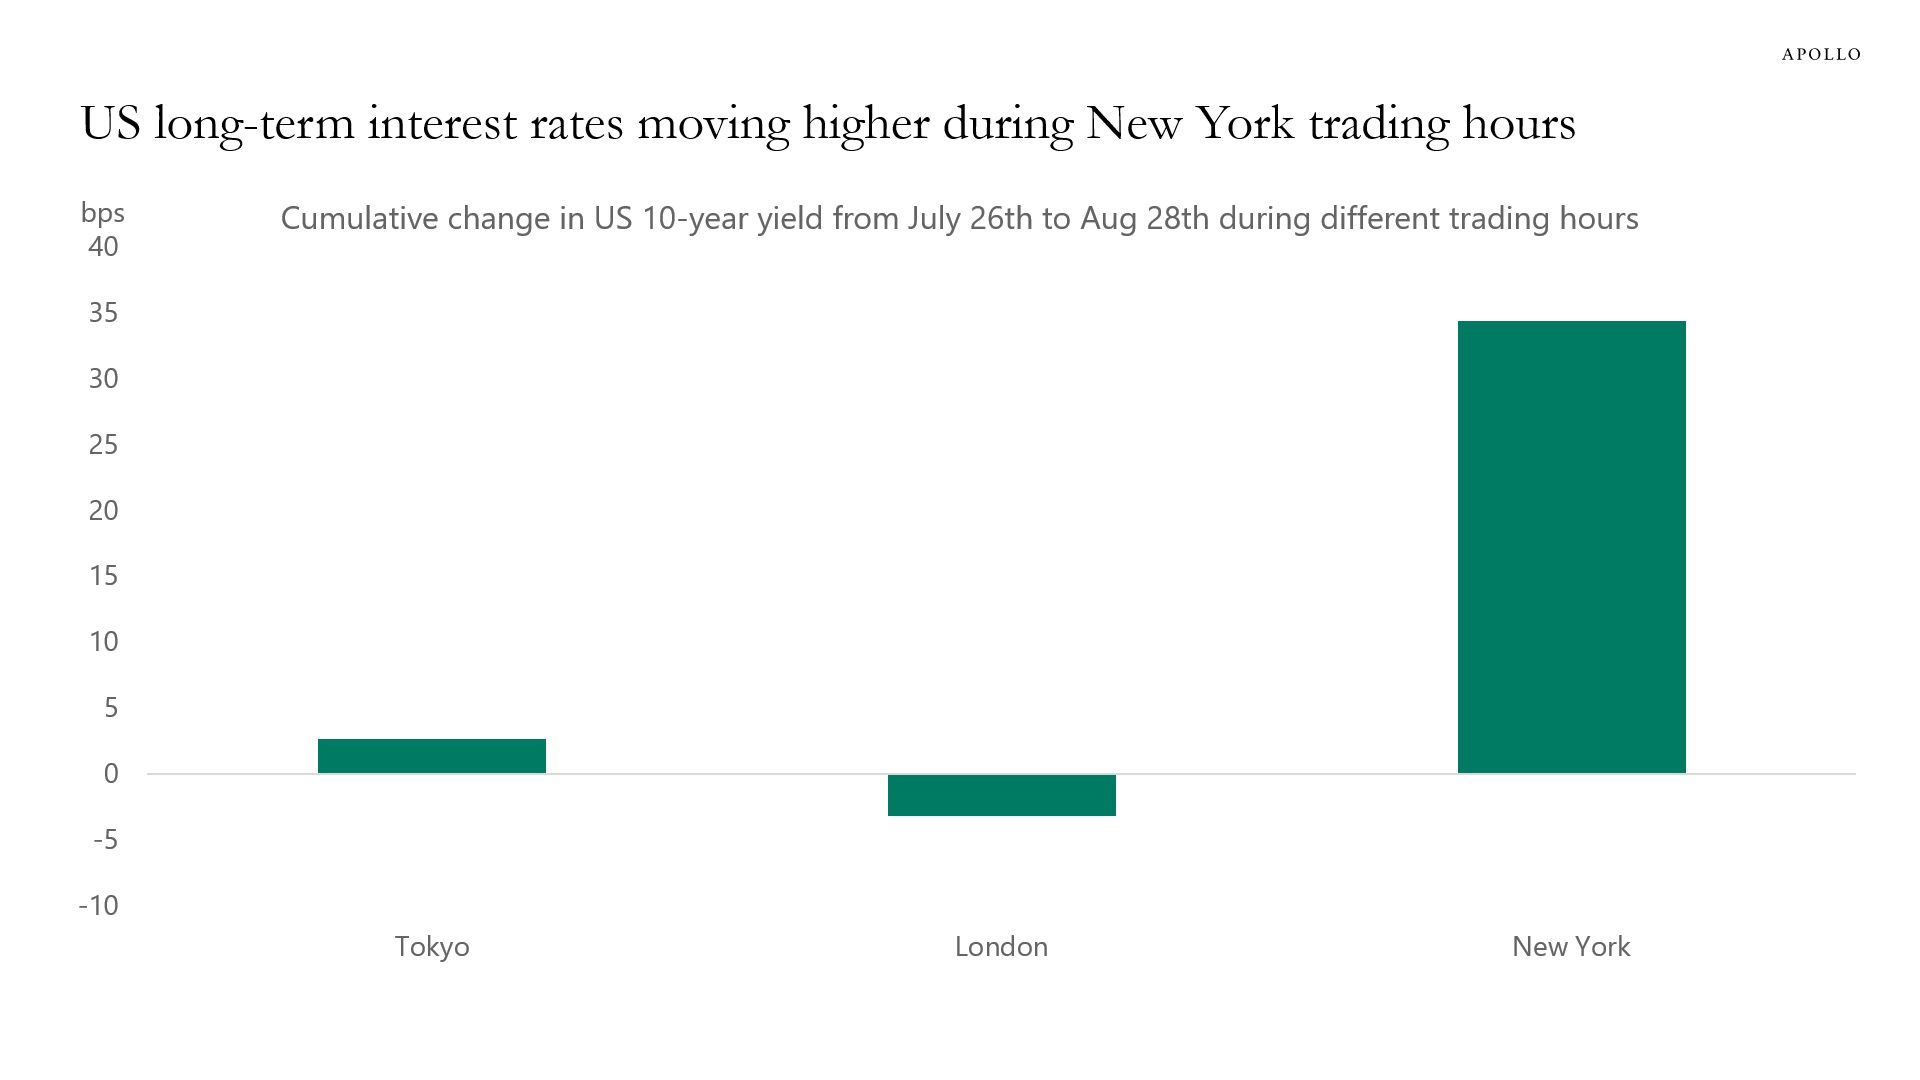
Source: Bloomberg, Apollo Chief Economist. Note: Tokyo trading session defined as 9 am to 4:30 pm JST, followed by London defined as 8:30 am to 1 pm GMT, and New York defined as 8 am to 4:30 pm EST, covering 20.5 hours in total of 10-year Treasury trading. See important disclaimers at the bottom of the page.
This presentation may not be distributed, transmitted or otherwise communicated to others in whole or in part without the express consent of Apollo Global Management, Inc. (together with its subsidiaries, “Apollo”).
Apollo makes no representation or warranty, expressed or implied, with respect to the accuracy, reasonableness, or completeness of any of the statements made during this presentation, including, but not limited to, statements obtained from third parties. Opinions, estimates and projections constitute the current judgment of the speaker as of the date indicated. They do not necessarily reflect the views and opinions of Apollo and are subject to change at any time without notice. Apollo does not have any responsibility to update this presentation to account for such changes. There can be no assurance that any trends discussed during this presentation will continue.
Statements made throughout this presentation are not intended to provide, and should not be relied upon for, accounting, legal or tax advice and do not constitute an investment recommendation or investment advice. Investors should make an independent investigation of the information discussed during this presentation, including consulting their tax, legal, accounting or other advisors about such information. Apollo does not act for you and is not responsible for providing you with the protections afforded to its clients. This presentation does not constitute an offer to sell, or the solicitation of an offer to buy, any security, product or service, including interest in any investment product or fund or account managed or advised by Apollo.
Certain statements made throughout this presentation may be “forward-looking” in nature. Due to various risks and uncertainties, actual events or results may differ materially from those reflected or contemplated in such forward-looking information. As such, undue reliance should not be placed on such statements. Forward-looking statements may be identified by the use of terminology including, but not limited to, “may”, “will”, “should”, “expect”, “anticipate”, “target”, “project”, “estimate”, “intend”, “continue” or “believe” or the negatives thereof or other variations thereon or comparable terminology.


