


Want it delivered daily to your inbox?
-
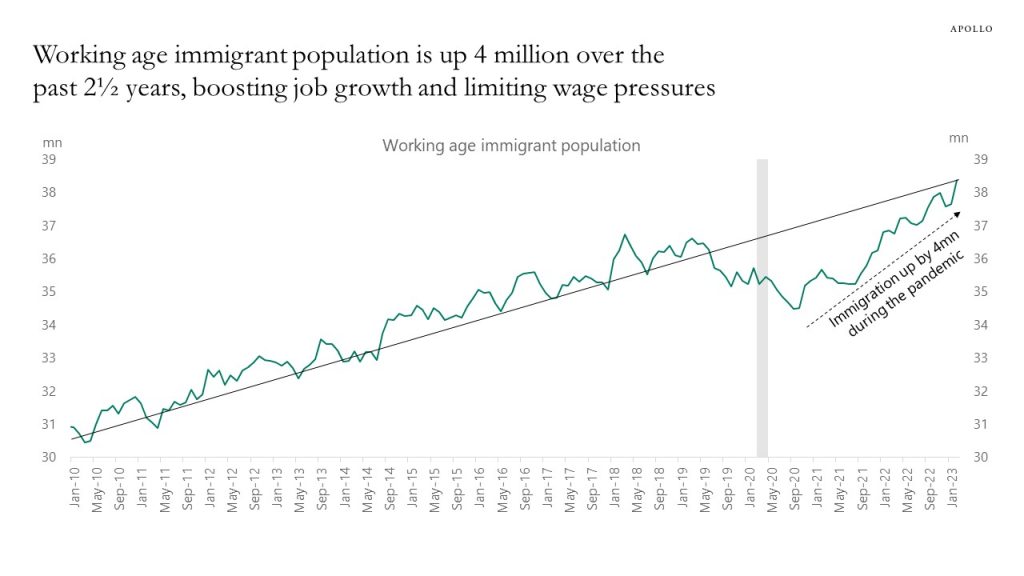
Immigration is likely the main reason the labor market is gradually moving from very overheated to less overheated.
Over the past 2½ years, immigration into the US labor market has increased by 4 million workers, and the working age immigrant population is now back at its pre-pandemic trend, see chart below. This number can be compared with the 4 million people in the US who are out of work because of long covid, see also this Brookings paper.
High immigration contributes not only to strong job growth, including in leisure and hospitality, but also to limiting the upside pressure on wages, see the second chart.
The bottom line is that high immigration is helpful for the Fed as it tries to cool down the labor market and slow down inflation.
Our employment outlook chart book is available here.
Source: BLS, Haver Analytics, Apollo Chief Economist 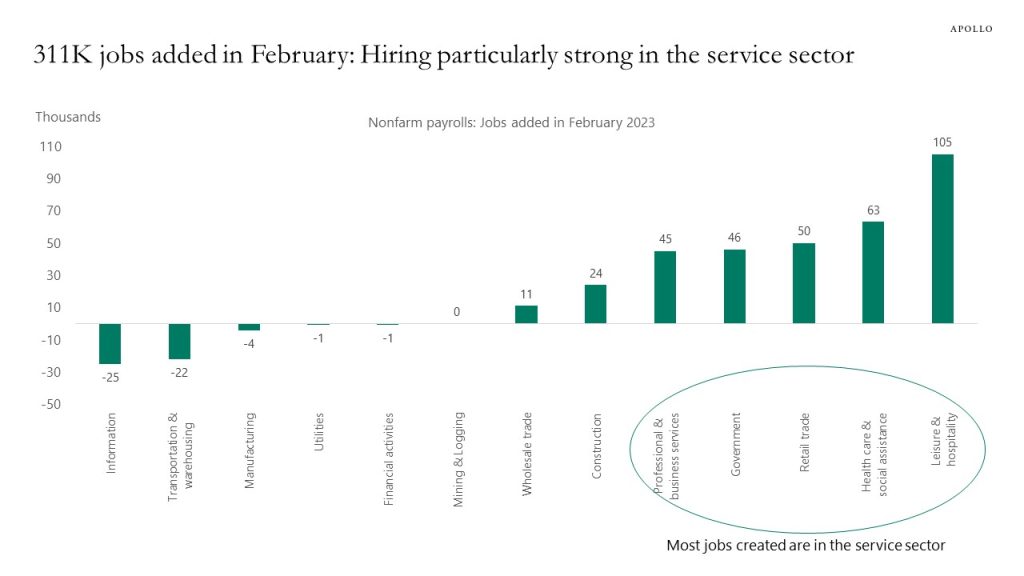
Source: BLS, Haver, Apollo Chief Economist See important disclaimers at the bottom of the page.
-
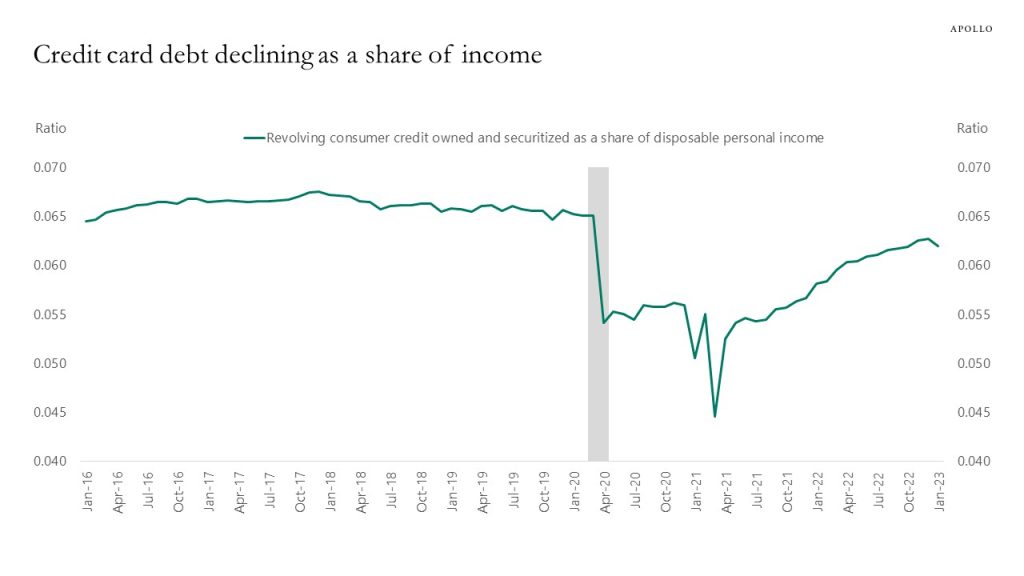
Credit card debt outstanding has been increasing because of high inflation and the economy reopening, but the increase in household incomes has been faster. The net result is that credit card debt is declining as a share of income, see chart below. Combined with strong job growth, solid wage growth, and high excess savings, the bottom line is that the US consumer is in good shape, and there are no signs this is about to change anytime soon.
Source: FRED, Apollo Chief Economist See important disclaimers at the bottom of the page.
-
Our latest credit market outlook is available here, highlights include (see charts below):
– Fewer and fewer high yield bonds are being traded, currently at the lowest levels in decades relative to IG
– IG spreads remain tight despite rising Fed uncertainty
– 92% of IG bonds outstanding trade below par
– 15% of high yield bonds trade with a yield higher than 10%
– Retail investors have in recent weeks been selling IG and HY, and put volumes on IG and HY ETFs remain very elevated
– Corporate leverage has been declining since the pandemic
– IG and HY index durations are coming down; i.e. credit is becoming less sensitive to rising rates
– Measures of bond market liquidity show liquidity is much worse in UK bond markets than in the US, EU, and Germany
– Default rates on credit cards and auto loans are normalizing to pre-pandemic levels
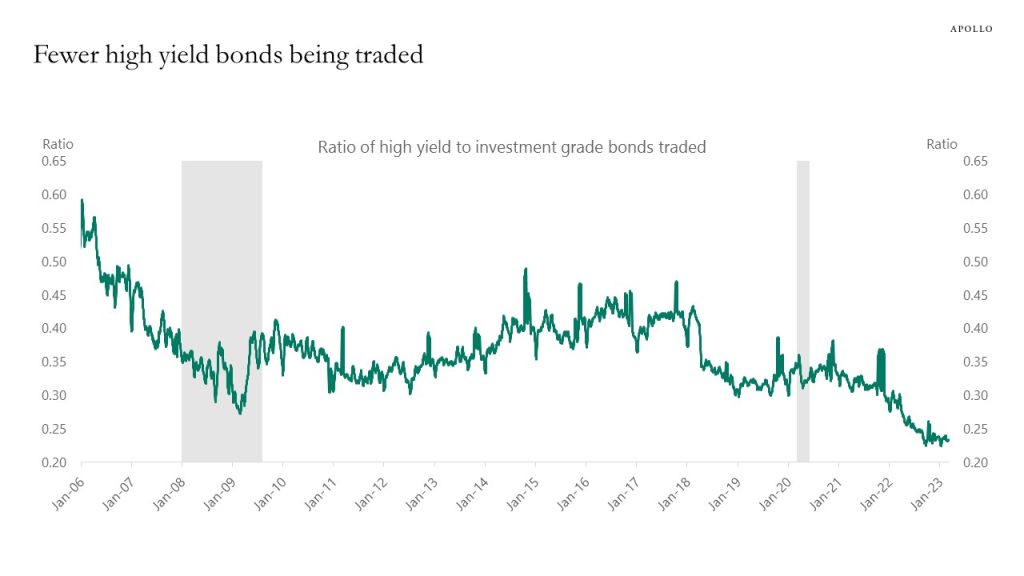
Source: FINRA Trace, Bloomberg, Apollo Chief Economist 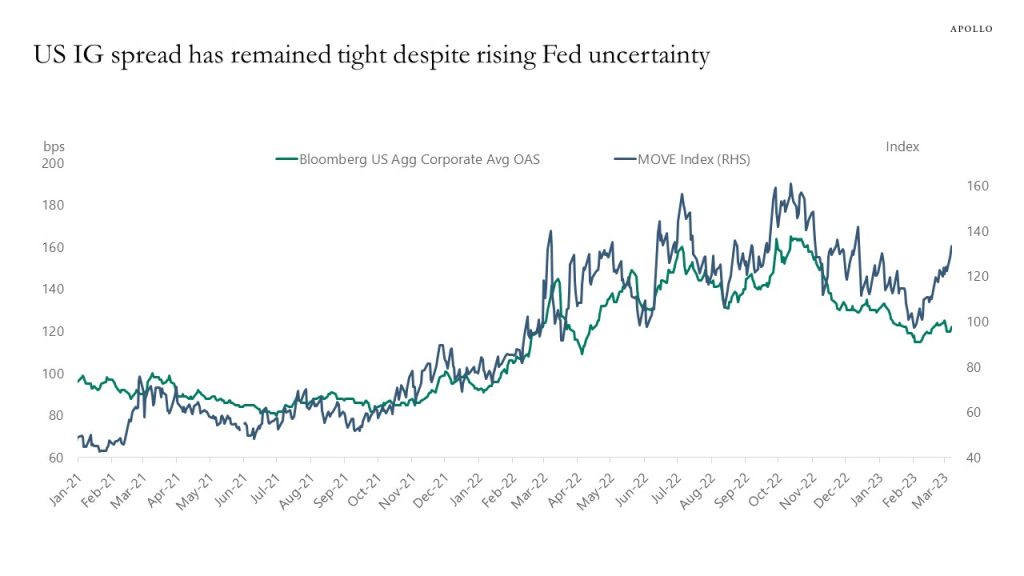
Source: Bloomberg, Apollo Chief Economist 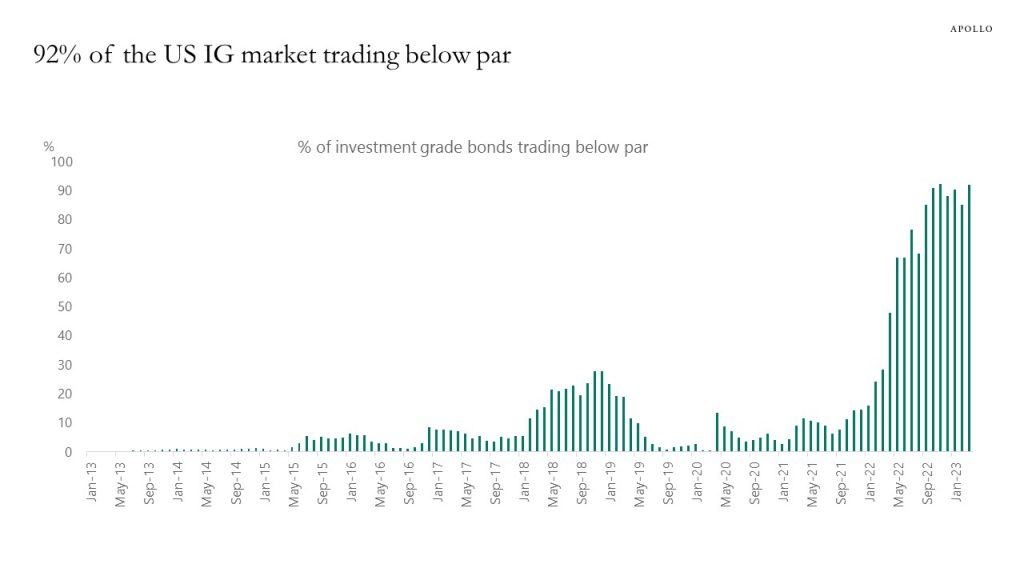
Source: Bloomberg, Apollo Chief Economist. Note: Data used for members in the LBUSTRUU Index as of 1st March 2023 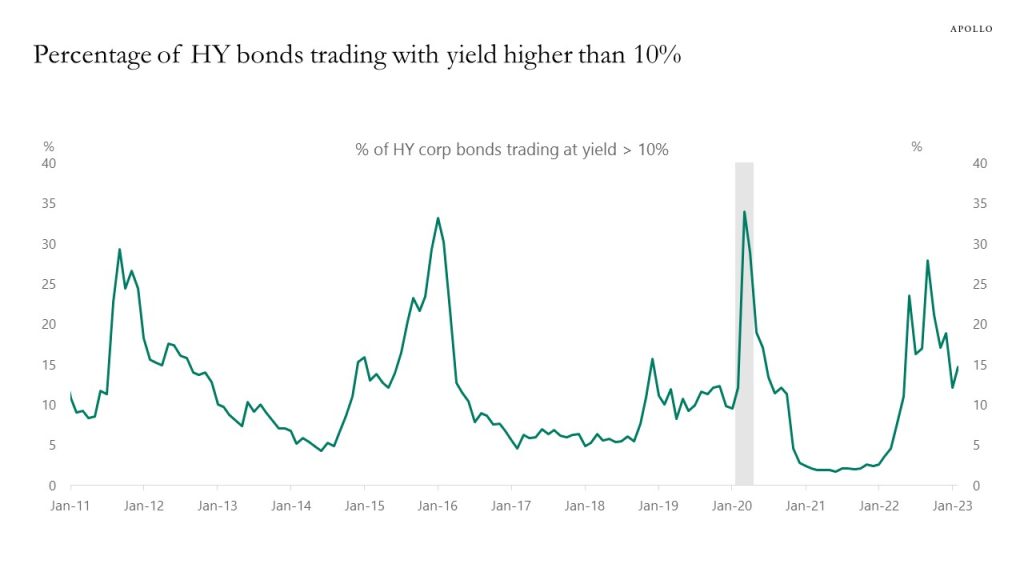
Source: Bloomberg, Apollo Chief Economist. Note: HY bond universe is H0A0 Index 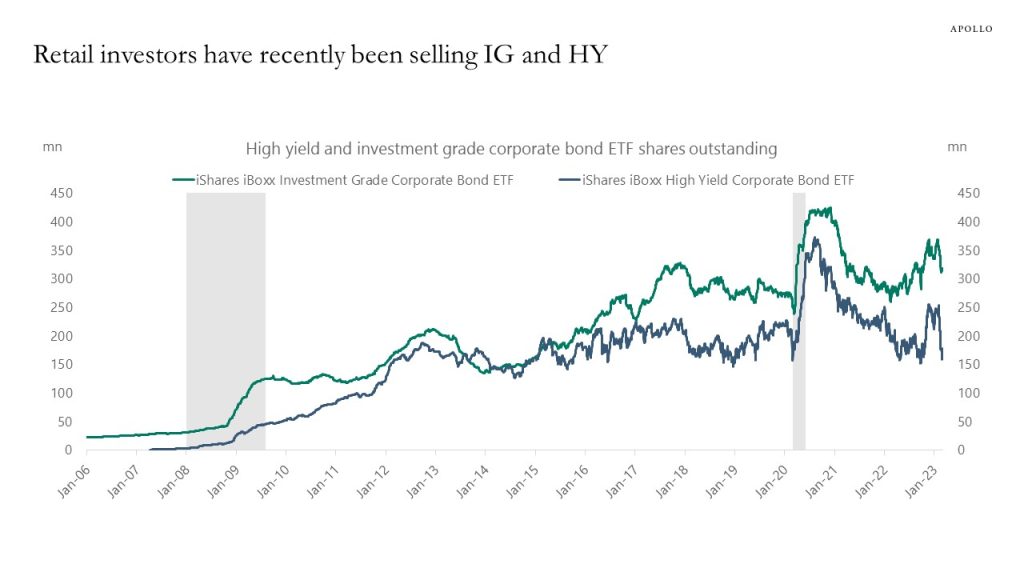
Source: Bloomberg, Apollo Chief Economist. Note: Tickers used HYG US Equity and LQD US Equity 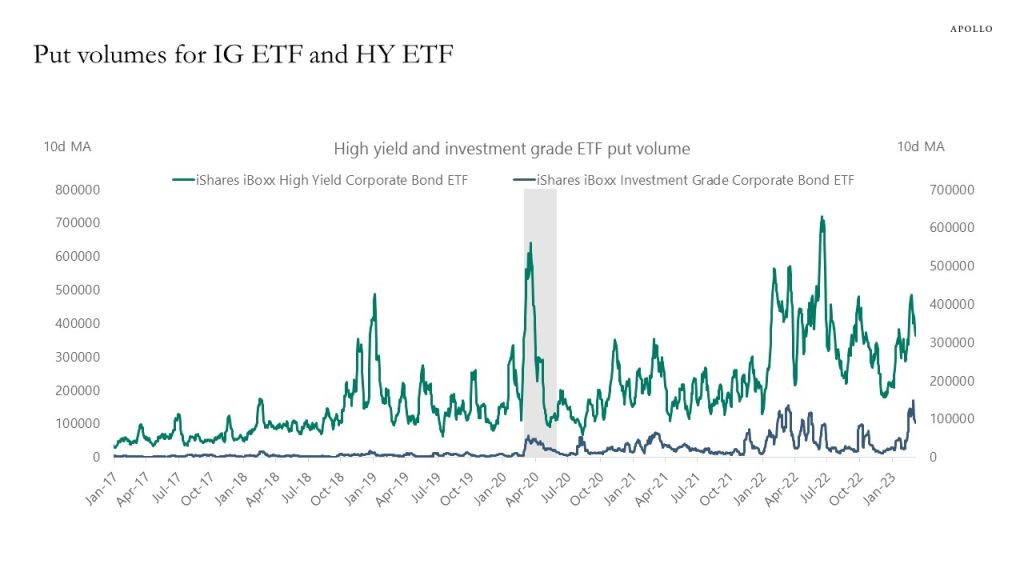
Source: Bloomberg, Apollo Chief Economist 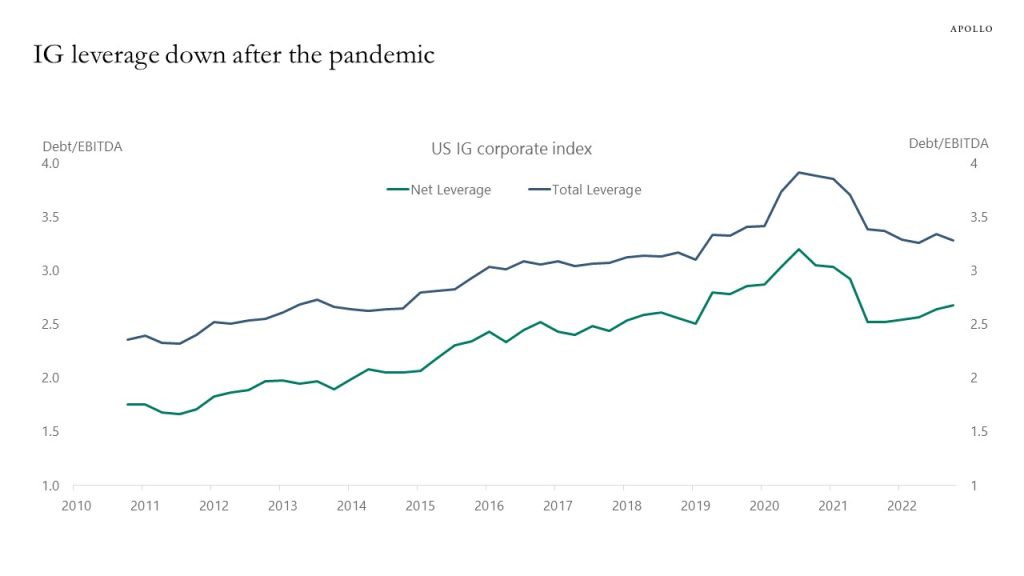
Source: ICE BofA, Bloomberg, Apollo Chief Economist. Note: Index used C0A0 Index 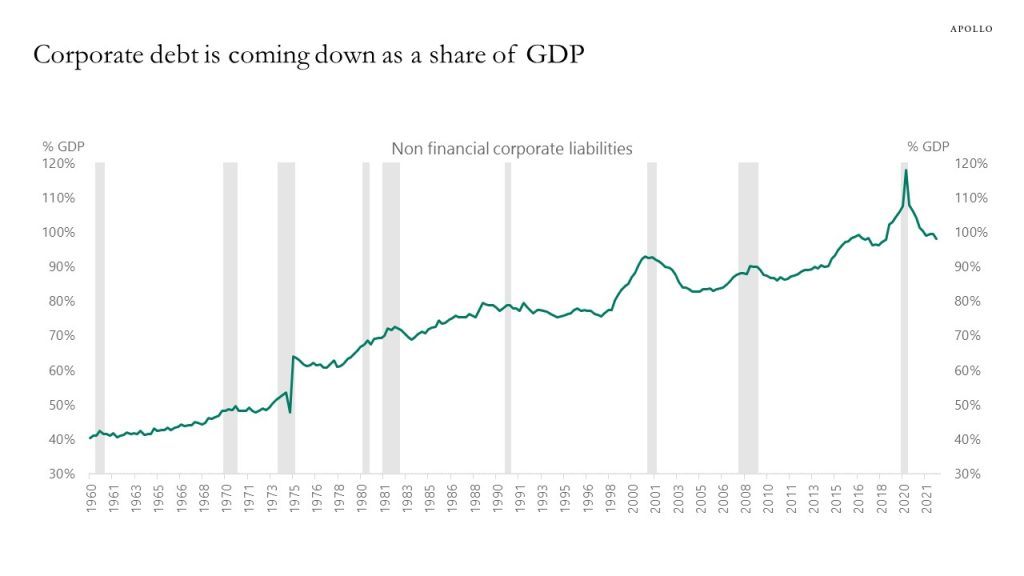
Source: FRB, Haver Analytics, Apollo Chief Economist 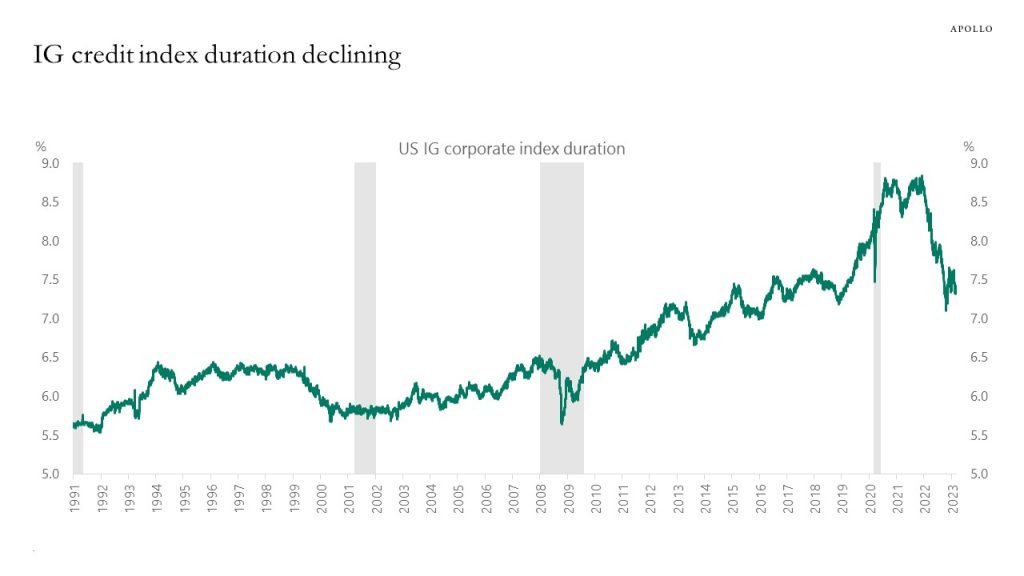
Source: Bloomberg, Apollo Chief Economist. Note: The measure used is modified duration, which measures the expected change in a bond’s price to a 1% change in interest rates 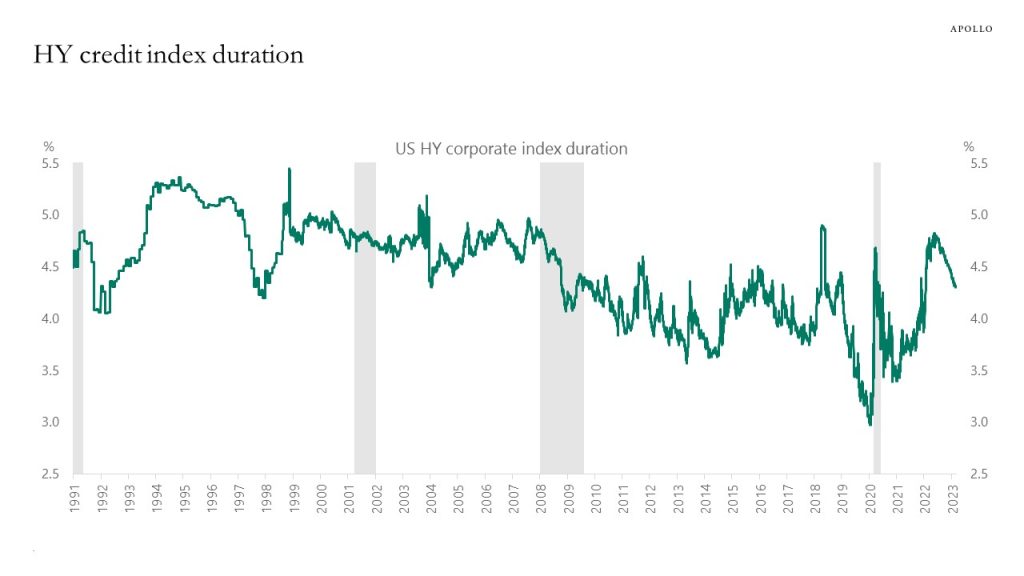
Source: Bloomberg, Apollo Chief Economist. Note: The measure used is modified duration, which measures the expected change in a bond’s price to a 1% change in interest rates 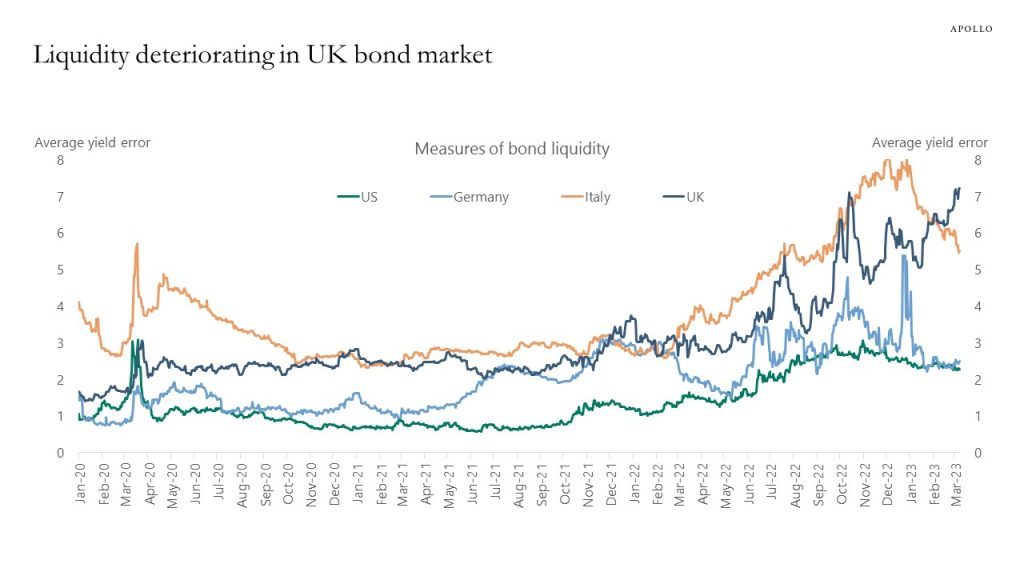
Source: Bloomberg, Apollo Chief Economist. Note: The index displays the average yield error across the universe of government notes and bonds with remaining maturity 1-year or greater, based off the intra-day Bloomberg relative value curve fitter. When liquidity conditions are favorable the average yield errors are small as any dislocations from fair values are normalized within a short time frame. Average yield error is defined as an aggregate measure for dislocations in Treasury securities across the curve. 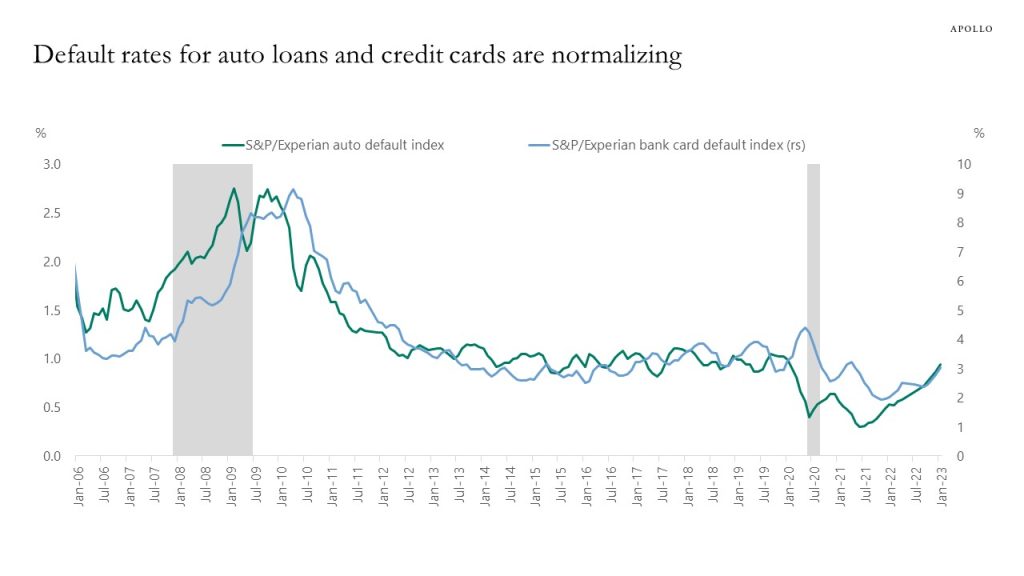
Source: S&P, Bloomberg, Apollo Chief Economist See important disclaimers at the bottom of the page.
-
The consensus expects nonfarm payrolls on Friday to come in at 225,000, but recent readings for the employment components of ISM suggest there are some upside risks to that forecast, see chart below.
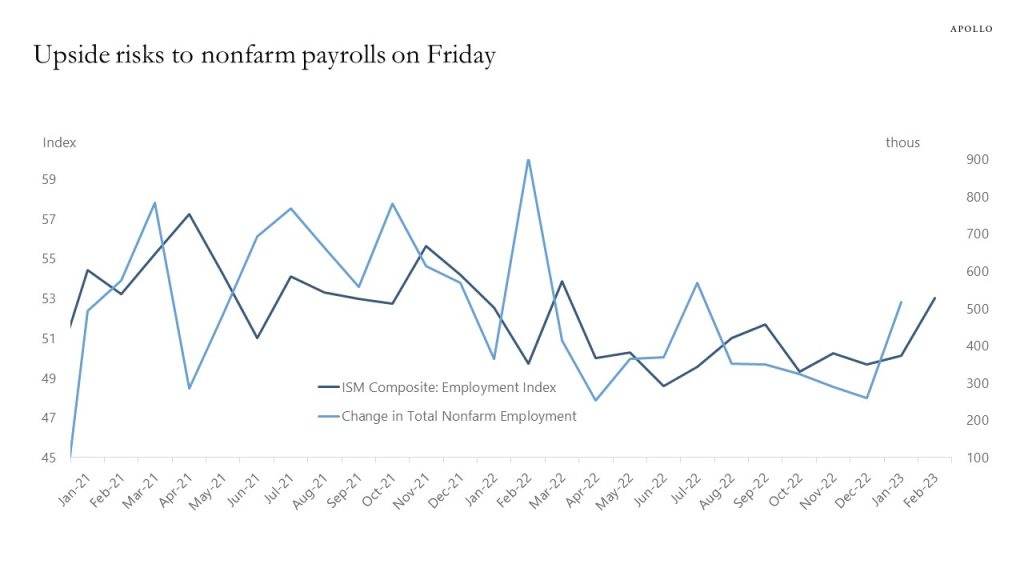
Source: ISM, BLS, Haver Analytics, Apollo Chief Economist See important disclaimers at the bottom of the page.
-
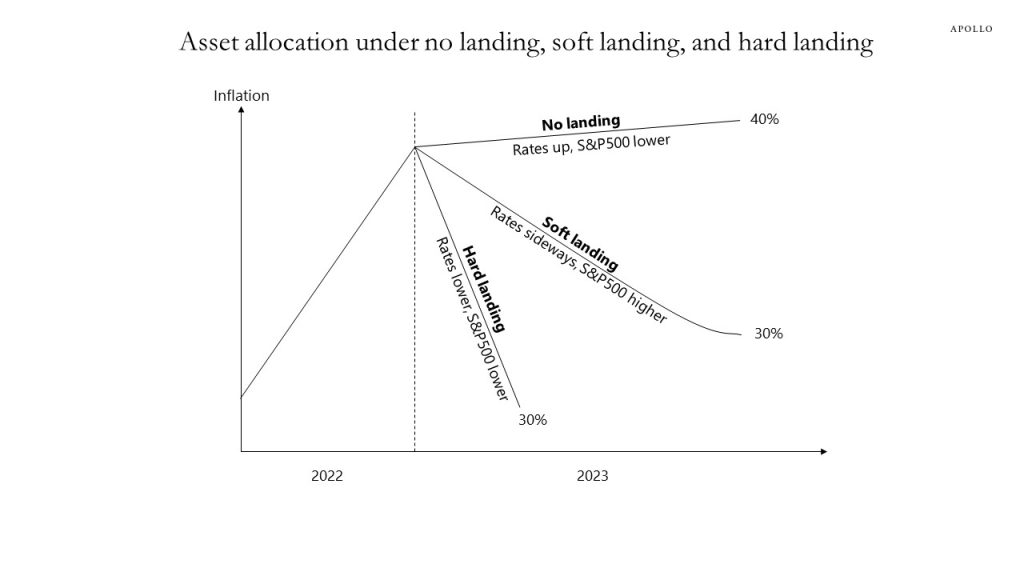
The asset allocation implications of no landing, soft landing, and hard landing are very different, see chart below.
Under the no landing scenario, the economy will remain strong and the Fed will hike rates faster. A higher discount rate and the Fed stepping harder on the brakes to tighten financial conditions will be negative for equities.
Under the soft landing scenario, inflation comes down to 2% by the end of 2023, rates move sideways because there is no need for the Fed to raise rates when inflation is coming back to 2%, and equities will move higher.
Under the hard landing scenario, the economy enters a recession, which means a significant decline in earnings and growth, which pushes rates lower and equities lower.
The bottom line is that the investment implications for equity and bond markets are very different depending on which scenario we are in, and at the moment, it is clear that we are firmly in the no landing scenario.
Once the Fed has raised interest rates enough to get inflation under control we will find out if we are transitioning to a soft or hard landing. It could be that we have to wait until 2024 before we find out what comes after no landing.
Investors today can decide to say: “But we will get a hard landing,” or “We will get a soft landing”. But if that view turns out to be wrong, it will be costly for performance.
In short, with the economy still strong and inflation still high, it is too early for asset allocation to be positioned for a soft landing or a hard landing. For now, investors should be positioned for no landing.
Source: Apollo Chief Economist See important disclaimers at the bottom of the page.
-
Loan loss provisioning is rising from a very low level in the banking sector, but we are still not close to the levels seen in 2008 and during the pandemic, see chart below. For more discussion, see also this BIS paper.
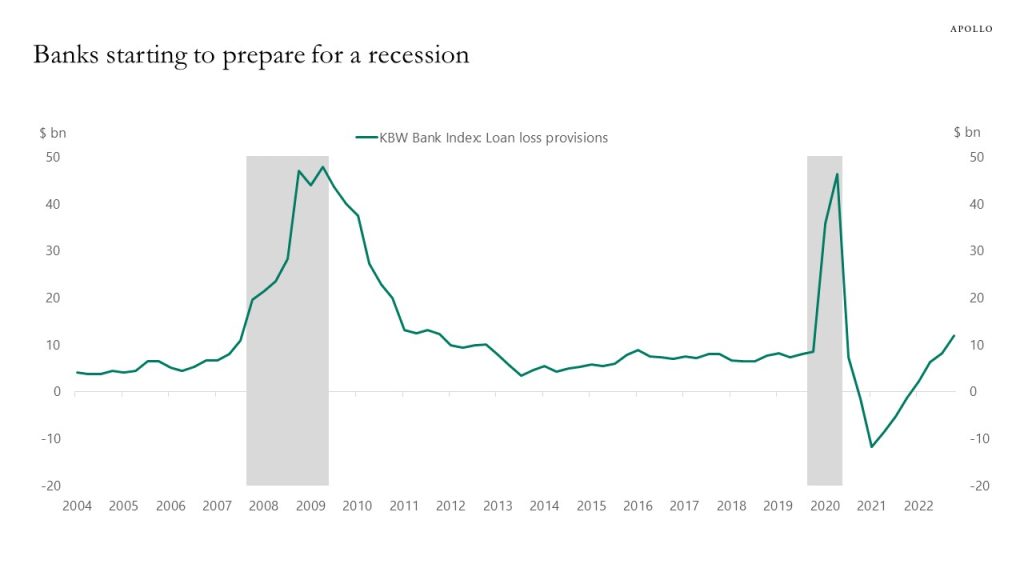
Source: Bloomberg, Apollo Chief Economist (Note: KBW Bank Index includes 24 banks and regional institutions: JPM, PNC, WAL, BAC, C, TFC, BK, SBNY, CMA, CFG, RF, MTB, SIVB, FITB, HBAN, NTRS, KEY, STT, USB, FRC, ZION, EWBC, COF, WFC) See important disclaimers at the bottom of the page.
-
Bankruptcies are rising in Europe across all sectors in the economy, see chart below.
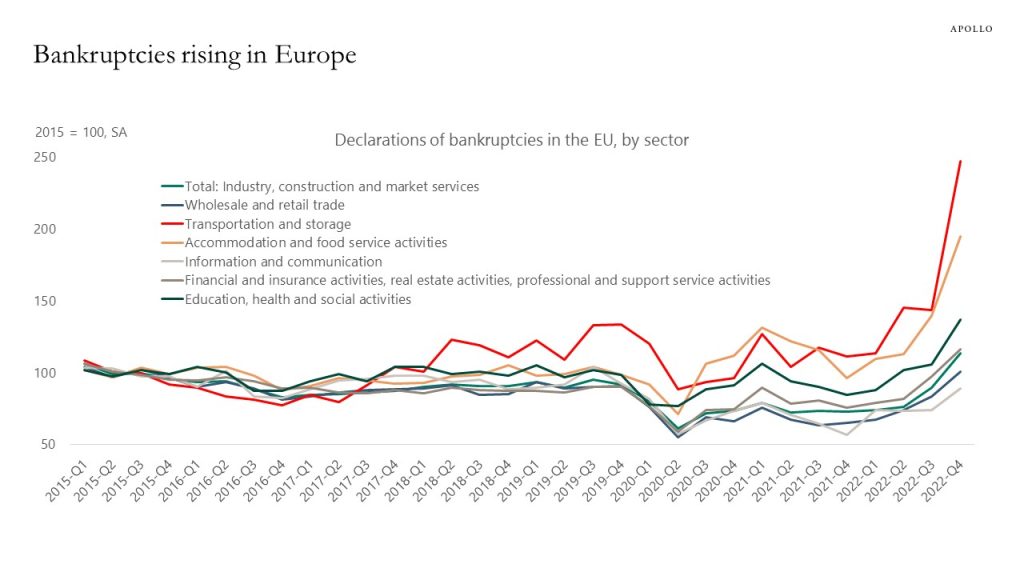
Source: Eurostat, Apollo Chief Economist See important disclaimers at the bottom of the page.
-
With hedging costs rising, Japanese investors have been selling foreign bonds, see chart below. With US rates staying higher for longer, this is likely to continue.

Source: Bloomberg, Apollo Chief Economist See important disclaimers at the bottom of the page.
-
The price of transporting a container from China to the US is basically back at pre-pandemic levels, and this is boosting manufacturing production and putting downward pressure on goods inflation, see chart below.
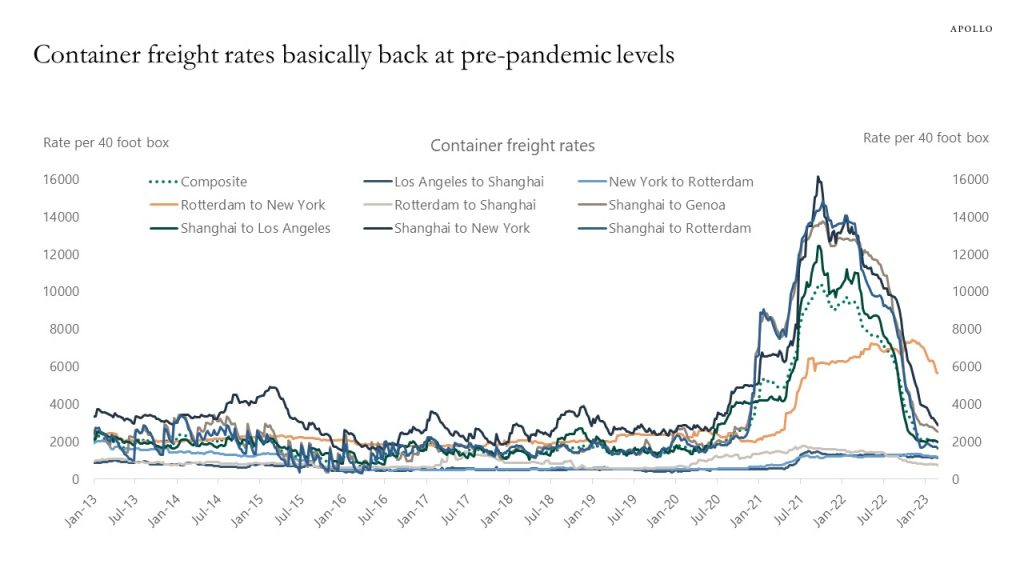
Source: WCI, Bloomberg, Apollo Chief Economist See important disclaimers at the bottom of the page.
-
Weekly data shows that hotel occupancy rates are rising, daily rates are increasing, and RevPar is moving higher, see chart below. No signs of a consumer slowdown here.
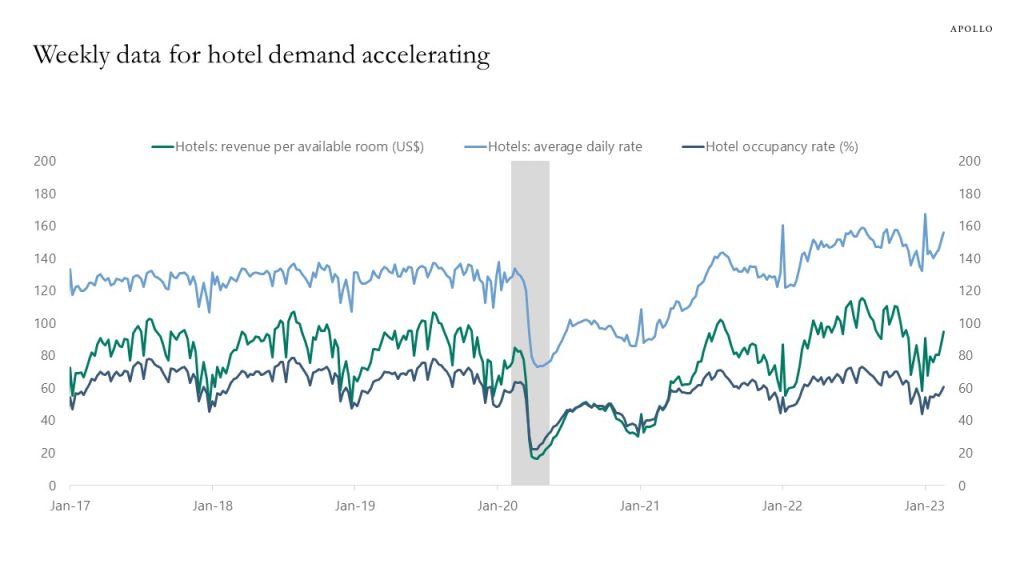
Source: STR, Haver Analytics, Apollo Chief Economist See important disclaimers at the bottom of the page.

This presentation may not be distributed, transmitted or otherwise communicated to others in whole or in part without the express consent of Apollo Global Management, Inc. (together with its subsidiaries, “Apollo”).
Apollo makes no representation or warranty, expressed or implied, with respect to the accuracy, reasonableness, or completeness of any of the statements made during this presentation, including, but not limited to, statements obtained from third parties. Opinions, estimates and projections constitute the current judgment of the speaker as of the date indicated. They do not necessarily reflect the views and opinions of Apollo and are subject to change at any time without notice. Apollo does not have any responsibility to update this presentation to account for such changes. There can be no assurance that any trends discussed during this presentation will continue.
Statements made throughout this presentation are not intended to provide, and should not be relied upon for, accounting, legal or tax advice and do not constitute an investment recommendation or investment advice. Investors should make an independent investigation of the information discussed during this presentation, including consulting their tax, legal, accounting or other advisors about such information. Apollo does not act for you and is not responsible for providing you with the protections afforded to its clients. This presentation does not constitute an offer to sell, or the solicitation of an offer to buy, any security, product or service, including interest in any investment product or fund or account managed or advised by Apollo.
Certain statements made throughout this presentation may be “forward-looking” in nature. Due to various risks and uncertainties, actual events or results may differ materially from those reflected or contemplated in such forward-looking information. As such, undue reliance should not be placed on such statements. Forward-looking statements may be identified by the use of terminology including, but not limited to, “may”, “will”, “should”, “expect”, “anticipate”, “target”, “project”, “estimate”, “intend”, “continue” or “believe” or the negatives thereof or other variations thereon or comparable terminology.