


Want it delivered daily to your inbox?
-
There is a market narrative that European governments are spending more on defense spending and the ECB is doing QT, and this will push yields higher on European government bonds.
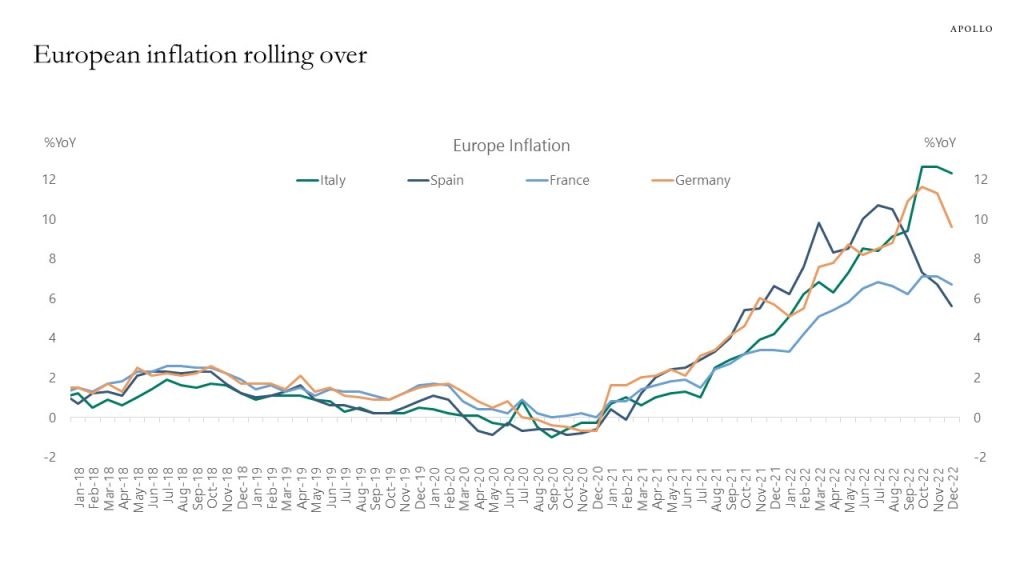
The problem with this story is that US long rates are going down because the Fed will soon pause, and European inflation is going down, see chart below. Combined with European inflation being mainly energy, where the 12-month change will roll over in March 2023, the net effect is that US rates going down and inflation in the US and Europe going down will likely dominate the idiosyncratic stories in Europe.
As a result, global government bond yields will likely decline, including in Europe. The fundamental reason is that inflation will be less and less of a problem as we go through 2023, and the move lower in global rates will be particularly significant if we get a recession in the US.
Source: Bloomberg, Eurostat, Apollo Chief Economist See important disclaimers at the bottom of the page.
-
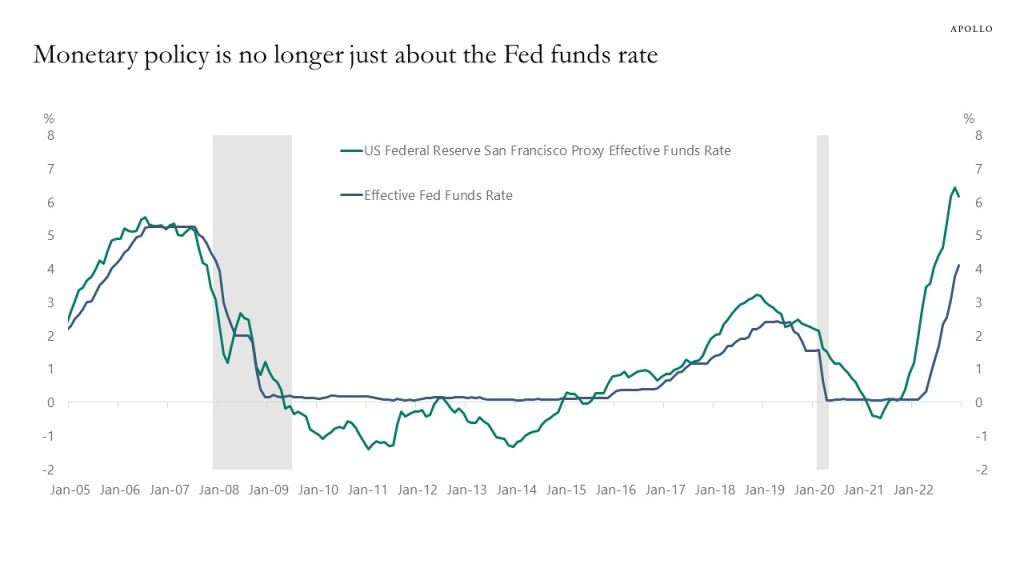
The Fed has calculated what forward guidance and their balance sheet policy mean for the Fed funds rate, and their estimates show that the proxy Fed funds rate, which also includes forward guidance and the Fed balance sheet, is significantly higher. Specifically, these Fed estimates show that monetary policy is much tighter with the proxy Fed funds rate at 6% rather than the official 4%. The bottom line for markets is that the true stance of monetary policy is tighter at 6% than the Fed funds rate at 4%, see chart below and here. In other words, comparisons with history and discussions of how restrictive monetary policy should not only look at the level of the Fed funds rate but also include the new tools that the FOMC is using today to cool the economy down.
Source: Bloomberg, Apollo Chief Economist. Note: Source: Monthly series of the proxy funds rate, from Doh and Choi (2016) and Choi, Doh, Foerster, and Martinez (2022). This measure uses public and private borrowing rates and spreads to infer the broader stance of monetary policy. When the Federal Open Market Committee uses additional tools, such as forward guidance or changes in the balance sheet, these policy actions affect financial conditions, which the proxy rate translates into an analogous level of the federal funds rate. The proxy rate can be interpreted as indicating what the federal funds rate would typically be associated with prevailing financial market conditions if these conditions were driven solely by the funds rate. See important disclaimers at the bottom of the page.
-
Wage inflation is rolling over across the income distribution, see chart below. A slowdown in wage inflation is exactly what the Fed is trying to achieve with tighter monetary policy. And note how it is happening without an increase in the unemployment rate. Lower inflation with a steady economy and steady earnings is the definition of a soft landing.
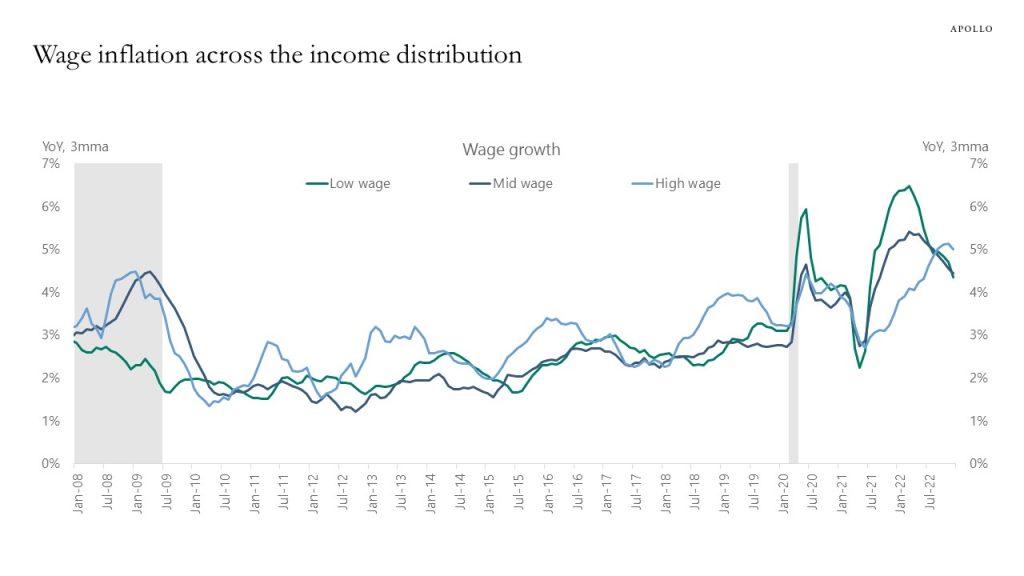
Source: BLS, Apollo Chief Economist. Note: Low wage workers are defined as the bottom third percentile in the wage distribution, mid wage workers as the mid third percentile and high wage workers as top third percentile See important disclaimers at the bottom of the page.
-
Fed: How sensitive is the economy to large interest rate increases? Evidence from the taper tantrum
https://www.federalreserve.gov/econres/feds/files/2022085pap.pdf
The Myth of Central Bank Independence
http://d.repec.org/n?u=RePEc:ajw:wpaper:06813&r=mon
The Effect of Pension Wealth on Employment
See important disclaimers at the bottom of the page.
-
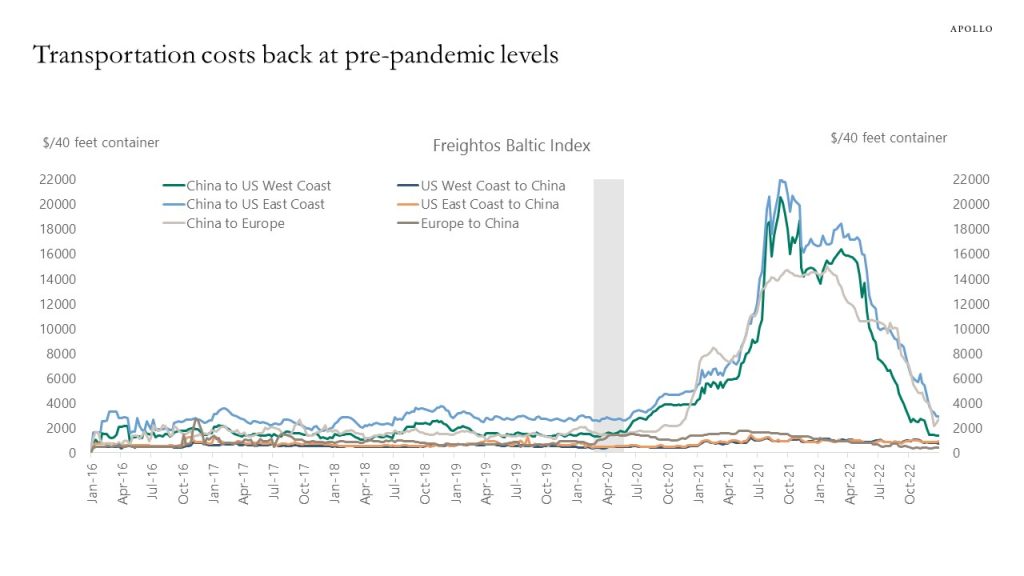
Supply chains are back to normal, and the price of transporting a 40-feet container from China to the US West Coast has declined from $20,000 in September 2021 to $1,382 today, see chart below. This normalization in transportation costs is a significant drag on goods inflation over the coming months. Services inflation will be driven lower by declining rent inflation. Wage inflation remains elevated, but we have just had an extended period where consumer price inflation was higher than wage inflation. So companies and profit margins will also be able to deal with a period where wage inflation is higher than consumer price inflation. The bottom line is that the Fed and the consensus are right to expect a decline in inflation as we go through 2023. And new Fed research here shows that inflation persistence is less of a worry.
Source: Freightos, Bloomberg, Apollo Chief Economist See important disclaimers at the bottom of the page.
-
Calculations from the Fed show that the contribution from demand to inflation has been shrinking in recent months, see chart below and here. The implication is that monetary policy is sufficiently tight and the Fed is quickly approaching the peak in the Fed funds rate. In other words, these Fed estimates show that the cumulative Fed hikes seen so far are enough to have successfully cooled down demand inflation, and the tentative conclusion is that no additional demand destruction is needed.
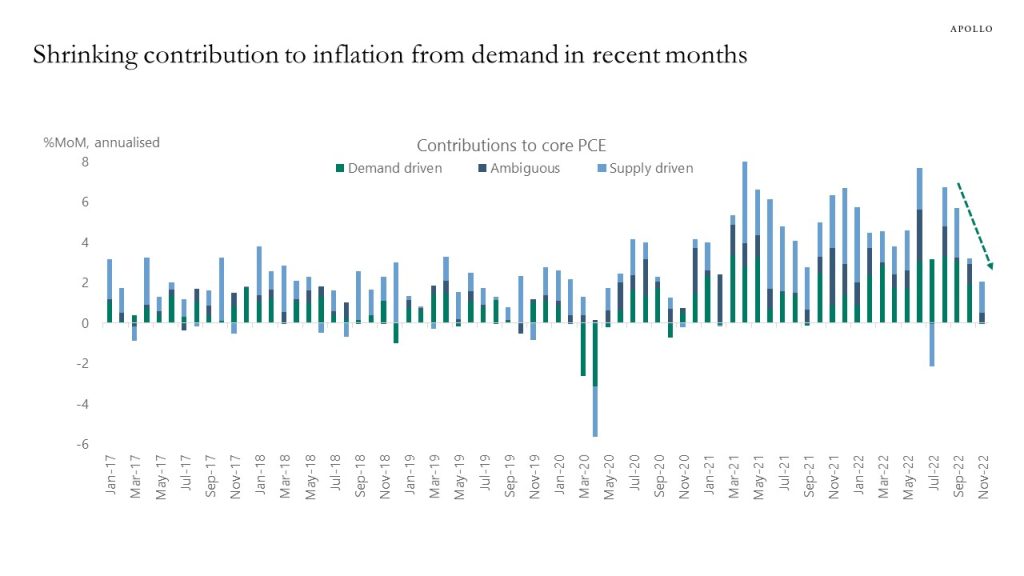
Source: Federal Reserve Bank of San Francisco, Apollo Chief Economist See important disclaimers at the bottom of the page.
-
Labor force participation rates are back at pre-pandemic levels for prime age workers but still below normal for people aged +55 and below 24 years old, see chart below.
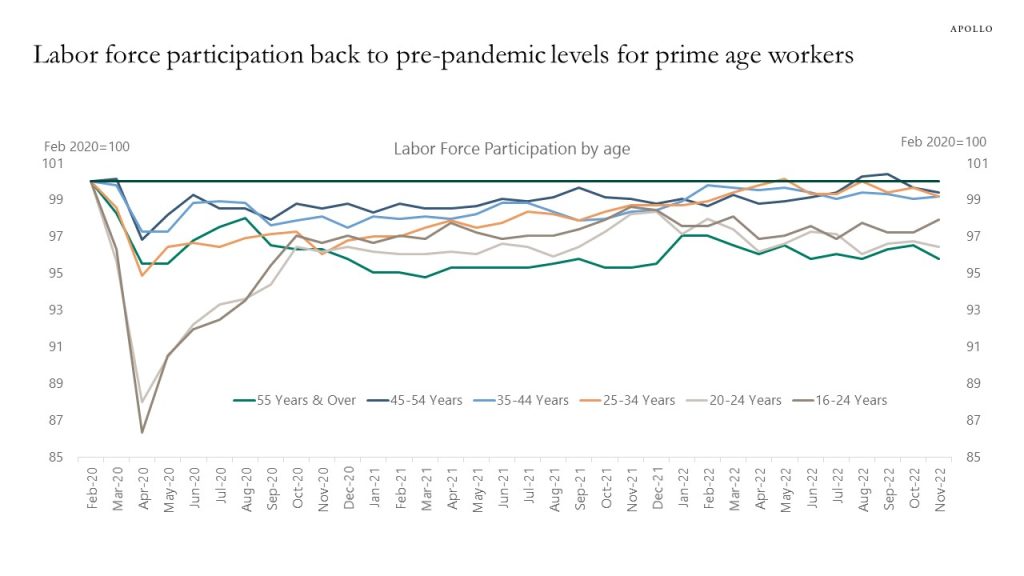
Source: BLS, Haver Analytics, Apollo Chief Economist See important disclaimers at the bottom of the page.
-
Occupancy rates at Las Vegas hotels are now back to pre-pandemic levels, driven by strong employment growth, solid wage growth, and high household savings, see chart below.
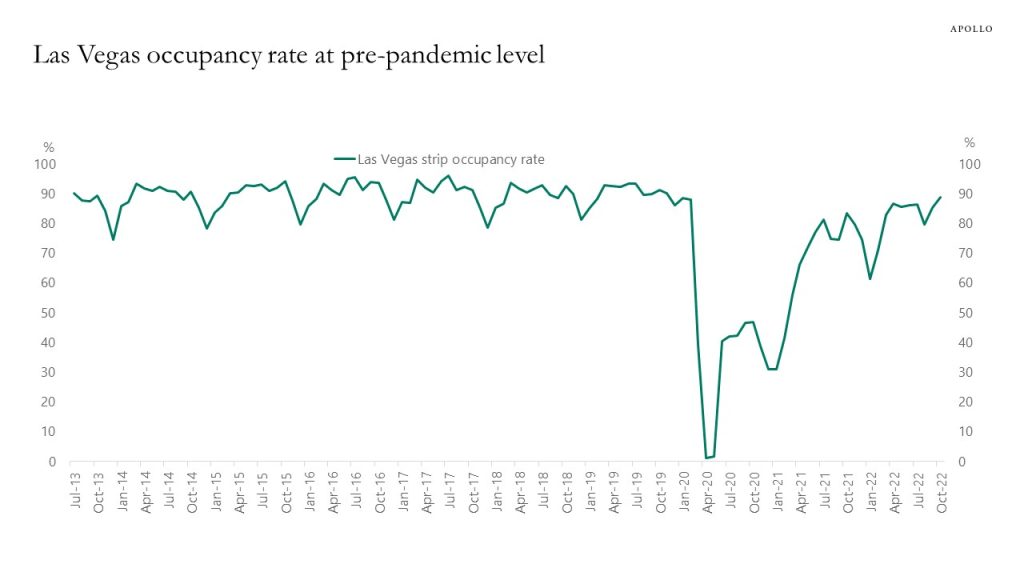
Source: Bloomberg, Apollo Chief Economist See important disclaimers at the bottom of the page.
-
The Bank of Japan owns almost 50% of all Japanese government bonds outstanding, see chart below.
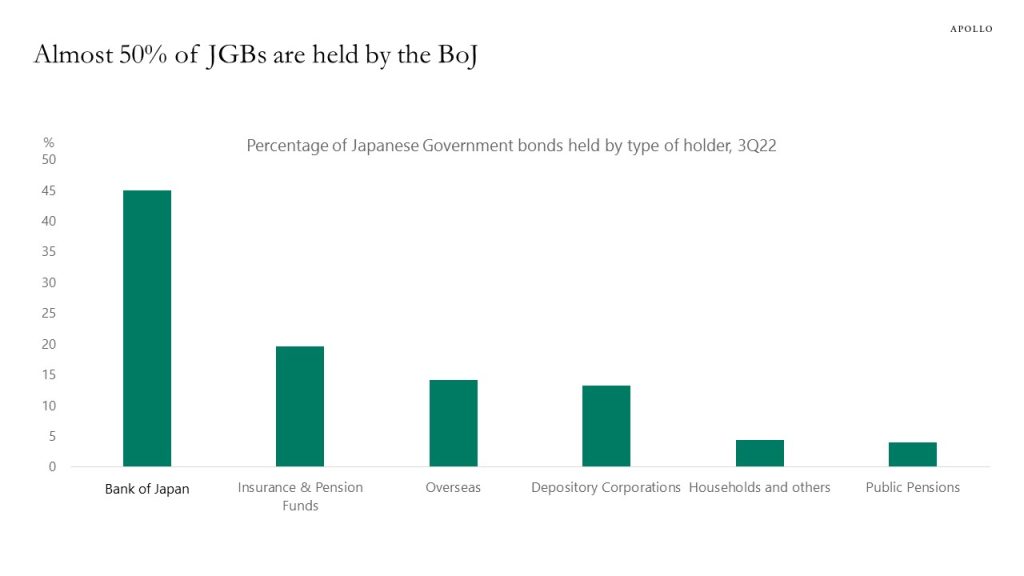
Source: Bloomberg, Apollo Chief Economist See important disclaimers at the bottom of the page.
-
The slowdown in immigration growth in recent years has implications for the potential growth rate of the US economy and it is contributing to the ongoing tightness in the labor market, see chart below.
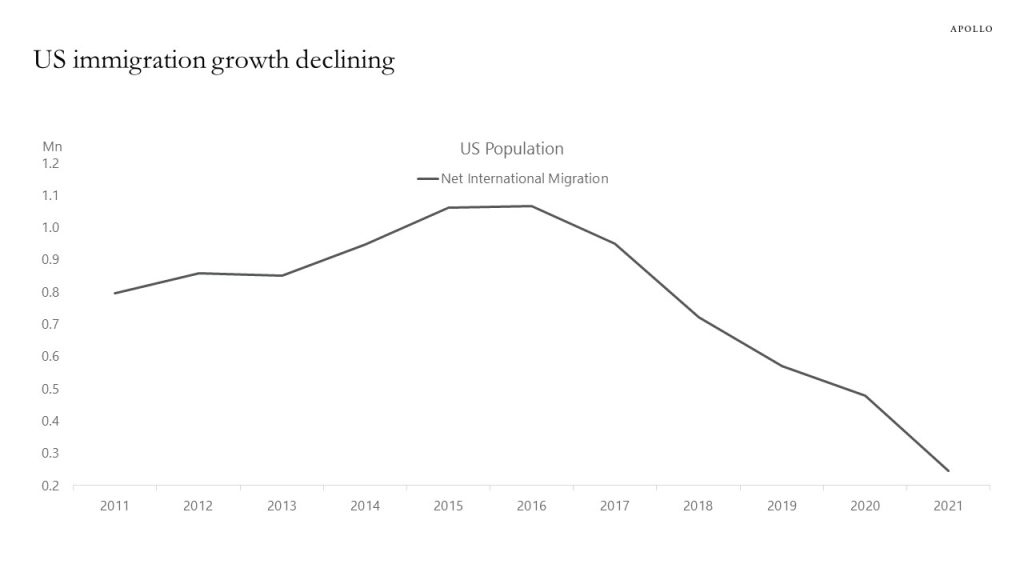
Source: Census Bureau, Apollo Chief Economist. NoteNet international migration for the United States includes the international migration of both native and foreign-born populations. Specifically, it includes: (a) the net international migration of the foreign born, (b) the net migration between the United States and Puerto Rico (c) the net migration of natives to and from the United States, and (d) the net movement of the Armed Forces population between the United States and overseas See important disclaimers at the bottom of the page.

This presentation may not be distributed, transmitted or otherwise communicated to others in whole or in part without the express consent of Apollo Global Management, Inc. (together with its subsidiaries, “Apollo”).
Apollo makes no representation or warranty, expressed or implied, with respect to the accuracy, reasonableness, or completeness of any of the statements made during this presentation, including, but not limited to, statements obtained from third parties. Opinions, estimates and projections constitute the current judgment of the speaker as of the date indicated. They do not necessarily reflect the views and opinions of Apollo and are subject to change at any time without notice. Apollo does not have any responsibility to update this presentation to account for such changes. There can be no assurance that any trends discussed during this presentation will continue.
Statements made throughout this presentation are not intended to provide, and should not be relied upon for, accounting, legal or tax advice and do not constitute an investment recommendation or investment advice. Investors should make an independent investigation of the information discussed during this presentation, including consulting their tax, legal, accounting or other advisors about such information. Apollo does not act for you and is not responsible for providing you with the protections afforded to its clients. This presentation does not constitute an offer to sell, or the solicitation of an offer to buy, any security, product or service, including interest in any investment product or fund or account managed or advised by Apollo.
Certain statements made throughout this presentation may be “forward-looking” in nature. Due to various risks and uncertainties, actual events or results may differ materially from those reflected or contemplated in such forward-looking information. As such, undue reliance should not be placed on such statements. Forward-looking statements may be identified by the use of terminology including, but not limited to, “may”, “will”, “should”, “expect”, “anticipate”, “target”, “project”, “estimate”, “intend”, “continue” or “believe” or the negatives thereof or other variations thereon or comparable terminology.